
Abstract
In this study, the nucleation and growth characteristics of equiaxed dendrites in near-isothermal solidification experiments, performed during two sounding rocket missions, MAPHEUS-6 and 7, are investigated. Two samples of the composition Al–15 wt pct Cu and one sample of the composition Al–46 wt pct Ge were processed in microgravity and several samples on ground. In situ X-radiography was performed to observe the nucleation dynamics and microstructure evolution during solidification of the 200 µm thin, disc-shaped samples. The measured dendritic growth rates and observed concentration distributions in the liquid indicate no difference between microgravity and on-ground horizontal experiments, in line with previous observations. On the contrary, a difference in the nucleation behavior was found. In all microgravity experiments bursts of nucleation were observed, which is different from comparable on-ground solidification experiments, where the nucleation occurs continuously. The combined analyses suggest that small variations of the concentration fields that probably originate from convective flow and buoyancy of the grains in the on-ground experiments, lead to a spatially variable nucleation undercooling distribution and hence to continuous nucleation. In contrast, the absence of convective flow in microgravity results in a more uniform nucleation undercooling distribution. The grains therefore nucleate in bursts at the surface walls, when the necessary nucleation undercooling is reached.
1 Introduction
To investigate the development of alloy microstructures during solidification largely uninfluenced by fluid flow and grain movement, experiments under microgravity conditions are ideal since gravitationally induced segregation and buoyancy are absent. Such reference experiments are preferentially used to validate solidification models, as it simplifies the task of numerical modeling.[1,2,3,4,5,6,7,8] With the technical advances in X-ray source technology, compact microfocus X-ray tubes are increasingly being used,[9,10] which lead to two new experimental application possibilities. First, X-ray tubes can be used on microgravity platforms to monitor solidification processes of metallic alloys in situ. Second, the X-ray beam can be aligned vertically in the laboratory, which allows for thin samples to be oriented horizontally, i.e. with their main flat surface oriented perpendicular to gravity. This is an advantage compared to synchrotron facilities where the beam is always perpendicular to gravity. In thin samples the superposition of thin structures is avoided and the movement of solid phases is reduced, so that distinct microstructural features can be observed in the radiography images. Therefore, the experimental performance of thin, horizontally oriented samples is very similar to that of microgravity experiments, which is why they are preferred to the costly microgravity experiments. However, it has to be considered that the sample confinement also influences the microstructure evolution in terms of morphology[11] and growth dynamics.[7,12,13] On three different sounding rocket flights (MASER 12/13/14), isothermal and directional solidification experiments of thin Al–20 wt pct Cu alloys were carried out.[14,15] While tip growth rates of isothermally solidified equiaxed dendrites were comparable to horizontal on-ground experiments,[16] directionally solidified columnar dendrites showed lower tip growth rates in microgravity condition compared to horizontal on-ground experiments.[17] The authors explain this discrepancy by natural convection that may be strong enough to modify the thermal or solutal fields. It shows that convection in thin samples can influence the microstructure evolution under certain conditions and that microgravity experiments are still needed to obtain benchmark data. In this context, the question remains to be answered whether convection also influences the nucleation dynamics of metallic alloys.
This study focuses on the nucleation and growth dynamics in thin samples solidified isothermally under microgravity conditions to better understand how experiments under microgravity conditions differ from experiments on ground. In addition to laboratory on-ground experiments,[18] we investigate nucleation rates and dendritic growth rates by performing in situ X-radiography on the sounding rocket MAPHEUS, which is a German acronym for MAterial PHysikalische Experimente Unter Schwerelosigkeit.[19] During two sounding rockets flights, MAPHEUS-6 and MAPHEUS-7, three samples were processed; two Al–15 wt pct Cu samples in identical furnaces on MAPHEUS-7 sharing one X-ray source, and one Al–46 wt pct Ge sample on MAPHEUS-6. The comparison with ground reference experiments demonstrates that the nucleation is affected by convection even for sample geometries as thin as 200 µm.
2 Experimental
2.1 Sample Preparation and Experimental Procedure
Al–Ge and Al–Cu alloy systems were selected for the experiments because both systems provide a good X-ray absorption contrast between the growing fcc-Al-dendrites and the interdendritic Cu/Ge-rich melt. For Al–Ge the contrast is slightly better due to the larger Ge content and with Ge being more absorptive than Cu. This enables in particular for Al–Ge to also visualize solute concentration evolution around the dendrites as described in Reference 20. The objective was to detect possible concentration gradient differences between horizontal experiments on ground and in microgravity. No grain refiner was added to the samples in order to have only a low number of dendrites nucleating, providing the possibility to in detail investigate the free-dendrite growth regime. Furthermore, the alloy systems are well characterized with experimental data from laboratory experiments being available.[21,22,23,24,25]
The unrefined Al–Cu and Al–Ge samples were cast from Al (99.9999 pct purity, Hydro Aluminium), Ge (semi-conductor quality, provided by the Institut für Kristallzüchtung (IKZ) Berlin) and Cu (99.99 pct purity, Alfa Aesar). The Al–Cu alloys were prepared by induction melting in a cold crucible in Argon atmosphere (6 N purity) before being cast into a copper mold as a cylinder with a diameter of 12 mm. The Al–Ge alloys were melted in a graphite crucible at ambient environment and then cast into a boron-nitride coated stainless steel mold, also as a cylinder with a diameter of 12 mm. Afterwards the rods were cut into disc-shaped samples of about 1 mm thickness, which were than ground down to a thickness of 200 µm using SiC abrasive paper. In addition, an Al–20 wt pct Cu sample inoculated with 0.1 wt pct Al–5Ti–1B grain refiner was used, which was provided by A.G. Murphy from the University College Dublin. It was processed on ground in order to measure the nucleation dynamics of a grain-refined sample.
2.2 Sounding Rocket Experiments
Microgravity experiments were carried out aboard the sounding rocket MAPHEUS using the XRISE-M facility.[19] XRISE-M is a sounding rocket X-radiography module based on a compact microfocus X-ray source. In XRISE-M two furnace units can be simultaneously processed. On the MAPHEUS-7 flight, we processed two near-isothermal furnaces based on the design earlier presented in Reference 26 with slight adaptation of the furnace holding frame. On the MAPHEUS-6 flight, one near-isothermal furnace was processed. The experiments were performed under vacuum conditions between 10–4 and 10–3 mbar. The furnace body, which is also the crucible is made of boron nitride. Two thin (150 µm) graphite foils enclose the sample and prevent direct contact between the liquid sample and the crucible. The detectors (RadEye2) consist of a CMOS camera with an active area of 49.3 × 49.3 mm and 1026 × 1026 pixels and a scintillator. They were operated at 1 frame per second (fps). One detector uses a structured CsI scintillator (used for MAPHEUS-6 and for MAPHEUS-7-2) the other one uses a Scint-X microstructured scintillator (microstructured Si filled with CsI as scintillator material used for MAPHEUS-7-1, see also Figure A1 in the Appendix). The standard CsI scintillator allows for a factor two higher signal, whereas the Scint-X scintillator provides sharper images due to suppression of pixel-cross talk. In general, the geometric resolution given by the native pixel pitch of 48 µm and the magnification factor of 3.2, is 15 µm effective pixel size. The X-ray source was operated at 70/60 kV acceleration voltage and 134/100 µA beam current for the Al–Ge/Al–Cu alloys, respectively. White and black correction images with no sample in the beam were taken about 2 hours before rocket lift-off. The samples were fully melted on ground with the samples aligned horizontally with respect to gravity. 30 images for further correction were recorded on the fully melted samples. The cooling sequence with a cooling rate of 1 K min−1 for Al–Cu and 3 K min−1 for Al–Ge was started on ground. The start of the cooling sequence within the countdown timeline was calculated such that nucleation of dendrites took place well within the microgravity time-window of six minutes. For this calculation a series of solidification and remelting runs was carried out on the flight samples. To avoid solute segregation the solidification runs were immediately stopped when the samples showed the first growing dendrites and the samples were subsequently remelted. Further, for remelting, the samples were brought from their inclined position to a horizontal position so that buoyant forces did not act on the samples. The final solidification run at the end of this test sequence was carried out on horizontally aligned samples to avoid macrosegregation. The slow cooling rates were chosen because the furnace exhibits the best isothermal performance at low cooling rates, and with the intention of observing the growth of the dendrites in detail and studying their concentration profiles. Since, the variation in nucleation undercoolings for the investigated unrefined Al–Ge sample was too large to ensure nucleation in the microgravity window at a cooling rate of 1 K min−1, a cooling rate of 3 K min−1 was chosen.

Temperature and acceleration profiles of the MAPHEUS-7 sounding rocket flight plotted against the time after lift-off (LO). Two thermocouples each monitored the temperatures of the two isothermal furnaces, ITF1 and ITF2. X-ray recording started as soon as microgravity conditions were reached. Dendritic solidification in the Al–Cu samples started for ITF1 and ITF2 200 and 203 s after LO, respectively (position marked by the two crosses). aRoll, a Pitch and aYaw refer to the three orthogonal axes of the rocket and monitor the acceleration
The measured temperature profiles of the MAPHEUS-7 flight are shown in Figure 1. On the x-axis the time after the rocket lift-off (LO) is plotted. Each furnace was equipped with two type-K thermocouples aligned symmetrically around the furnace, one of which was selected to set the temperature (TC1 of furnace 1 and TC4 of furnace 2). The brown curves show the measured accelerations in three different directions with respect to the rocket. Around 66 seconds after LO the microgravity phase was reached, recognizable by an acceleration of zero for all axes, which lasted for 390 seconds (6:30 [min:s]). The X-ray source and the detectors were switched on when the microgravity phase began (squares in Figure 1). Nucleation in both experiments started well inside the microgravity phase (134 and 137 seconds for furnace 1 and 2, respectively). It has to be noted that the here measured furnace temperature deviates from the real sample temperature. Furthermore, the graph shows the expected behavior of differing furnace (thermocouple) temperatures for a similar sample temperature, because the position of the thermocouples varies slightly in all cases. For this reason, absolute temperatures cannot be considered in the analysis of the results.
2.3 Ground-Based Experiments
The ground-based experiments were carried out either in the XRISE-M[19] facility to perform post-flight experiments on the MAPHEUS-6 sample, or in the laboratory X-ray facility XRISE-PF.[18] Pictures showing the main components of both facilities can be found in the Appendix in Figure A1. A detailed description of XRISE-PF is given by Klein et al.[18] It hosts a transmission microfocus X-ray tube, a detector module and a sample environment chamber. Into the sample environment chamber, an experimental cartridge can be inserted. The cartridge can be evacuated up to 10–4 mbar, which enables sample processing under vacuum conditions. The X-ray source and furnace are identical of those used in the XRISE-M facility, only the detector is different. The detector system consists of a camera with a 24 mm × 36 mm CCD sensor of 4024 × 2680 pixels (CCD-/COOL-11000XR) equipped with a structured CsI scintillator. For the Al–Ge/Al–Cu alloys, the X-ray source operated with 60/70 kV and 100/134 µA, respectively. The Field of View (FOV) is 10.5 mm with a sample on detector magnification of ~ 2.3 and a calculated effective pixel size of 4 µm. The images were recorded with 1 fps and an image processing procedure was applied following[12] to reduce the image noise. The image processing procedure involves averaging three images. The measurements and analyses were performed with the averaged images, which thus have a time resolution of 3 seconds. The same procedure was applied on the microgravity images.
The experiments, consisting of several successive heating and cooling cycles, were conducted in the near-isothermal furnace described above, with the sample plane aligned either horizontally or vertically with respect to gravity. The horizontal alignment minimizes fluid flow in the melt. The experiments consist of preheating steps followed by subsequent heating to target temperature. After holding and homogenization of the melt, controlled cooling rates of 1 or 3 K min−1 were set. This procedure was typically repeated for several heating and cooling cycles.
2.4 Overview of the In Situ Experiments
The samples used in this study and the respective processing procedures are summarized in Table I. A schematic drawing is provided in Appendix in Figure A1, which lists the experimental facilities, configurations, and samples used for the different experiments in detail.
3 Results
In this section, the nucleation and growth dynamics of the sounding rocket experiments MAPHEUS-6 and MAPHEUS-7 and of some of the on-ground experiments are described in detail. Nucleation and growth dynamics are investigated because they play important roles in controlling the final grain size of the solid alloy. They determine the grain density and morphology characteristics of the alloy. Therefore, these growth characteristics are decisive for the mechanical properties of the final product.
3.1 Nucleation
3.1.1 Microgravity experiments
3.1.1.1 MAPHEUS-6
In the Al–46 wt pct Ge sample 48 dendrites nucleate, which results in a grain density of 0.4 grains mm−2 (X-radiography images of the solidification sequences can be seen in Figure 12(b), Section III–C). The nucleation starts preferentially in the center (first burst) and is followed by two nucleation bursts (Figure 2(a)). The two nucleation frequency peaks occur 50–60 and 90–100 seconds after the start of the first dendrite nucleation, which is denoted t0. Up to a solidification time of 70 seconds, dendrites nucleate in the whole disc of the sample. In the third burst, dendrites nucleate preferentially in the outer sample region outside a radius r > 4 mm (Figure 2(b)). In Figure 3 the distance between a nucleation event and the nearest solid phase (denoted nearest nucleation distance NND) is shown as a function of time. This nucleation distance decreases from 800 to 170 µm with time, i.e. with undercooling.

(a) Grain nucleation frequency in the experiment MAPHEUS-6 (Al–46 wt pct Ge) plotted against solidification time. The grey line shows the cumulative grain nucleation fraction in pct with solidification time. (b) Nucleation times in the experiment MAPHEUS-6 plotted against the distance from sample center. Distinct events of nucleation are observed

Nearest nucleation distance (NND) from the closest solid phase in the experiment MAPHEUS-6 (Al–46 wt pct Ge) plotted against time. Most of the dendrites nucleate close to their nearest neighbor (< 1.5 mm), especially at later solidification time. The NND decreases with solidification time, which corresponds to an increasing undercooling of the melt
3.1.1.2 MAPHEUS-7-1
166 dendrites nucleated inside the first Al–15 wt pct Cu sample, which results in a grain density of 1.1 grains mm−2. Two main nucleation events are identified, the first between 8 and 18 seconds and the second between 48 and 58 seconds after t0 (Figure 4(a)). Similar to the observations in MAPHEUS-6, the grains in the first burst nucleate everywhere (a little bit later in the outer rim) and in the second burst in a region outside a radius r > 2 mm (Figure 4(b)).

(a) Grain nucleation frequency in the experiment MAPHEUS-7-1 (Al–15 wt pct Cu) plotted against solidification time. The grey line shows the cumulative grain nucleation fraction in pct with solidification time. (b) Nucleation times in the experiment MAPHEUS-7-1 plotted against the distance from the sample center. Distinct events of nucleation are observed
3.1.1.3 MAPHEUS-7-2
74 dendrites nucleate in the second Al–15 wt pct Cu sample, which results in a grain density of 0.5 grains mm−2. Different from MAPHEUS-6 and MAPHEUS-7-1, there is a nucleation gradient from the right to the left side, indicating the presence of a temperature gradient and the disturbance of the isothermal temperature field. The nucleation occurs in four main bursts (Figure 5). In Figure 6, these bursts are illustrated as red bars on the time-line on the left side and the assumed isotherms are sketched as green dotted lines. Under the assumption of a radial constant temperature gradient from right to left, the nucleation time and the distance from the right side give the equiaxed front propagation velocity. Considering the cooling rate, the temperature gradient can be estimated to be 0.14 K mm−1. The yellow dendrite numbers and arrows mark the dendrites and their arms that are used for dendrite growth rate measurements in Section III–B.
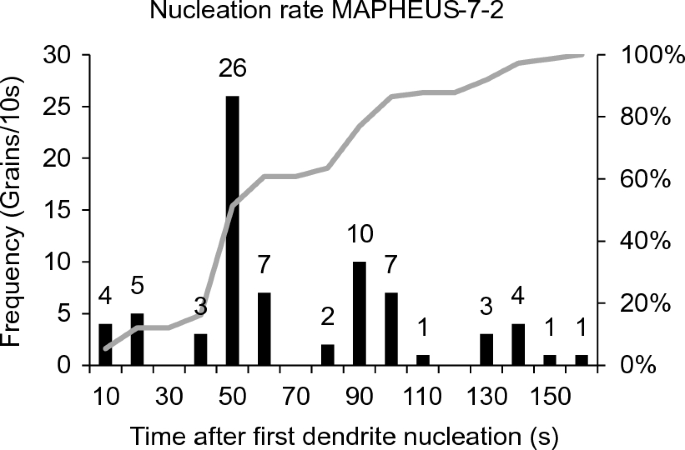
Grain nucleation frequency in the experiment MAPHEUS-7-2 (Al–15 wt pct Cu) plotted against solidification time. The grey line shows the cumulative grain nucleation fraction in pct with solidification time. Distinct events of nucleation are observed

In situ X-radiography sequence of four different time steps of the experiment MAPHEUS-7-2 (Al–15 wt pct Cu). The dendrites nucleate from right to left, which indicates the presence of a temperature gradient. On the time line on the left, the four major nucleation events are shown as red bars. The green dotted line indicates the approximate position of the nucleation front, which follows the temperature gradient. The yellow dendrite numbers and arrows mark the dendrites and their arms that are used for dendrite growth rate measurements in Section III–B (Color figure online)
3.1.2 Ground-based experiments with horizontal sample configuration
3.1.2.1 Al–20 wt pct Cu grain-refined with 0.1 wt pct Al–5Ti–1B
The grain-refined Al–20 wt. pct Cu sample was processed three times using a cooling rate of 1 K min−1. In every cooling cycle 77, 72 and 73 grains nucleated inside the FOV, respectively, which results in a grain density of approximately 0.5 grains mm−1 (Figure 7(a)). This number is similar to the number of the MAPHEUS-6 and MAPHEUS-7-2 samples, where no additional grain refiner was added. In contrast to the microgravity experiments, the nucleation frequency is continuous which is documented in Figures 7(b) and (c). Moreover, the nucleation dynamics of all the cooling cycles show a similar behavior with time (in particular the cooling cycles #1 and #3) and nucleation started for all three cycles within a temperature range of 1 K. Although experiment cycles #1 and, #2 and #3, have been performed on different days.

(a) In situ X-radiography images of three consecutive cooling cycles of the grain-refined Al–20 wt pct Cu sample recorded 215 s after the start of solidification. (b) Grain nucleation frequency and (c) cumulative grain nucleation fraction in pct of the three cycles (#1 to #3) plotted against solidification time. Grain nucleation occurs continuously with solidification time
3.1.2.2 Post-flight sample MAPHEUS-6
After the MAPHEUS-6 flight, the Al–46 wt pct Ge sample was preserved and used for post-flight on-ground horizontal solidification experiments in the X-RISE-M module. Three consecutive cooling cycles were performed. In situ X-radiography images of all three cycles (PT1, PT2 and PT3) and of the MAPHEUS-6 experiment recorded 130 seconds after the start of nucleation are shown in Figure 8(a). In total, more dendrites nucleated in the microgravity run (48) compared to the post-flight runs PT1, PT2 and PT3 (32/33/33). The grain nucleation frequency plots in Figures 8(b) and (c) show that nucleation in the on-ground experiments do not occur in bursts, which is in contrast to the MAPHEUS-6 microgravity experiment. Moreover, the nucleation undercooling and dynamics differ from run to run, which is in contrast to the experiments performed using grain-refined samples (see the previous section). Since the thermocouple temperature was recorded for all experiments, a relative comparison of nucleation temperatures was possible. The first dendrite nucleation in the sample at the highest thermocouple temperature was recorded in PT3. Accordingly, t0 in Figures 8(b) and (c) was set to this temperature and all other nucleation events in the other solidification runs were adapted relative to this temperature. This is why nucleation in the other experiments starts later at t0(PT3) + 8 s for PT1, t0(PT3) + 40 s for MAPHEUS-6 and t0(PT3) + 74 s for PT2. The scatter plot in Figure 9 shows the time of nucleation plotted against the distance from the sample center. Similar to the MAPEUS-6 and MAPEUS-7-1 experiments, the grains that form at a later time nucleate more frequently at a greater distance from the sample center.

(a) In situ X-radiography images of the MAPHEUS-6 flight sample (Al–46 wt pct Ge) and of three post-flight experiments PT1–PT3 with the same sample, recorded 130 s after the start of solidification. (b) Grain nucleation frequency and (c) cumulative grain nucleation fraction in pct plotted against solidification time

(a) Nucleation times in the post-flight MAPHEUS-6 cooling cycle experiments plotted against the distance from the sample center. (b) is the same plot with the sounding rocket flight data of MAPHEUS-6 included. In contrast to the MAPEUS-6 microgravity experiment, clearly distinguishable nucleation events are not evident for the post-flight experiments
3.2 Dendritic Growth Rates
3.2.1 MAPHEUS-7-1
Growth rate measurements of the dendrites marked with yellow arrows in Figure 10 were carried out manually using the ImageJ plugin “Manual Tracking”.[27,28] The position of the tip for every averaged image was measured and a velocity was calculated assuming a constant velocity between the images. The growth rates of several dendrites of the first and the second burst are plotted in Figure 10. Dendrites of the first burst show varying growth velocities between 6 and 17 µm s−1 for the first 60 seconds and then show a velocity decrease. The decrease approximately coincides with the second burst of dendrite nucleation. These dendrite tips show fast growth velocities after nucleation between 25 and 38 µm s−1 that immediately decelerate within 10 seconds. About 60 seconds after the first dendrite nucleation all dendrites show similar growth velocities.

Growth rates of several dendrites in the Al–15 wt pct Cu sample of the experiment MAPHEUS-7-1 (top image). Dendrites from the first population are marked with red circles on the X-radiography image (bottom image), while dendrites nucleated in the second burst are highlighted with blue circles (Color figure online)
3.2.2 MAPHEUS-7-2
The growth rates of eight dendrites (cf. Figure 6) from the first and the second burst were measured and are plotted in Figure 11. First, the dendrites show a short interval of decreasing velocities before the growth rates increase. The increase is stopped by a fast decrease to zero. Since there is a temperature gradient, the time axis cannot be converted directly to undercooling, but must be corrected with the temperature gradient. This is further discussed in Section IV–D.

Growth rates of several dendrites in the Al–15 wt pct Cu sample of the experiment MAPHEUS-7-2
3.3 Liquid Alloy Concentration
The concentration in the liquid can be visualized only qualitatively for MAPHEUS-6 and MAPHEUS-7-2. Since there was no calibration of greyscale values, no quantitative measurements were possible. For MAPHEUS-7-1, the micro-structured Scint-X scintillator did not provide enough contrast to qualitatively resolve concentration differences in the liquid of the Al–15 wt pct Cu sample MAPHEUS-7-1.
Figures 12(a) and (b) show the microgravity experiments MAPHEUS-7-1 (Al–15 wt pct Cu) and MAPHEUS-6 (Al–46 wt pct Ge), for three timesteps in false-color, respectively. In Figure 12(c), a post-flight experiment (PT1) of the Al–46 wt pct Ge sample that was flown on MAPHEUS-6 is shown, which was repeated on ground in the same configuration, but with the sample oriented horizontally. Figure 12(d) shows three timesteps of an Al–35 wt pct Ge sample processed in XRISE-PF on ground with a vertical sample orientation. For Figures 12(a) through (c), the contrast was adjusted by using the same parameters, which is feasible since the same detector module was used. The contrasts of the images in Figure 12(d) was adjusted to match with the other images.

X-radiography snapshots of three different solidification times of (a) MAPHEUS-7-2, (b) MAPHEUS-6, (c) the post-flight on-ground experiment run of the MAPHEUS-6 sample PT1 and (d) an on-ground experiment of an Al–35 wt pct Ge alloy processed vertically with respect to gravity. (a) through (c) were processed in the facility XRISE-M, whereas (d) was processed in XRISE-PF. The color corresponds only qualitatively to the melt composition. For (d) the contrast is adjusted in such a way that it resembles the contrast of the other images. The initial nucleation undercooling ΔTN is not known. t0 corresponds to the time of first dendrite nucleation in each sample (Color figure online)
The vertical on-ground experiment with Al–35 wt pct Ge shows clear differences in the concentration distribution compared to the microgravity and horizontal experiments. After nucleation, the Al-dendrites float upwards and accumulate at the top of the sample, whereas the Ge-rich solute sinks down, which leads to strong macrosegregation. Since some dendrites are stuck between the sample surfaces, the Ge-solute is entrapped in the upper part by the dendrites that are below (see blue area in Figure 12(d), t = 24 seconds). Due to solute rejection, plumes of Ge-rich liquid form below the dendrites.
In contrast, the distribution around the dendrites of the horizontally processed Al–46 wt pct Ge sample is uniform and comparable to the distribution of the concentration field in the microgravity experiment. Although no visual differences can be seen (compare Figure 12(b) with Figure 12(c)), it cannot be excluded that small differences exist, for example in front of the dendrite tips that cannot be resolved by the projected images. The comparison of the distribution of the solute field around a dendrite is difficult, as it would require two grains that grow under exactly the same conditions regarding undercooling, grain orientation and growth rates. Moreover, the sample of the post-flight experiment is a little bit thinner than during the microgravity flight, because during the reentry of the rocket the not yet fully solid sample was squeezed, which changes the contrast in the images slightly.
4 Discussion
4.1 Nucleation Dynamics in Microgravity and on Ground
If there is no grain refiner inside the melt, the first dendrites nucleate at varying undercoolings ΔTN that can differ by more than 10 K for repeated cooling cycles as was shown for this setup in Reference 21. If grain refiner is added, the first dendrites nucleate at the same undercooling ΔTN for repeated cooling cycles according to the free-growth condition.[29] For an Al–5Ti–1B master alloy, the potent TiB2 particle size shows a log-normal distribution, i.e. the size varies continuously.[30] Nucleation is triggered when the condition for nucleating a new grain, i.e. a minimum undercooling for a given size of the particle is reached. This means that grains nucleate continuously with increasing undercooling (one peak over time) in isothermal solidification conditions. One-peak nucleation in grain-refined alloys was also proven to take place in our furnace using grain-refined Al–20 wt pct Cu samples. They show one wide peak over the solidification interval of ~ 200 seconds (see Figure 7). This is different from directional solidification experiments in which the grains nucleate in distinct bursts (several peaks over time).[31,32,33,34] The wave-like nucleation in directional solidified alloys results from the temperature gradient and an inhibited nucleation zone due to solute rejection.
If no grain refiner is added, but the dendrites appear nevertheless at the same undercooling for repeated cooling cycles, there must exist a potent nucleant in the melt triggering nucleation. This was found to be the case in the MAPHEUS-7 experiments, since a reproducible nucleation time was observed and required. The origin and nature of these nucleants is unknown, but they could be oxide or impurity particles at the oxide sample layer. Nucleation bursts in unrefined and isothermally solidified alloys was never reported and is also not observed in our on-ground experiments. We performed three cooling cycles with the post-MAPHEUS-6 flight sample on ground and found no distinct bursts of nucleation. In Figure 13 the normalized number of nucleation events (grain number at solidification time t divided by the total grain number of the respective experiment) is plotted against the normalized time of solidification. The nucleation behavior of the grain-refined Al–20 wt pct Cu samples was reproducible between several runs. The blue dotted line in Figure 13 symbolizes the average. The nucleation behavior of the unrefined Al–46 wt pct Ge on-ground experiments was much more variable, but no nucleation bursts can be seen (dashed lines), which is in contrast to the microgravity MAPHEUS-6/7–1 experiments, which clearly show nucleation bursts (solid green lines). It is worth to mention here the results of the microgravity experiments of XRMON-SOL, an isothermal solidification furnace flown on the sounding rocket MASER 13 with a grain-refined Al–20 wt pct Cu sample.[16] No burst-like nucleation was reported, which was expected for a grain-refined alloy, since the nucleants have a continuous size distribution.

The number of grains is plotted against the solidification time for several samples of different compositions and processed under different conditions (µg and horizontal on ground). The grain number and the experiment time is normalized to 1 to allow for a comparison between the different experiments. Different from all on-ground experiments, the microgravity experiments show several steep rises in the number of grains that correspond to nucleation bursts (Color figure online)
Since the experiment furnace is constructed in such a way that the heat comes from the sample borders, there exists a small radial temperature gradient in the order of 0.1 K mm−1 for a cooling rate of 1 K min−1.[26] More precisely, there is an inner zone of approximately 9.0 mm diameter, where the grains nucleate simultaneously and an outer zone where a gradient exists.[35] Accordingly, the later grain nucleation in the outer region > 4.5 mm from the center is most likely caused by a higher temperature, which explains that more dendrites nucleate at a later solidification time in the outer region (cf. Figures 2 and 4). But at the same solidification time, many grains nucleate also in the interdendritic space. In the MAPHEUS-7-1 experiment, the grains that nucleate later show a higher tip growth velocity (only grains from the inner region have been measured), which indicates that they nucleated in a higher undercooled melt than the first-burst grains and not only at a later solidification time. The grey level values also indicate that new grains nucleate in melt regions that still obtain the initial alloy composition C0 (see Section IV–C). Considering MAPHEUS-6 and the post-flight on-ground experiments, more dendrites nucleate in the microgravity run (48 compared to 32/33/33 in the on-ground experiments). All of it suggests that the radial temperature gradient alone is not the only factor for the nucleation bursts in microgravity, but that there must be another mechanism causing the nucleation bursts for near-isothermal solidification conditions, which is further discussed in the next sections.
4.2 Dendrite Nucleation Positions and the Impact on the Nucleation Conditions
A major difference between the experiments in microgravity and on-ground is that the convection conditions are different. Although the convection in thin horizontal samples is minimized on a large-scale (see Figure 12), small-scale convection still takes place. Three-dimensional mesoscopic modeling of equiaxed dendrites examined the effect of convection and dendrite growth positions in thin samples.[36] Olmedilla et al. found that the dendrite growth rates increased with the presence of convective flow and that the influence of the convective flow on dendrite growth rates is greater when the dendrite arms grow at the top wall compared to the case when the dendrites grow in mid-thickness.
Tomographic investigations of the MAPHEUS-7-2 flight sample revealed that the dendrites nucleate close to or at the oxide layer on both sides of the sample boundary and then grow either parallel to the surface or with a small angle across the sample towards the other surface.[37] We assume similar nucleation sites at the oxide layers for the other microgravity and for the on-ground experiments. If nucleation takes place mainly at the sample walls, mechanisms that would move potent nucleant particles differently under microgravity conditions, such as particle pushing caused by the solidifying front or Marangoni flow, can be excluded as reasons for the different nucleation dynamics. Dendrites processed in horizontally oriented samples accumulate at the upper sample surface, probably after detaching from the lower sample wall due to buoyancy.[37] This movement of dendrites affects the solute boundary layer surrounding the dendrites. Therefore, a more likely explanation is that stronger convective flow in the horizontal on-ground experiments swirls the melt causing variable melt concentrations so that the conditions for nucleation are randomly met. Convective flow in microgravity condition is absent causing less turbulence of the melt and the conditions for nucleation are more uniformly met. Hence, the potent nucleants should have a similar size causing nucleation at the same level of undercooling.
4.3 Nearest Dendrite Nucleation Distance (NND)
It can be concluded from Figure 3 that the NND decreases with increasing undercooling. This can be attributed to the narrower distribution of the solute field surrounding existing dendrites when the undercooling of the melt is higher and the growth rates are faster. Measurement of the NND thus provides information on the extension of the diffusion field around a dendrite. This aspect is analyzed in more detail in Figure 14. Gray value intensity profiles in sample MAPHEUS-6 are measured from the solid phase of an existing dendrite (D1) into the melt for four different time steps (Figures 14(a) and (b)). At t0 + 59 seconds a new grain (D18) nucleates along the profile. The distance between the solid phase of the first dendrite and the nucleation site is 0.4 mm. Gray value intensities show that the melt concentration is close to the nominal concentration C0 at the nucleation site prior to the nucleation event. Furthermore, the growth rate of D1-2 decreases instantaneously when D18 nucleates, leading to the conclusion that the solute field of D18 overlaps with the solute field of D1.

(a) X-radiography sequence of four time steps during the solidification experiment of MAPHEUS-6. (b) Gray value intensity profiles plotted for each time step. A new grain (D18) nucleates between time step t0 + 56 s and t0 + 59 s. (c) Growth rate measurements of the dendrite arms 1 and 2 of D1 and D18
A comparison of the NND between the MAPHEUS-6 and the MAPHEUS-6 post-flight experiments PT1, PT2 and PT3 is shown in Figure 15. It can be seen that the first dendrites nucleate up to five millimeters away from each other in the on-ground experiments. On the contrary, the dendrites in the microgravity experiment nucleate closer to each other and with a higher frequency. This results in a higher grain density. The closest NND in the on-ground experiments is between 0.34 and 0.58 mm, whereas the closest NND in the microgravity experiment is 0.17 mm. In addition, the average NND in the on-ground experiments is also much larger (1.3 to 1.5 mm) than the NND in the microgravity experiment (1.0 mm) (see solid horizontal lines in Figure 15). This supports the assumption of a slower propagation of the solute enriched melt in microgravity. It should be noted here that the opposite behavior regarding NND was observed in directional solidification experiments on MASER-14 in µg and in horizontal on-ground experiments, which demonstrates the different characteristics of the directional and isothermal solidification behavior.[15]

Nearest nucleation distance (NND) measured from the in situ X-radiography images of the sample MAPHEUS-6 (Al–46 wt pct Ge) and the post-flight on-ground experiments PT1, PT2 and PT3. Particularly the first nucleation events (inside the dotted circle) are further apart in the on-ground experiments
Figure 16 shows the schematic evolution of the equilibrium liquidus temperature in front of a dendrite tip, adapted from Reference 38. Since the grains nucleate in an undercooled melt, the latent heat generated by grain growth is extracted by the surrounding liquid leading to an initially negative gradient. Assuming a small temperature gradient towards the outer region, there is a zone of maximum nucleation undercooling not too far away from the first grain (max. ΔT in Figure 16). The size of this zone decreases the more grains nucleate. Hence, the probability that a grain will nucleate close to an adjacent grain is higher than the probability that it will nucleate somewhere in the sample. The value of the local undercooling is very sensitive to the constitutional undercooling and the actual temperature in the sample, which is not exactly known. Hence, convection effects that change the concentration gradient and the temperature, influence the constitutional undercooled zone in such a way that nucleation in experiments on ground is more randomly distributed in the sample. In fact, the difference in the concentration distribution must be small or occur mainly in the thickness direction, as the overall X-radiography images (cf. Figure 12) show no visible differences. However, it is not possible to distinguish concentration differences below 0.2 at. pct.[12] A better image resolution and signal/noise ratio would be necessary to resolve even smaller and localized changes.

Schematic representation of the equilibrium liquidus and the actual temperature profiles close to a grain. The maximum undercooling is composed of the constitutional undercooling and the thermal undercooling (actual temperature)
4.4 Dendritic Growth Rates
Dendrite tip growth rates of equiaxed dendrites depend on the melt undercooling. As the dendrites nucleate in an undercooled melt, the growth rates will first be high. Then, due to solute rejection, a solute layer builds up in front of the tips slowing down the growth rates. The initial slowing down of the growth rate could also be associated with the orientation of the grain with respect to the thin sample plane. If the growth directions of the dendrite arms are positioned in such a direction that they come into contact with the sample surface, an initial slowing down can be the result. In the measured values this is reflected by an initial transient of a high growth rate slowing down to a growth rate plateau. Finally, the increasing melt undercooling due to the cooling rate will direct the growth rate and either acceleration or deceleration is the result. In conclusion, dendrites that nucleate at the same undercooling should grow at the same growth rate. In thin samples, deviations of this behavior are expected, because the dendrite arms grow at different angles to the sample plane and surfaces,[37] which can lead to varying growth conditions for the arms of the same dendrite.
Whether similar growth rates for the same undercooling are reached can be tested with experiment MAPHEUS-7-2, because there is a temperature gradient and we assume that the dendrites nucleate approximately at the same undercooling. Using the correction of undercooling caused by the gradient, the tip velocities shift on the x-axis accordingly, as can be seen in Figure 17. Compared to Figure 11, the growth velocity curves of the accelerating growth regime have moved closer together, which indicates that the melt undercooling is the main driver of the tip growth velocities. The deviations result from the different orientations of the arms inside the sample.

Gradient corrected tip growth velocities of the MAPHEUS-7-2 experiment plotted against undercooling. The undercooling increases according to the applied cooling rate of 1 K min−1. Similar velocities are reached by the dendrite arms for the same undercooling. The time of nucleation is transferred into undercooling (compare to Fig. 11)
5 Conclusion
The solidification of three thin alloy samples (two Al–15 wt pct Cu samples and one Al–46 wt pct Ge sample) in a near-isothermal furnace under microgravity conditions has been studied by X-radiography. The comparison of growth characteristics between microgravity and horizontal on-ground experiments showed no observable differences in terms of dendrite tip growth velocities or concentrations, but clear differences in the nucleation dynamics. In microgravity conditions, grain nucleation takes place in distinct bursts, whereas in experiments on ground nucleation takes place continuously. This difference was found by measuring the time of the appearance of each single grain and its lateral position in the sample. In addition, the nearest dendrite nucleation distance (NND) was found to be smaller in microgravity than on ground. Since the dendrites nucleate mainly at the sample surfaces in microgravity, we conclude that the discrepancy in nucleation dynamics cannot originate from a different movement behavior of particles, but that it can best be explained by convective flow, which results in melt turbulence affecting the diffusion layer and in non-uniform nucleation conditions in experiments on ground. Since there is no convection due to density differences in microgravity, the distribution of undercooling in the sample is more uniform. For a more detailed interpretation, it would be important to identify the potent nucleation sites and to increase the spatio-temporal resolution of the recording. Although individual dendrite arms grow under different angles and therefore under different growth conditions due to variable orientations of the grains in the sample, their growth rates are mainly determined by the melt undercooling, which is demonstrated by similar tip growth rates after temperature gradient correction of sample MAPHEUS-7-2. Whether the growth rates of microgravity and horizontal on-ground experiments are exactly the same, could not be evaluated because the initial nucleation undercooling could not be measured, which is however necessary for proper interpretation of the data. In particular, the investigation of nucleation dynamics in isothermal microgravity conditions should receive further attention in the future to test the results obtained here.
References
M.E. Glicksman, M.B. Koss, and E.A. Winsa: Phys. Rev. Lett., 1994, vol. 73, pp. 573–76. https://doi.org/10.1103/PhysRevLett.73.573.
Y.B. Altundas and G. Caginalp: Nonlinear Anal. Theor., 2005, vol. 62, pp. 467–81. https://doi.org/10.1016/j.na.2005.02.122.
A.G. Murphy, G. Reinhart, H. Nguyen-Thi, G.S. Salloum Abou Jaoude, and D.J. Browne: J. Alloy Compd., 2013, vol. 573, pp. 170–76. https://doi.org/10.1016/j.jallcom.2013.04.027.
D.R. Liu, N. Mangelinck-Noël, C.A. Gandin, et al.: Acta Mater., 2015, vol. 93, pp. 24–37. https://doi.org/10.1016/j.actamat.2015.03.058.
S. Akamatsu and H. Nguyen-Thi: Acta Mater., 2016, vol. 108, pp. 325–46. https://doi.org/10.1016/j.actamat.2016.01.024.
R.P. Mooney, L. Sturz, G. Zimmermann, and S. McFadden: Int. J. Therm. Sci., 2018, vol. 125, pp. 283–92. https://doi.org/10.1016/j.ijthermalsci.2017.11.032.
A. Olmedilla, M. Zaloznik, and H. Combeau: Acta Mater., 2019, vol. 173, pp. 249–61. https://doi.org/10.1016/j.actamat.2019.05.019.
S.A. Nabavizadeh, R. Lenart, M. Eshraghi, S.D. Felicelli, S.N. Tewari, and R.N. Grugel: Acta Astronaut., 2020, vol. 175, pp. 163–73. https://doi.org/10.1016/j.actaastro.2020.05.059.
C. Rakete, C. Baumbach, A. Goldschmidt, et al.: Rev. Sci. Instrum., 2011, vol. 82, p. 105108. https://doi.org/10.1063/1.3650468.
F. Kargl, M. Balter, C. Stenzel, T. Gruhl, N. Daneke, and A. Meyer: J. Phys. Conf. Ser., 2011, https://doi.org/10.1088/1742-6596/327/1/012011.
M. Becker, J.A. Dantzig, M. Kolbe, S.T. Wiese, and F. Kargl: Acta Mater., 2019, vol. 165, pp. 666–77. https://doi.org/10.1016/j.actamat.2018.12.001.
M. Becker, L. Sturz, D. Bräuer, and F. Kargl: Acta Mater., 2020, vol. 201, pp. 286–302. https://doi.org/10.1016/j.actamat.2020.09.078.
B.P. Athreya, J.A. Dantzig, S. Liu, and R. Trivedi: Philos. Mag., 2006, vol. 86, pp. 3739–756. https://doi.org/10.1080/14786430500157060.
D.J. Browne, F. Garcia-Moreno, H. Nguyen-Thi, et al.: Miner. Met. Mater. Ser., 2017, https://doi.org/10.1007/978-3-319-52392-7_80.
F. Ngomesse, G. Reinhart, H. Soltani, et al.: Acta Mater., 2021, https://doi.org/10.1016/j.actamat.2021.117401.
A.G. Murphy, R.H. Mathiesen, Y. Houltz, et al.: J. Cryst. Growth, 2016, vol. 454, pp. 96–104. https://doi.org/10.1016/j.jcrysgro.2016.08.054.
H. Nguyen-Thi, G. Reinhart, G. Salloum-Abou-Jaoude, et al.: Microgravity Sci. Technol., 2014, vol. 26, pp. 37–50. https://doi.org/10.1007/s12217-014-9370-4.
S. Klein, D. Bräuer, M. Becker, et al.: Int. J. Microgravity Sci. Appl., 2016, vol. 33, p. 330405. https://doi.org/10.15011/jasma.33.330405.
F. Kargl, J. Drescher, C. Dreissigacker, et al.: Rev. Sci. Instrum., 2020, vol. 91, p. 013906. https://doi.org/10.1063/1.5124548.
M. Becker, S. Klein, and F. Kargl: Scripta Mater., 2016, vol. 124, pp. 34–7. https://doi.org/10.1016/j.scriptamat.2016.06.032.
M. Becker: in Solidification Kinetics in Al–Cu and Al–Ge Alloys Investigated by In-Situ X-ray Radiography, RWTH Aachen University, 2017. https://doi.org/10.18154/RWTH-2017-09726.
M. Becker, S. Klein, and F. Kargl: Phys. Rev. Mater., 2018, vol. 2, p. 073405. https://doi.org/10.1103/PhysRevMaterials.2.073405.
A.K. Boukellal, J.-M. Debierre, G. Reinhart, and H. Nguyen-Thi: Materialia, 2018, vol. 1, pp. 62–9. https://doi.org/10.1016/j.mtla.2018.04.008.
A. Bogno, H. Nguyen-Thi, G. Reinhart, B. Billia, and J. Baruchel: Acta Mater., 2013, vol. 61, pp. 1303–315. https://doi.org/10.1016/j.actamat.2012.11.008.
A.G. Murphy, R.H. Mathiesen, Y. Houltz, et al.: J. Cryst. Growth, 2016, vol. 440, pp. 38–46. https://doi.org/10.1016/j.jcrysgro.2016.01.032.
M. Becker, C. Dreissigacker, S. Klein, and F. Kargl: Rev. Sci. Instrum., 2015, vol. 86, p. 063904. https://doi.org/10.1063/1.4922359.
W.S. Rasband: https://imagej.nih.gov/ij/, National Institutes of Health, Bethesda, 1997–2018.
F. Cordelières: https://imagej.nih.gov/ij/plugins/track/track.html, Institut Curie, Orsay, 2005.
A.L. Greer, A.M. Bunn, A. Tronche, P.V. Evans, and D.J. Bristow: Acta Mater., 2000, vol. 48, pp. 2823–835. https://doi.org/10.1016/S1359-6454(00)00094-X.
Y.J. Xu, D. Casari, Q. Du, R.H. Mathiesen, L. Arnberg, and Y.J. Li: Acta Mater., 2017, vol. 140, pp. 224–39. https://doi.org/10.1016/j.actamat.2017.08.053.
Y.W. Jia, D.H. Wang, Y.A. Fu, et al.: Metall. Mater. Trans. A, 2019, vol. 50A, pp. 1795–804. https://doi.org/10.1007/s11661-019-05144-w.
A. Prasad, S.D. McDonald, H. Yasuda, K. Nogita, and D.H. StJohn: J. Cryst. Growth, 2015, vol. 430, pp. 122–37. https://doi.org/10.1016/j.jcrysgro.2015.06.024.
E. Liotti, C. Arteta, A. Zisserman, A. Lui, V. Lempitsky, and P.S. Grant: Sci. Adv., 2018, vol. 4, p. eaar4004. https://doi.org/10.1126/sciadv.aar4004.
S. Feng, E. Liotti, A. Lui, M.D. Wilson, and P.S. Grant: Acta Mater., 2021, vol. 221, p. 117389. https://doi.org/10.1016/j.actamat.2021.117389.
M. Wegener: Morphological Transitions in Al–Ge Alloys Observed with In-Situ X-Radiography, RWTH Aachen University, 2020. https://doi.org/10.18154/RWTH-2020-10607.
A. Olmedilla, M. Zaloznik, M.C. Fernández, A. Viardin, and H. Combeau: IOP Conf. Ser. Mater. Sci., 2019, vol. 529, p. 012040. https://doi.org/10.1088/1757-899x/529/1/012040.
M. Becker, M. Kolbe, S. Steinbach and F. Kargl: Scripta Mater., 2022, vol. 209, p. 114386. https://doi.org/10.1016/j.scriptamat.2021.114386.
D.H. StJohn, M. Qian, M.A. Easton, and P. Cao: Acta Mater., 2011, vol. 59, pp. 4907–921. https://doi.org/10.1016/j.actamat.2011.04.035.
Acknowledgments
We thank the teams of DLR Mobile Rocket Base (MORABA) and Swedish Space Corporation (SSC) for their excellent service in making the MAPHEUS campaigns a success. We thank Hydro Aluminium Bonn, for providing us with the high-purity aluminum and the Institut für Kristallzüchtung (IKZ) in Berlin for providing us with germanium. We thank the team of the workshop, M. Nell, K. Afanasev, H. Esser, and R. Henrichs, for their excellent work in converting the mechanical design into operable parts. In addition, we thank A. G. Murphy from University College Dublin for providing us with the grain refined Al–Cu samples. We thank Ali K. Jafarizadeh from DLR for his support in taking the µCT images and S. Steinbach and M. Kolbe from DLR for reading this manuscript carefully. We thank Foto Medien-KP of DLR for taking the nice picture of the X-RISE-M module.
Conflict of interest
On behalf of all authors, the corresponding author states that there is no conflict of interest.
Author Contributions
MB: Conceptualization, data curation, investigation, visualization, writing—original draft, writing—review and editing. MW: Investigation, writing—review and editing. JD: Data curation, investigation, methodology, software. FK: Investigation, resources, project administration, writing—review and editing.
Funding
Open Access funding enabled and organized by Projekt DEAL.
Author information
Authors and Affiliations
Corresponding author
Additional information
Publisher's Note
Springer Nature remains neutral with regard to jurisdictional claims in published maps and institutional affiliations.
Appendix
Appendix
See Figure A1.

Schematic drawing that shows the experimental facilities, configurations and samples discussed in this work
Rights and permissions
Open Access This article is licensed under a Creative Commons Attribution 4.0 International License, which permits use, sharing, adaptation, distribution and reproduction in any medium or format, as long as you give appropriate credit to the original author(s) and the source, provide a link to the Creative Commons licence, and indicate if changes were made. The images or other third party material in this article are included in the article's Creative Commons licence, unless indicated otherwise in a credit line to the material. If material is not included in the article's Creative Commons licence and your intended use is not permitted by statutory regulation or exceeds the permitted use, you will need to obtain permission directly from the copyright holder. To view a copy of this licence, visit http://creativecommons.org/licenses/by/4.0/.
About this article

Cite this article
Becker, M., Wegener, M., Drescher, J. et al. Nucleation and Growth Dynamics of Equiaxed Dendrites in Thin Metallic Al–Cu and Al–Ge Samples in Microgravity and on Earth. Metall Mater Trans A 54, 4188–4202 (2023). https://doi.org/10.1007/s11661-023-07079-9
Received:
Accepted:
Published:
Issue Date:
DOI: https://doi.org/10.1007/s11661-023-07079-9