
Abstract
Four sandwich panel rooms were constructed as prescribed in the ISO 13784-1 test. However, the construction followed normal industry practice, and the panels were also subjected to the kinds of damage typically found in commercial premises, although such damage may not typically be concentrated in such a small room. The fire load was increased to simulate fires actually occurring in commercial premises by stepping up the propane burner output from the usual maximum of 300–600 kW, and by placing a substantial wooden crib in two of the rooms. The results showed significant differences in fire growth rate and burning behaviour between those panels filled with polyisocyanurate (PIR) and those filled with stone wool in both the experiments without and with the wooden crib. Most significantly, the PIR pyrolysis products caused earlier ignition (by radiation from above) of the wooden crib 11 min into the experiment (1 min after the burner was stepped up to 300 kW), whereas the crib ignited 22 min into the test (2 min after the burner had been stepped up to 600 kW, which is beyond the test standard both in time and heat input) for the stone wool panels. This interaction between building and contents is most often ignored in fire safety assessments. After a few minutes, the PIR pyrolysis products that escaped outside the room, from between the panels, ignited. The extra thermal exposure from the PIR-fuelled flames distorted the panels, which in turn exposed more PIR, resulting in large flames on both the inside and outside of the enclosure. From a fire safety perspective this is most important as it shows that with the large fire loads that are commonly found in commercial premises, steel-faced PIR filled panels are not capable of acting as fire barriers, and may support flame spread through compartment walls and ceilings. In addition, the PIR panelled rooms produced very large quantities of dense smoke and toxic effluents, whereas the stone wool panelled rooms produced small amounts of light smoke of lower toxicity. Furthermore, the experiments showed that modifications to the standard test can lead to extremely different outcomes for some of the products. As the modifications simulated real-life situations, it seems important to discuss whether the standard is robust enough for property safety scenarios encountered in industrial premises.
1 Introduction
Pre-fabricated “composite” or “sandwich” panels, typically composed of 1 mm steel sheets bonded on each side of a slab of insulation material, are increasingly popular as wall and ceiling materials in commercial premises. Sandwich panels are very often used to replace brick, breezeblock or concrete, in structures such as factories and warehouses. They allow very rapid construction, and provide excellent thermal insulation. Insulation is increasingly important to meet carbon emission targets, and an important characteristic in buildings for the food industry, where they are widely used, and where the risk of fire is high [1]. Typical dimensions are 1.2 m wide, with lengths ranging from 2.5 m to 13 m, and thicknesses of 40 mm to 230 mm. The panels may be filled with polymeric foam (polyurethane, polyisocyanurate, phenolic or polystyrene), glass wool, or stone wool. Frequently the panels are designed to interlock for ease of construction.
A doubling of fire losses involving polymeric foam filled sandwich panels in the UK between 1997 and 1999 led to refusals to provide fire insurance cover for food industry premises constructed from them [2]. For example, the total loss from fires in the UK food industry, where sandwich panels are often used, was more than 30 M€ in 1995 and was increasing every year [7]. In one fire—the 1993 Sun Valley poultry factory fire in Hereford, it was reported that “two firemen lost their lives due, it is thought, to an early collapse of plastic foam cored sandwich panels, which added to the fire load and resulted in massive smoke production making rescue and firefighting extremely hazardous” [3]. As such, maintaining panel stability and containment of the fire is essential if life safety, property protection, business continuity and environmental protection are to be assured [3]. However, fire loads observed in commercial premises are often high as a result of stored packaging materials, empty pallets and ongoing work. Estimation of fire loads in commercial premises [4] indicates an average of 747 MJ m−2. This is supported by the frequent observation of large fire loads documented photographically during surveys by insurance engineers [5]. The combination of steel sheets on the outer faces and mechanical interlocks are not always sufficient to isolate the combustible insulation materials from fires, particularly with a high fuel load, and as a result, an increase in the size and number of large, uncontrolled fires in buildings constructed with combustible core sandwich panels has been observed over the last 10 years [1].
The current study stems from large fires, each entailing losses of several hundred million Euros [1], where sandwich panels were used in the construction of the buildings. The escape of pyrolysis gases from expanded polystyrene foam sandwich panels in fire tests depends on the care and precision of construction. Tight-fitting metal edges can reduce fire spread and prevent flashover [6]. Another goal of the study was to establish whether non-structural damage to the panel faces affects fire performance of walls and roofs constructed from certain sandwich panels. As the most common insulation materials for sandwich panels are polymeric foam and mineral wool, these material types were chosen for the current study. Furthermore, both polyisocyanurate (PIR) foam and stone wool were selected because, of the widely used insulating cores, they had the highest fire safety ratings according to the Loss Prevention Council (UK) and FM Global (US).
The scope of the study was limited to a comparison of the performance of the two panels: one filled with PIR foam, and the other with stone wool, constructed to form a small standard test room. The ISO 13784-1 test protocol specifies a propane burner output of 100 kW for 10 min, which is stepped up to 300 kW for the following 10 min. It defines the end of test as the time when flashover is reached, or 30 min after ignition of the propane burner, whichever comes first. Herein, the ISO 13784-1 test protocol has been modified to establish:
-
1.
The influence of working to actual construction industry practices.
-
2.
The effects of larger fire loads which may be found in commercial premises.
-
3.
The effects of damage to the panel faces.
-
4.
The extent to which the sandwich filling is involved in the combustion process.
-
5.
The processes occurring within the panels and their influence on the fire behaviour.
-
6.
The generation and toxicity of smoke from the enclosure.
The effects of working to actual construction industry practices are likely to be significant but are very hard to quantify from a single series of experiments. Typically, installation on a building site may be one or two orders of magnitude faster than installation prior to a fire test. Inevitably, this will lead to greater variation in the gaps between panels, creating potential routes for pyrolysis products into the fire. The effects of damage to the panel faces falls into two parts: the overall effect, for which baseline (undamaged) test data is required; and the effects of each individual damage, for which local embedded thermocouple data will be analysed, but which is outside the scope of the current paper.
1.1 The Need for a Modified Test
Four potential reasons for the performance of sandwich panels being worse in real fires in commercial buildings than suggested by the results of the standard test were investigated in the current study. Some actual examples of deviations from the ideal test conditions observed in commercial premises, shown in Fig. 1, were incorporated into the experimental programme. The first was the observed failure to effectively fire-stop through-panel installations, such as cable trays and ventilation ducts, or to fill voids where such installations were not actually in place (Fig. 1a). The second derives from reports of breaches in the integrity of the metal skin of the panel through accidental damage, such as that from a forklift truck, or holes for pipework (Fig. 1b, c). The third was real fires with a much higher output than the 300 kW maximum from the burner, specified in ISO 13784-1, for example from stored pallets in actual commercial premises (Fig. 1d). The fourth was the different requirements placed on the installers of sandwich panels when constructing large buildings, compared to the technicians building small fire test rooms. In the former case, speed and final appearance may be the main goals rather than strict adherence to the manufacturer’s guidelines; in fire tests, technicians will know that the joints between panels must be in perfect alignment.

Fire hazards observed by insurance inspectors: (a) damage around structural steelwork and pipe and cable installation; (b) fork-lift truck damage to ceiling panels; (c) holes through both sides of a panel, where pipework was going to be, or had previously been, installed; (d) typical accumulation of fire load in a sandwich panel building
Some of these differences have been investigated by other researchers, and the panel mounting procedure has been cited [7] as one reason for the poor correlation between the ISO 13784-1 test and the intermediate scale Single Burning Item (SBI) test, used for classification in the European Construction Products Regulations. The authors of that study [7] concluded that it was dangerous to classify and make a fire safety assessment of sandwich panels based on intermediate scale tests, such as the SBI. A related study [8] on the fire performance of polystyrene filled panels also highlighted the importance of panel joint fixing, particularly highlighting the difference between aluminium and stainless steel for rivets and right-angled sections.
To test the sensitivity of these factors, the “small room” was subjected to carefully prescribed, simulated damage including pipe holes, installation of a cable tray and a ventilation duct and piercing by a fork-lift truck. In the first pair of experiments, the propane burner commenced at 100 kW and was stepped up to 300 kW after 10 min (as described in ISO 13784-1), and then going beyond the ISO protocol to 600 kW. In the second pair of experiments, a large wooden crib was placed in the test room to represent a more realistic fire load. The planned fire load density of the wooden cribs in the current experiments was 700 MJ m−2 in each room, believed to be representative of the higher fire loads found in commercial premises. A lower fire load density of 400 MJ m−2 was used for the PIR room for safety reasons, because flashover was observed in the PIR experiment without the wooden crib. These values were selected as they are in line with both inspection data from If P&C Insurance [5] and survey values in the literature [4].
2 Experimental Set-Up and Procedure
2.1 Materials
The test rooms were constructed from two commercially available metal faced sandwich panels. The first comprised sandwich panels with a core of closed cell polyisocyanurate (PIR) foam. The thickness of the panel was 100 mm. According to the manufacturer’s description, the panels are suitable for internal and external wall and roof applications. They are FM (Factory Mutual) Approved to FMRC 4880 Class 1 Fire Classification with unlimited height, and Conformité Européenne (CE) marked with a reaction-to-fire class of B, s2, d0 [9].
The second comprised sandwich panels with a core of stone wool. The thickness of the panel was 100 mm. According to the manufacturer’s description, the panels can be laid horizontally or vertically and are suitable for external wall applications. The panel is LPCB (Loss Prevention Certification Board) certified to LPS 1181 and LPS 1208 as EXT-A60, FM Approved to FMRC 4880 class 1 with non-combustible core and unlimited height.
2.2 The Modified Test
ISO 13784-1 (reaction to fire tests for sandwich panel building systems—Part 1: Small room test) [10] describes the construction of a “small room”, of internal dimensions 2.4 m × 3.6 m × 2.4 m (W × L × H), with a single open doorway 0.8 m wide and 2.0 m high, from sandwich panels, supported by a rigid steel frame. It uses the same methodology as the ISO 9705 room corner test [11], with a sandbox propane burner situated near the rear corner of the room, with an output of 100 kW for 10 min followed by an output of 300 kW for 10 min. In ISO 13784-1, the walls and ceiling are made from sandwich panels, and form the room enclosure, whereas in ISO 9705 the material under test is the wall lining, mounted on non-combustible walls.
The sandwich panel experiment rooms were based on the shape and dimensions prescribed in ISO 13784-1 [10]. Each room consisted of four walls at right angles and a ceiling, and was located on a rigid, non-combustible surface. The experiments were conducted outside over 2 days in mild conditions with light winds and no rain. For the two burner-only experiments the temperature varied from 17°C to 15°C (for the PIR and stone wool rooms respectively) with a steady 8 km h−1 wind, for the two experiments with a wood crib, the temperature remained at 16°C and the wind speed was a steady 16 km h−1.
The room was built to the specification in ISO 13784-1, with internal dimensions accurate to within ± 0.05 m in each direction. The sandwich panels were fixed to the outside of a pre-constructed steel frame. The construction of the experiment rooms was carried out by a local construction firm who regularly erect sandwich panel buildings. They were asked to fit the panels as they would in a typical installation, in order to be more representative of industrial and commercial premises constructed with sandwich panels.
A total of four experiments were conducted, as summarised in Table 1. Measurements of temperature, heat flux, inlet and effluent gas velocities, effluent toxicity and video data were collected. The first set of experiments, 1 and 2, were carried out with a propane sandbox burner, as the only fire load. In the second set of experiments, 3 and 4, a wooden crib was placed in the room as an additional fire load. Plans of the experiments showing the locations of instruments, damaged areas, and the wooden cribs are included in “Appendix 1”.
2.3 Non-structural Damage
The location of damage and the actual damage to the wall and ceiling panels is indicated schematically in Fig. 2.

Images of the damage to the panels and their location (a) 10 screw holes; (b) Cable tray, expanding plastic foam; (c) detail of the 100 mm diameter hole (experiments 1 and 2); (d) Cable tray, approved fire sealing; (e) forklift damage; (f) blanked off ventilation duct
2.3.1 Holes for Pipe-Work
In experiments 1 and 2 only, three holes were cut through the panel, each with a diameter of 100 mm. The holes were positioned 300 mm, 1 200 mm and 2 100 mm below the inner face of the ceiling, in the centre of the rear wall, thus exposing the insulation material.
2.3.2 Cable-Tray
An empty cable tray was installed 500 mm below the ceiling, which crossed the entire width of the room, and penetrated both sides of the sandwich panel at each end. In experiments 1 and 2 the cable tray was 500 mm away from the rear wall, almost directly above the burner, and was sealed with expanding plastic foam at the burner end, and approved fire sealant at the opposite end. In experiments 3 and 4 the cable tray was 1000 mm away from the rear wall, and the burner end was fire stopped with stone wool and a steel plate (following normal construction industry practice), while the opposite end was sealed with expanding plastic foam.
2.3.3 Forklift Damage
Representative of typical forklift truck damage to the ceiling, potentially caused by the raised load apron, the inner metal sheeting was removed on an area of 50 mm x 25 mm, thereby exposing the insulation material. The damage was positioned at the centre of the ceiling.
2.3.4 Screw-Holes
On the side wall adjacent to the sandbox burner, 10 screw-holes of 10 mm diameter were made by drilling through the inner metal sheeting and 40 mm into the insulation material. The holes were positioned 1 500 mm above the floor and 1 700 mm from the rear wall of the room.
2.3.5 Ventilation Duct
A ventilation duct was installed close to the doorway, positioned with its centre 500 mm from the ceiling and 500 mm from the front wall. The diameter of the ventilation duct was 300 mm, and the hole was cut very precisely to fit around the duct. After mounting the ventilation duct, the hole was sealed with food industry approved sealant, and the duct was capped at both ends.
2.4 Sandbox Burner and Propane Supply
A sandbox burner compliant with ISO 9705 and ISO 13784-1 was placed in the rear corner of the room. The burner had face dimensions of 170 mm × 170 mm and its face height was 200 mm above the floor, filled with gravel, then sand, to ensure an even gas flow over the area of the burner.
Five 47 kg propane cylinders were connected to a manifold and the flow to the burner was controlled manually using regulators attached to each cylinder. The temperature compensated volumetric supply of propane was measured (in standard litres per min corrected to 25°C and 101.32 kPa) using an Omega FMA 2600A mass flow controller. Propane exists as a liquid in the cylinder, but is released as a gas. The latent heat of vaporisation causes a significant cooling of the cylinders at the flow rates needed for the 600 kW burner setting, so that at a given regulator setting, the flow of propane will gradually fall. In order to minimise this effect, the propane cylinders were placed in water baths (to increase their thermal inertia). Nevertheless, the propane flow required periodic adjustment at the regulators and the actual supply only approximated the planned value; the first three stages of the burner output are shown in Fig. 3 (at the final stage the burner is turned off). Further, in the first experiment, the gas flow was inadvertently ramped from 100 kW to 300 kW after 7 min, instead of the planned 10 min. (The effect this increase may have had is considered in the discussion, under “Burner and Wooden Crib Experiments”.)

Planned burner output. The first 20 min are equivalent to the input heat release rate prescribed in ISO 13784-1
The total heat supply was calculated from the flow of propane according to Eq. 1, and assumes complete combustion:
where \( \dot{Q} \) is the Heat Release Rate (HRR) of the burner (kW), \( \Delta H_{C} \) is the net heat of combustion of propane (also known as the lower heating value) (kJ g−1), MR is the relative molecular mass of propane (g mol−1), \( \dot{V} \) is the volumetric supply of propane (L s−1), and Vm is the volume occupied by 1 mol of ideal gas at 25°C (L mol−1).
2.5 Wooden Cribs
The additional fire loads for experiment 3 and 4 were provided by wooden cribs, constructed from rough sawn softwood (spruce) with density 360 kg m−3. The cribs were placed on the floor of the room, equidistant from the front and rear walls, against the wall furthest from the burner (see “Appendix 1”). Since the PIR room went to flashover in the burner-only experiment, it was decided to use a smaller quantity of wood for the PIR panel room experiment to ensure the safety of the test personnel. In order to test the fire performance of the stone wool enclosure closer to its limits, a wooden crib with a greater fire load was used for this experiment, as originally planned. Although the masses of each crib were different, the dimensions were identical: height, 1000 mm; width, 1000 mm; length, 1500 m. Each strut had a square cross-section of 50 mm × 50 mm. The crib used in the PIR enclosure contained 169 kg of wood, and was constructed from 11 layers of 8 struts, each 1.0 m long and 11 layers of 6 struts, each 1.5 m long. In the stone wool enclosure a 297 kg wooden crib was used. It was constructed from 11 layers of 15 struts, each 1.0 m long and 11 layers of 10 struts, each 1500 mm long. A 300 kg wooden crib of the same dimensions is used in the BS 8414-2 facade test [12], having a nominal total heat release of 4500 MJ and peak heat output of 3.0 ± 0.5 MW. However, the ventilation is less restricted in the facade test, and the wood is ignited at its base with kerosene soaked sticks, whereas in this test the cribs were ignited by radiation from the hot layer above, with the top layer igniting first. In each case the intention was to only allow ignition of the upper layer of the crib from the radiation coming from above, so sheets of plasterboard were attached to the sides of the cribs facing the burner acting as heat shields to prevent ignition of the sides by radiant heat from the burner.
2.6 Instrumentation
2.6.1 Temperature, Air Velocity and Heat Flux Measurements
Temperature measurements were recorded throughout the experiments using K-type stainless steel sheathed thermocouples with a diameter of 1.5 mm. Over 100 thermocouples were placed inside the room and at the doorway, and inserted into the walls and the roof at various depths in order to investigate the thermal behaviour within the panels. Eight air velocity transducers (McCaffrey probes [13]) were located in the doorway to monitor the gas flow to and from the room. Heat fluxes were estimated using temperature measurements recorded within the walls, and using thin skin calorimeters [14], but are not reported in detail here.
2.6.2 Toxicity Measurements
Oxygen (O2), carbon dioxide (CO2), carbon monoxide (CO) and hydrogen cyanide (HCN) concentrations were sampled 150 ± 5 mm below the top of the doorway. CO, CO2 and O2 were measured continuously using integrated non-dispersive infrared (NDIR) analysers with an electrochemical cell for O2 (Crestline Instruments). HCN was collected in bubblers, using a mass flow controller to meter the volume, and analysed using the Chloramine T colourimetric procedure described in ISO 19701 [15].
3 Results
A short summary video [16] and article [17] of these tests have been made available on-line. The pair of experiments with the propane burner alone are described first, followed by the pair of experiments in which a large wooden crib was placed in the room. For each pair of experiments, the heat release rate applied from the propane burner and the calculated total heat release are presented, followed by visual and photographic observations of the burning rooms, temperature profiles recorded in the centre of the room, and gas concentrations measured near the top of the doorway to the room.
3.1 Experiments with Burner Only
3.1.1 Total Heat Release Rate in the Compartment
Heat release rate data are reported for both the input heat release rate and the calculated heat output. The input heat release rate was calculated directly from the mass flow of propane to the burner, assuming complete combustion (Eq. 1). The output heat release rate is calculated by a species evolution approach using oxygen consumption calorimetry (OC). This approach is based on Thornton’s principle [18] which assumes that the energy released by the burning organic material is proportional to the amount of oxygen consumed by the combustion reaction [19, 20] coupled to the measurements of effluent flow from the room. Due to the assumptions that had to be made to determine the velocity profile of the flow at the door, there is a potentially large uncertainty in the calculations.
Figure 4 shows the input heat release rate (HRR input) and the output heat release rate (OC—upper and lower limits), calculated from the oxygen depletion and gas flows, measured in the doorway during the PIR experiment. The uncorrected data is shown as the upper limit (assuming the measured flows to be precise, and the oxygen concentration to be uniform across the plume). In addition, an estimation of the uncertainty is shown as the lower limit, the probable heat release being within the “calculated HRR region”. The calculation methodology has been detailed in “Appendix 3”. In both experiments, the cooling effect of rapid propane vaporisation is apparent in the slight decrease of input heat release rate at the higher burner heat release settings. The supply of propane in the PIR test was shut off earlier (around 21 min after ignition), after having been stepped up to 600 kW for around 3 min. At this point the metal protection of the PIR panels had distorted so much in the vicinity of the burner that it was not considered safe to maintain the supply of propane.

PIR panels—heat input and output from experiments with burner only. OC refers to measurements based on oxygen consumption calorimetry. HRR—INPUT refers to the heat release rate from the gas burner
From Fig. 4, it can be seen that the heat output follows the heat input closely for the first 7 min. When the burner is stepped up to 300 kW, there is a rapid rise in the heat output. This could indicate that the increase in burner output ignites vapours that are already present in the room, presumably evolved from the PIR panels. The equally rapid fall in heat output after 18 min suggests that most of the available fuel has been pyrolysed. Stepping up the gas burner output to 600 kW only had a small effect on the output heat release rate.
Figure 5 shows the input heat release rate (HRR input) and the calculated heat release rate (OC), derived from the oxygen depletion and gas flows, and measured in the doorway during the stone wool panel experiment. The lower limit of the calculated HRR is obviously consistent with the heat input from the burner, as it represents the HRR correction due to the uncertainty in the oxygen concentration across the plume. This assumption considers that, in this experiment, the stone wool panels made a negligible contribution to the fire development, and the heat release is clearly much lower than for the PIR compartment.

Stone wool panels—heat input and output from test with burner only. OC refers to measurements based on oxygen consumption calorimetry. HRR—INPUT refers to the heat release rate from the gas burner
3.1.2 Visual and Photographic Observations
Figure 6 shows a sequence of photographs of the fire development in the PIR enclosure. Figure 6a shows the initial 100 kW propane flame before any decomposition of the panel occurred. Within 2 min, white smoke emerged from the gaps between the panels. 6 min later (Fig. 6b), the effluent became dark and sooty, indicating the contribution of PIR decomposition products to the fire, and a lighter grey smoke emerged from the gaps between the walls and ceiling panels. At the peak of flaming, large flames were observed outside the doorway (Fig. 6c) and smaller flames were observed near panel joints. At the rear of the room, significant flaming was observed from the 3 × 100 mm diameter holes, and on the non-fire stopped end of the cable tray. The propane supply was switched off 21 min after ignition. After 24 min the flaming had subsided, although there was significant damage to the panels, and large gaps were visible at the panel joints, where the steel sheets had distorted, exposing more PIR (Fig. 6d).

PIR panel enclosure: (a) at ignition; (b) after 8 min; (c) after 11 min; (d) after 24 min
Figure 7 shows photos from the stone wool panel experiments. It is worth noting that the experiments did not start before it got dark outside, due to the time constraints resulting from the extensive arrangement of thermocouples, gas velocity and heat flux transducers and gas monitoring equipment. The 100 kW flame soon after ignition is shown in Fig. 7a. Figure 7b, c show flames issuing from the 3 × 0.10 m diameter holes in the rear wall after the burner had been stepped up to 300 and 600 kW respectively. Small quantities of light smoke were evolved from the joints between the panels, but the effluent from the room was predominantly transparent, showing little contribution of the panels to the fire. The burner and flame were clearly visible throughout the duration of the experiment, in contrast to the PIR panelled enclosure. After 32 min, the panel joint nearest to the burner had opened, leaving a gap of a few centimetres (Fig. 7d). After another 8 min the burner was switched off.

Stone wool panel enclosure: (a) at ignition; (b) after 12 min; (c) after 30 min; (d) after 32 min. (b)–(d) A rear view of the compartment with flaming visible at holes and opened joint
3.1.3 Temperature Profiles
Figure 8 shows the volume-weighted average temperature from the hhest six thermocouples in the centre of the enclosure over the duration of the experiments. Individual temperature profiles are shown in the supplementary material, averages have been used to compare the results from the two experiments. The temperatures are presented as a volume-weighted average to compensate for the uneven spacing of thermocouples because the highest thermocouples were closest together, though the same in each test. This average is calculated by taking into account the different volumes represented by each thermocouple, so that each contribution is proportional to the volume they represent as a result of the uneven spacing. The volume-weighted average covers the volume from 0.8 m above the floor to the ceiling (around or above the neutral plane), which was calculated using Eq. 2 below:
where \( T_{avg} \left( t \right) \) is the volume-weighted average temperature, \( V_{i} \). and \( T_{i} \left( t \right) \) are respectively the contribution volume and temperature measurement of the \( i \)th thermocouple, and thermocouple 3 is the one located 0.8 m above the floor.

Volume-weighted average temperature of upper layer—burner only experiments
The data also show that the fluctuations in propane flow to the burner had an insignificant effect on the room temperature. Thermocouples are prone to error in fire experiments where hot and sooty upper layers exist above cooler clean layers [21], when radiant heating of the sooty thermocouple tips occurs.
There is quantitative agreement between the PIR and the stone wool enclosures for the first 7 min, at which point the burner in the PIR room was increased to 300 kW. In less than 1 min, the PIR panels contributed a large additional heat release to the burning room (Fig. 4), also observable as the increase in temperature from 150°C to 950°C. By contrast, the temperature profile in the stone wool enclosure follows that of the planned heat release rate (Fig. 3) reasonably closely for the entire duration of the experiment. The second temperature peak in the PIR test corresponds to the third stage at which the HRR from the burner was increased to 600 kW, with the contribution rate from the PIR panels apparently increasing during this stage.
3.1.4 Gas Concentrations
Figure 9 shows the CO and CO2 concentrations measured 0.15 ± 0.05 m below the top of the doorway in each enclosure. Both CO2 profiles are qualitatively similar to the total heat release profile, suggesting that the CO2 in the smoke is approximately proportional to the oxygen depletion, as expected.

CO2 and CO concentrations at doorway—burner only experiments
For the PIR panels, the CO2 concentration reaches a peak of 16.7% 11 min after ignition. The CO concentration reaches a peak of 3.75% slightly later, after around 13 min. This increase in CO concentration implies that the fire is becoming more under-ventilated.
The CO concentration peak occurring 2 min after the CO2 concentration peak, and the oxygen concentration falling to 0% from 11 min to 15 min, in the PIR room, provide additional insight into the fire behaviour. As the oxygen concentration falls within the room, the temperature and CO2 concentration fall, while the CO peak rises. Also, the main heat release step, which is the conversion of CO to CO2, shifts from inside the room to the plume outside the door. When the oxygen concentration in the room is close to zero, the high radiant flux and free radical concentrations drive the reaction forward, despite the lack of oxygen. The location of the sampling probe at the exit to the room may give higher CO concentrations and CO/CO2 ratios than would be found higher up in the plume. The CO/CO2 ratio will continue to decrease on mixing with air, until the temperature falls below 625°C [22], leading to lower CO in the smoke plume as it cools, moving away from the doorway.
Figure 10 shows the concentrations of hydrogen cyanide (HCN) measured during these experiments. As the effluent was collected in bubblers over different time periods, the calculated gas phase concentrations are averages over the sampling period (shown as bars in Fig. 10). Concentrations of up to 140 ppm were measured for the PIR panel room, while concentrations of around 20 ppm were measured for the stone wool panel room. The HCN from the PIR test is assumed to derive mainly from under-ventilated combustion of PIR foam. The HCN from the stone wool may derive from atmospheric nitrogen (15 ppm have been observed in methane flames [23]) and/or from decomposition of the polyurethane used in the manufacture of stone wool panels, to attach the wool to the steel sheet.

HCN concentrations—propane burner experiments (the horizontal bars indicate duration of bubbler sampling, the vertical bars indicate measurement uncertainty)
3.2 Experiments with Both Burner and Wooden Crib
3.2.1 Total Heat Release Rate in the Compartment
In the second pair of experiments, provision was made for the input HRR from the propane burner to be augmented via the involvement of a wooden crib fire. The mass of the crib was 297 kg in the stone wool enclosure and 169 kg in the PIR enclosure. In order to moderate the potential fire development these experiments were conducted without the three 0.10 m diameter holes on the rear wall, and with the cable tray located 1.00 m from the rear wall.
Figure 11 and Fig. 12 show the input heat release rate from the propane burner (HRR Input) and the calculated total heat release rate in the compartment (Heat output OC). The gas supply to the PIR experiment was switched off shortly after the transition to the second stage because the enclosure participated so readily in the burning that it was considered unsafe to continue supplying propane. In the stone wool enclosure experiment, propane was delivered to the burner until the crib had fully ignited, at 25 min.

PIR panels—heat input and output from test with burner and wooden crib (note that ignition of the crib occurred after 10 min, so the propane was switched off after 11 min)

Stone wool panels—Heat input and output from test with burner and wooden crib
In both cases the initial OC lower limit follows the HRR input curve (for 10 min for the PIR panels, and for 22 min for the stone wool panels). This is to be expected, because the fire was almost complete at this stage, and all combustion products left through the doorway. Soon after 20 min (when the burner is stepped up to 600 kW), the OC lower limit diverges from the HRR input, as the wood ignites. In both cases there was a substantial contribution to the heat release from the large wooden cribs. However, the most remarkable feature of the second pair of experiments is the dramatically shorter time to ignition of the wooden crib in the PIR enclosure (11 min with burner at 100 kW then 300 kW, rather than 22 min with burner at 300 kW then 600 kW). This may have been caused by the pyrolysis products from the PIR panels burning, adding to the total heat release rate. In Fig. 11 it can be seen that this effect is marginal until the burner is turned up to 300 kW. In addition, soot particles resulting from the incomplete combustion of the pyrolysis products, may have increased the radiant flux and thus contributed to the dramatic decrease in time to ignition of the wood crib. The different flame colour and smoke density is evident in photographs shown below.
3.2.2 Visual and Photographic Observations
The initial stages of the PIR panel with the 169 kg wooden crib experiment were similar to those of the PIR panels without the wooden crib, with white smoke emanating from the gaps between the panels. However, without the three holes in the rear, the fire growth in the room was slower. Eight min after ignition (Fig. 13b) black smoke started to emerge from the doorway, rapidly thickening and resulting in ignition of the upper surface of the wooden cribs at 11 min. At this point the fire grew very rapidly, leading to flashover. The smoke continued to thicken and when only the top layer of the wood had ignited, flames appeared in the smoke after it had left the doorway to the room. Two min after ignition of the upper surface of the crib, the bottom of the crib was fully involved on all surfaces, further increasing fire growth. 11 min later, at 22 min after ignition (Fig. 13c), the area of external flaming from the doorway was larger than the doorway itself. After 23 min, the main flaming started to subside, although at this stage large flames appeared at several places on the roof and several more around the upper part of the walls. Observation of the burnt-out room again showed significant distortion of the panels, which would have exposed the PIR and allowed most of it to burn.

PIR panel enclosure: (a) at ignition; (b) after 8 min; (c) after 22 min; (d) after 24 min
Figure 14 shows the burning behaviour of the stone wool room with 297 kg of wooden crib (which is used to create a 3 MW fire [12] in the façade test, where the crib surround has a different geometry). After 10 min, grey smoke was released from the gaps between panels, and at 21 min pyrolysis products above the top layer of wood were visible. At 22 min the top layer of the wood crib ignited and the flames progressively spread downwards, taking around 10 min to reach the bottom of the crib. The crib continued to burn after the propane was switched off (25 min) and more grey smoke emanated from the joints between the panels for a further 30 min, indicative of ventilated flaming. At the end of the test (Fig. 14e), the side and roof panels were still intact, though there was some fire damage around the cable tray and on the right angled section between the wall and the ceiling above the burner.

Stone wool panel enclosure: (a) 12 min after ignition; (b) after 22 min; (c) after 25 min; (d) after 35 min; and (e) after 63 min
3.2.3 Temperature Profiles
Figure 15 shows the weighted average temperature from the six highest thermocouples in the upper layer near the centre of the room (full profiles are shown in the supplementary material). There is some qualitative similarity between the temperature and the heat input from the propane burner for both experiments, up to 10 min for the PIR panels, and up to 22 min for the stone wool panels, corresponding to the time to ignition of the wooden crib in each experiment. The stone wool panel temperature profile shows a distinct peak when the wood ignited, followed by a decrease when the burner was switched off, i.e. the heating rate was still being driven by the burner. The higher temperatures in the PIR panel room show the contribution of PIR and wooden crib to the fire. For the stone wool room the burner output was increased to 600 kW for 3 min, whereas it was only increased briefly to 300 kW for the PIR enclosure.

Weighted average temperature of upper layer—burner and wooden crib experiments, showing time when the burner was turned off
3.2.4 Gas Concentrations
Figure 16 shows the CO and CO2 concentrations leaving the PIR and stone wool panel enclosures for the duration of the experiments incorporating a wooden crib. The CO2 concentration in the PIR enclosure was slightly higher than in the stone wool enclosure by the end of the first stage (100 kW). This correlates well with the observed increase in the temperature below the ceiling, and indicates a small contribution of additional fuel, presumably PIR decomposition products, to the heat output in this initial period of the experiments.

CO and CO2 concentration at doorway—burner and wooden crib experiments
At 10 min the burner output was increased to 300 kW (second stage) and at this point the combustion product measurements of the two enclosures diverged. The fire grew rapidly in the PIR panel enclosure; within a minute the crib ignited, corresponding to the increase after the small shoulder on the CO2 curve from 17% to 18%, at around 12–13 min. This provides evidence that there was already a significant amount of non-propane gaseous fuel in the room, driving rapid fire growth around the time the burner was stepped up from 100 to 300 kW.
In the first 5 min of the 300 kW burner stage both the CO and the CO2 concentrations measured in the PIR enclosure were higher than those measured in the stone wool enclosure. This occurred despite the fact that the burner in the PIR enclosure was cut at 12 min. When the crib ignited in the stone wool enclosure, the CO2 concentration increased to around 11%, rising to 15% at 39 min. This is lower and later than the CO2 peak concentration in the PIR enclosure of 18% at 15 min. The very high concentrations of CO after 10 min, and the small CO/CO2 ratio, varying from 0.1 to 0.4, are indicative of under-ventilated flaming.
Figure 17 shows the concentrations of HCN taken from the doorway during each experiment. The concentrations of HCN in this stone wool experiment are similar to those in the burner-only experiment (Fig. 10). The HCN concentrations at the peak of burning (10–20 min) are an order of magnitude higher, at around 1200–1400 ppm. This correlates with the very high yields of HCN found in the under-ventilated flaming of PIR measured under more carefully controlled conditions [33]. Again, the HCN from the PIR test is assumed to derive from under-ventilated combustion of PIR foam, while that from the stone wool may derive from atmospheric nitrogen [23] or possibly from decomposition of a polyurethane adhesive. High hydrogen cyanide yields derive from the presence of nitrogen in the fuel, particularly during incomplete combustion. Wood itself has very low nitrogen content (the three main components, cellulose, hemicellulose and lignin, contain no nitrogen at all). The nitrogen content of dry wood has been quantified [24] as 0.11%, thus the burning wooden crib would not be expected to contribute significantly to the HCN yield.

HCN concentrations—wooden crib experiments (horizontal bars indicate duration of bubbler sampling, vertical bars indicate measurement uncertainty). HCN concentrations from PIR experiment are on the left hand axis, and HCN concentrations from the stone wool experiment are on the right hand axis
4 Discussion
Four large scale fire experiments in which two types of sandwich panel, with the highest fire rating but different filling materials, are compared. The experiments deviate from the published protocol, ISO 13784-1 by including structurally superficial damage, construction that is believed to reflect normal installation practice, and higher fire loads. These changes were made in an attempt to reconcile the fire safety certification of certain types of sandwich panels with the very large fire losses in buildings where they have been used in the construction. A further aim of the experiments was to investigate the influence of each modification to the protocol: the set up for the last two experiments was changed as a result of the findings from the first two experiments.
4.1 Burner Only Experiments
The first two experiments with PIR and stone wool panels, respectively, showed very clear differences in fire behaviour resulting from differences associated with the filling materials. This is consistent with an earlier study [25], which found that flashover occurred in a PIR panelled room in the ISO 13784-1 test at 11:44 min (even though the propane burner was not stepped-up from 100 kW to 300 kW, because the “fire was close to flashover”). The HRR rose to a maximum of 900 kW (after subtraction of the burner output), at which point the propane supply was shut off. The heat release curve showed a progressive increase to around 250 kW in the first 10 min, followed by a rapid rise, starting at 10 min, from 250 kW to 900 kW. At 900 kW (used to define flashover in Ref. [25]), once the burner was turned off, the HRR fell below 100 kW within 3 min, or 15 min after ignition. It is to be noted that the constructions used by Johansson and Van Hees [25] had not resulted in flashover in the ISO 9705 test.
The HRR for the stone wool panelled room tested by Johansson and Van Hees [25] slightly exceeded the burner output (with an average HRR of around 10 kW for the first 10 min, rising to around 100 kW between 10 min and 20 min, after subtraction of the burner output), reaching a brief peak of 195 kW around 13 min. The report does not show the HRR after 20 min. These results are qualitatively consistent with those of the first two experiments reported in the current work. However, for the PIR panelled room, variations from protocol in stepping up the burner to 300 kW (after seven min in the current work, but not changed in the experiments by Johansson and Van Hees [25]) preclude more precise comparison. The heat release from both the experiments in stone wool panelled rooms corresponds to the lower limit of our HRR estimation, which matched the gas burner HRR baseline in order to define an error region for our calorimetry methodology due to the unavoidable uncertainty in the oxygen concentration across the plume, at the doorway.
In the work reported here, within a few minutes of the burner ignition, PIR vapours had escaped from gaps between the panels and damage holes, both internally and externally. Almost coincident with the early stepping-up of the output from the burner to 300 kW, these vapours ignited inside the room, rapidly increasing the total heat release. This led to widespread pyrolysis of the PIR, resulting in flashover within the room, and ignition of the pyrolysis products evolving from the gaps between panels on the outside of the room. Since the analytical equipment was only set up to monitor the effluent from the door, the contribution from products leaving the room from these gaps could only be estimated from the photographic evidence. Figure 13c suggests that a significant proportion of the flame volume was outside the room, and therefore the total heat release would be significantly greater than the one reported from inside the PIR enclosure. In enclosure fires the CO/CO2 ratio is used to characterise the fire stage [26]: data from Fig. 16 gives the peak of CO release as 3.75%, while the CO2 concentration at this point in time is 13%. This gives a maximum CO/CO2 ratio of 0.29 for the main period of flaming, a result which is consistent with a fully developed, under-ventilated fire [26].
In contrast, the total heat release, temperature and CO2profiles of the panels filled with stone wool followed the burning heat release curves for the duration of the experiment, showing negligible contribution of the panel filling to the fire growth. The maximum CO/CO2 ratio (0.04) is typical of well-ventilated flaming, and suggests a negligible contribution of the stone wool to the fire.
4.2 Burner and Wooden Crib Experiments
The second set of experiments with the wooden cribs were designed to investigate how sandwich panels withstood the more severe fire loads commonly found in commercial premises, and to extend the scope from a purely reaction-to-fire test, to one that included a period of fully developed flaming. The key research question was “can sandwich panels function as effective fire barriers when subjected to the fire loads that can be found in industrial and commercial premises?” After the first set of experiments it was expected that once the wood ignited, it would increase the rate of PIR pyrolysis, resulting in a larger fire than the stone wool room. The fact that the wood in the PIR panel room ignited 1 min after the 300 kW step-up (11 min), compared to 2 min after the 600 kW step-up (22 min) for the stone wool panel room was unexpected. The externally supplied thermal energy to the stone wool room was significantly more severe, with the combination of an extra eight min at 300 kW, and an extra four min at 600 kW from the propane burner. Still, in the PIR room, higher temperatures were recorded at the ceiling, higher concentrations of CO and CO2 were measured at the doorway, and visual observations of the fire showed that flaming extended further out of the doorway and much larger amounts of smoke were produced. Moreover, the fire spread from the top to the bottom of the wooden crib in 2 min in the PIR panel room, as compared to over 10 min for the fire in the stone wool panel room. This demonstrates that the PIR pyrolysis products made the fire grow more rapidly and become more severe than would result purely from the burners and the crib. This may have been caused by two factors. Firstly, fuel is released into the room by the decomposing PIR, and thus enhances the radiation from the upper layer, and secondly, the soot from burning the pyrolysis products increases the radiant component of heat transfer (glowing soot particles emit infrared radiation) (although the lower combustion efficiency will reduce the heat release from its calorific maximum). It seems that enough PIR pyrolysis products can escape through the small gaps between wall and ceiling into the room to have such a dramatic influence on the fire growth rate.
The different amount of wood in the two cribs will influence both the overall fire load, and possibly the burning rate (because of the greater packing density of the heavier crib). The fire growth rate of wooden cribs has been the subject of a number of detailed investigations [27, 28]. These have focused on smaller cribs than those described here, and have been used as ignition sources and ignited at their base, in the open, as opposed to in enclosure fires such as the ones presented herein. These studies highlighted important differences in the fire growth behaviour based on the packing density (the inverse of “porosity”) of the wood within the crib. It has been suggested that differences in crib porosity may contribute to the rapid fire spread in the crib in the PIR panelled room. However, other work on the burning rate of wooden cribs in the compartment fires [29] has shown that crib porosity is only a controlling factor in cribs made from thinner wooden strips. For cribs built from square sections of wood of diameter 40 mm or greater, the available surface area of the wood, or the dimensions of the opening (window or door) are the controlling parameters. Where the fire is in an enclosure, and becoming ventilation controlled, the area of the opening tends to control the rate of fire growth. Based on this data, and the lack of published information on downward flame spread in wooden cribs, it is not possible to assert that crib porosity was the major factor affecting the difference in flame spread down the cribs in the current work.
The gas concentrations (Fig. 16) can also be used to characterise the fire conditions. In the PIR panelled room, the peak value of the CO/CO2 ratio reached 0.5, with a steady value of around 0.25 in the main burning stage. The stone wool panel room never reached under-ventilated conditions, with a maximum CO/CO2 ratio of 0.03.
4.3 Fire Toxicity
In under-ventilated flaming conditions the yields of the main asphyxiants (carbon monoxide, and hydrogen cyanide when nitrogen is available from the fuel) increase by a factor of 10 or more, making the effluent much more toxic than when burning in well-ventilated conditions [30, 31]. In the PIR experiment with burner only, the peak CO is 3.75%, which is approximately 10 times the lethal concentration quoted in ISO 13344 [32], whereas the highest average HCN concentration of 150 ppm is approximately equal to the lethal concentration, each for 30 min exposure [32]. In contrast, a reported value when PIR foam is burnt alone in similar under-ventilated conditions, albeit at a reduced scale, showed HCN makes a greater contribution to the toxicity than CO by a factor of three [33]. Thus in the burner-only experiment, the lower HCN yield suggests that most of the CO came from the propane, reaching a peak when the burner was stepped-up to 600 kW. In the experiments with the wooden crib in the PIR panelled room, both the CO and the HCN concentrations are about 10 times greater than the lethal limit. Assuming all the HCN comes from PIR (as wood contains very little nitrogen) and the material burned in a similar way to the controlled experiments in the steady state tube furnace, it appears that about two thirds of the carbon monoxide came from the wood and around one third from the PIR.
The fire effluent toxicity measurements presented here are not representative of the entire burning behaviour. Three distinct types of smoke were observed during the PIR experiments: black smoke from the doorway, typical of under-ventilated flaming; white smoke believed to result from well-ventilated flaming outside the enclosure, fuelled by leakage of the pyrolysis products of PIR through gaps between the panels; and a dense yellow smoke formed by the anaerobic pyrolysis of PIR within the panels. Only the black smoke from the doorway was analysed in this experimental set-up, and the only analytes selected were the main asphyxiant gases, CO and HCN, alongside CO2 and oxygen.
4.4 The Modifications to ISO 13784-1
The test described in ISO 13784-1 makes a useful contribution to fire safety in establishing a benchmark protocol for judging the fire behaviour of sandwich panels. However, observations from within the insurance industry [5] suggest that while such panels may show good performance under the conditions in the test according to the ISO 13784-1 standard, in fact plastic foam panels have contributed to the development of fires that have resulted in heavy losses in commercial premises [1]. For example, there is no established methodology for quantifying the effectiveness of sandwich panels as fire barriers, which should protect neighbouring compartments from fully developed flaming.
The precision with which the panel room is built is known to affect the response of polyurethane and polyisocyanurate panels in the ISO 13784-1 test. Anecdotally, it is generally known that in tests where the smoke is unable to escape through joints to the outside of the panels, flashover occurs within 12 min (soon after the step-up to 300 kW). If the gaps are large enough to allow smoke to escape through the outer walls and ceiling, flashover does not occur, but a very smoky atmosphere in the test enclosure results. This seems to be largely independent of the actual PUR or PIR filling.
4.5 The Validity of the Experimental Data
The experimental results show unequivocal differences in the fire test behaviour between PIR and stone wool filled panels. They show that flammable PIR pyrolysis products make a significant contribution to fire growth, where the stone wool panels do not. The estimates of heat release and toxicity from the door opening are of more limited value. They are subject to experimental uncertainty in the gas flow measurements (McCaffrey probes) to and from the room, and ignore heat release from flaming occurring outside the room (above the doorway or around the panel joints). Thus, the large differences between the PIR and stone wool panels are more apparent from visual observation and photographs than from any quantitative measurements undertaken here. Performing these experiments under a hood and analysing the exhaust gases would provide more complete measurements of the heat release and toxic effluent, and show the greater differences between the PIR and stone wool panel fire behaviour seen in the photographs presented in Figs. 6, 7, 13 and 14.
4.6 Comments on the Minor Experimental Inconsistencies
The desire to vary the test protocol in order to optimise its modification, together with other practicalities, led to a number of experimental inconsistencies. However, it is not believed that they jeopardise the validity of the experiments. The inadvertent increase of the burner output to 300 kW after 7 min in the first experiment, instead of after 10 min as planned, led to a less severe test for the PIR panels. Even so, the vapours ignited soon after reaching 300 kW; further experiments would probably confirm that stepping-up the burner to 300 kW led rapidly to flashover. Keeping the burner output steady at a higher heat flux of 600 kW proved difficult with the equipment available, although this was barely noticeable in either the heat release measurements or the room temperatures. The larger wooden crib used for the stone wool test increased the duration of, and the total thermal exposure on, the stone wool panels. Again, there is no evidence that either the small variation in burner output or the different crib sizes had any significant effect on the fire behaviour (other than the longer burn time for the stone wool panels). Changing the damage protocol (by eliminating the large holes in the rear wall and moving the cable tray a further 500 mm from the burner in the wood crib experiments) reduced the ventilation but prevented fuel escaping from the room. It is difficult to predict how the results of the wooden crib experiments would vary if the conditions had been reversed. Where superficial damage penetrated both sides of the panel, it would have caused a significant enhancement of fire spread to the neighbouring compartment—but this was not quantified here. Superficial damage away from the heat source had a much smaller effect on the fire behaviour. One area where more clarity in the test protocol would be beneficial is to define when to switch off the burner, based on the amount of fire growth and flame spread. Clearly, when the room is fully ignited, it is pointless and may be dangerous to keep supplying propane to the flame, while shutting-off the burner too early could compromise the validity of the experiment.
After the test it became apparent from the video footage of the different behaviours of the burning paint flakes that the interior coating on the two types of panels supplied was different. Further investigation revealed that, the coating on the stone wool panel was of nominal thickness 55 μm, whereas the PIR panel had a nominal 120 μm coating. The thicker coating would be a slightly better insulator, and decrease the heat transfer from the propane burner to the PIR, but it would also contribute a little more heat release when burning to the test room. We do not believe that this small difference would have made a significant difference to the panel’s behaviour in any of these experiments.
5 Conclusions
The aim of this work was to provide experimental results to explain why buildings constructed with sandwich panels may contribute to large scale building fires. Our test methodology was to use insurance industry approved panels from each class, thus PIR was used to represent plastic foam insulated panels, and stone wool was used to represent mineral wool insulated panels. The single room-scale experiments, built following normal construction industry practice, used larger fire loads than those used in the standard ISO 13784-1 room test. The rooms had been subjected to typical damage found in such commercial premises, albeit at an unrealistically high density per unit area of panel. The resultant fires show clear differences in behaviour both between two types of panel filling and between the standard and the modified test. Specifically, once ignited (at around 10 min), the PIR pyrolysis products made a significant contribution to the fire growth. This was most apparent in the experiments with the wooden crib, where the time to ignition of the crib in the PIR room occurred one minute after the burner was stepped-up to 300 kW (11 min), as compared to happening after 10 min at 300 kW and two min at 600 kW (22 min) in the experiments with stone wool. This difference is due to the contribution to the fire from the pyrolysis of the PIR. Moreover, once ignited, the fire spread from the top to the bottom of the crib in the PIR room in just 2 min, whereas the same process took 10 min in the stone wool room. It seems unlikely that the differences in porosity would result in such a dramatic difference.
The most significant modification to the ISO 13784-1 standard was the increased fire load (higher output from the propane burner and the presence of the wooden crib). This extended the test protocol from a reaction-to-fire test into an assessment of the fire response to developed flaming. Because the current insurance industry classifications fail to distinguish between the two types of filling tested in the current study, yet they show radically different fire behaviour in the modified tests, this type of assessment should be introduced to ensure that the associated risks are understood and managed in the construction of buildings, and subsequently by owners and insurers, to help avoid large financial losses in the future.
The amount of structurally superficial damage in the room was greater than would typically be found in a single room in commercial premises. It was primarily included to study the effects of each type of damage. Though the details are not discussed here, it is evident that holes all the way through panels breach the fire barrier, independent of the filling material, and therefore increase the likely speed of fire development. The results clearly show the fire hazards of combustible foam insulation, and particularly the increased risk created by such structurally superficial damage.
Although only measured at the doorway, the amount of dense smoke, and its toxicity, was significantly greater from the PIR panel room, and visual observation suggests that the total volume and toxicity of the effluent from the PIR room would be much greater than that measured at the door.
The most significant result of this work is the evidence that sandwich panels, faced with non-combustible material, but filled with combustible insulation do not provide fire protection by acting as an effective fire barrier in the current scenarios, and contribute fuel to the fire. Photographic evidence, in particular, shows how flames emerge from the gaps between panels, causing further distortion to the steel plates, exposing large areas of foam for attack by the growing fire. However, in view of the experimental inconsistencies outlined in the discussion, this comparative study must be considered as qualitative, rather than quantitative. The study underlines the need for further research into the fire safety of this type of construction.
Preliminary reports of this work have been available on-line as video [16] and summary information [17] and were presented at the International Conference on Fire Safety Science (IAFSS) in Canterbury, New Zealand in February 2014.
References
Rosenbom A (2013) After the fire, risk consulting. Risk Manag J (2):6–9
The LPC design guide for the fire protection of buildings (2000) Fire Protection Association, Moreton in the Marsh, UK
Cooke G (1998) When are sandwich panels safe in fire? Part 1—an overview. Fire Eng J 58(195):37–41
Zalok E, Hadjisophocleous GV, Mehaffey JR (2009) Fire loads in commercial premises. Fire Mater 33:63–78. https://doi.org/10.1002/fam.984
Private communication from risk engineers at If P&C Insurance (2013)
Griffin GJ, Bicknell AD, Bradbury GP, White N (2006) Effect of construction method on the fire behavior of sandwich panels with expanded polystyrene cores in room fire tests. J Fire Sci 24(4):275–294. https://doi.org/10.1177/0734904106059052
Axelsson J, Van Hees P (2005) New data for sandwich panels on the correlation between the SBI test method and the room corner reference scenario. Fire Mater 29(1):53–59. https://doi.org/10.1002/fam.879
Collier PCR, Baker GB (2013) The influence of construction detailing on the fire performance of polystyrene insulated panels. Fire Technol 49(2):195–211. https://doi.org/10.1007/s10694-011-0238-5
BS EN 13501-1:2009. Fire classification of construction products and building elements. Part 1: classification using data from reaction to fire tests, BSI
ISO 13784-1:2002. Reaction to fire tests for sandwich panel building systems—part 1: small room test, ISO, Geneva
ISO 9705:1993. Fire tests—full-scale room test for surface products, ISO Geneva
BS 8414-2:2005. Fire performance of external cladding systems—test method for non-loadbearing external cladding systems fixed to and supported by a structural steel frame, BSI, London
McCaffrey B, Heskestad G (1976) A robust bidirectional low-velocity probe for flame and fire applications. Combust Flame 26:125–127. https://doi.org/10.1016/0010-2180(76)90062-6
ASTM E459. Standard test method for measuring heat transfer rate using a thin-skin calorimeter, 2011
ISO 19701:2013. Methods for sampling and analysis of fire effluents, ISO Geneva
Thornton WM (1917) The relation of oxygen to the heat of combustion of organic compounds. Philos Mag J Sci 33(194):196–203. https://doi.org/10.1080/14786440208635627
Huggett C (1980) Estimation of rate of heat release by means of oxygen consumption measurements. Fire Mater 4:61–65. http://dx.doi.org/10.1002/fam.810040202
Biteau H, Steinhaus T, Schemel C, Simeoni A, Marlair G, Bal N, Torero JL (2008) Calculation methods for the heat release rate of materials of unknown composition. Fire Saf Sci 9:1165–1176. https://doi.org/10.3801/iafss.fss.9-1165
Welch S, Jowsey A, Deeny S, Morgan R, Torero JL (2007) BRE large compartment fire tests—characterising post-flashover fires for model validation. Fire Saf J 42:548–567. https://doi.org/10.1016/j.firesaf.2007.04.002
Pitts WM (1995) The global equivalence ratio concept and the formation mechanisms of carbon monoxide in enclosure fires. Prog Energy Combust Sci 21(3):197–237. https://doi.org/10.1016/0360-1285(95)00004-2
Gersen S, Mokhov AV, Levinskya HB (2008) Diode laser absorption measurement and analysis of HCN in atmospheric-pressure, fuel-rich premixed methane/air flames. Combust Flame 155:267–276. https://doi.org/10.1016/j.combustflame.2008.04.006
Houshfar E, Løvås T, Skreiberg Ø (2012) Experimental investigation on NOx reduction by primary measures in biomass combustion: straw, peat, sewage sludge, forest residues and wood pellets. Energies 5:270–290. https://doi.org/10.3390/en5020270
Johansson P, Van Hees P (2000) Development of a test procedure for sandwich panels using ISO 9705 philosophy—Nordtest Project Number 1432-99. SP report 2000:26, Borås, Sweden
ISO 19706:2011. Guidelines for assessing the fire threat to people, ISO, Geneva
McAllister S, Finney M (2013) Effect of crib dimensions on burning rate. In: Bradley D, Makhviladze G, Molkov V, Sunderland P, Tamanini F (eds) Proceedings of the seventh international seminar on fire & explosion hazards (ISFEH7). https://doi.org/10.3850/978-981-07-5936-0_08-02
O’Dogherty MJ, Young RA (1964) Miscellaneous experiments on the burning of wooden cribs. Fire research notes 548. http://www.iafss.org/publications/frn/548/-1/view
Thomas PH, Nilsson L (1973) Fully developed compartment fires: new correlations of burning rates. Fire research note 979. http://www.iafss.org/publications/frn/979/-1/view
Hull TR, Stec AA, Lebek K, Price D (2007) Factors affecting the combustion toxicity of polymeric materials. Polym Degrad Stab 92(12):2239–2246. https://doi.org/10.1016/j.polymdegradstab.2007.03.032
Stec AA, Hull TR, Lebek K, Purser JA, Purser DA (2008) The effect of temperature and ventilation condition on the toxic product yields from burning polymers. Fire Mater 32(1):49–60. https://doi.org/10.1002/fam.955
ISO 13344:2004. Estimation of the lethal toxic potency of fire effluents, ISO, Geneva
Stec AA, Hull TR (2011) Assessment of the fire toxicity of building insulation materials. Energy Build 43(2–3):498–506. https://doi.org/10.1016/j.enbuild.2010.10.015
Bryant RA, Mulholland GW (2008) Guide to characterizing heat release rate measurement uncertainty for full-scale fire tests. Fire Mater 32:121–139. https://doi.org/10.1002/fam.959
Acknowledgements
We would all like to thank If P & C insurance, who initiated and commissioned this work, supplied the panels and paid for their construction. In addition they provided invaluable advice and support throughout the project, from inception to completion. The authors would also like to thank Axis Communications (Sweden) for generous provision of Axis Network cameras Q1604-E, Q1922-E and P1214 used to record images inside each room, and Lancashire Fire and Rescue Service (UK) for provision of facilities, support and safety cover. SM would like to thank the University of Central Lancashire for provision of a PhD studentship. JPH would like to thank Rockwool International A/S for provision of his PhD studentship. MML contributed his own time to the work. RJC and AAS would like to thank the UK Engineering and Physical Sciences Research Council for financial support (EP/I033181/1 “Measurement and Prediction of Fire Smoke Toxicity of Materials in Enclosures.”). The work results from collaboration between three universities and If P & C Insurance. The experimental design and procedures, together with data analysis and the writing of this manuscript were agreed by the authors, and are the collective output of the whole team. The first three named authors are joint first authors of this article.
Author information
Authors and Affiliations
Corresponding author
Electronic supplementary material
Below is the link to the electronic supplementary material.
Appendices
Appendix 1: Schematics of the Enclosure Including Damage

Appendix 2: Schematics of the Enclosure Including Instruments

Appendix 3: Heat Release Rate Calculation Method
The heat release rate for each experiment is calculated by a species evolution approach of oxygen consumption calorimetry (OC). This approach is based on Thornton’s principle [18], which assumes that the energy released by the burning of a large amount of different organic material is proportional to the amount of oxygen consumed by the combustion reaction [19].
The formula used for calculation of heat release rate (\( \dot{Q}_{OC}^{{}} \)) by OC is given in Eq. (3), as reported elsewhere [20, 34]. A correction for incomplete combustion is included, by taking into account the generation of carbon monoxide.
\( E_{{{\text{O}}_{2} }} \) is the energy released per mass unit of oxygen consumed assumed as \( E_{{{\text{O}}_{2} }} = 13.1{\text{ kJ}}\;{\text{g}}_{{{\text{O}}_{ 2} }}^{ - 1} \), \( E_{{{\text{CO}} \to {\text{CO}}_{2} }} \) is the energy released per mass unit of oxygen consumed for the combustion of carbon monoxide, \( \dot{m}_{e}^{{}} \) (kg/s) is the average mass flow entering or leaving the compartment by the door opening, \( \alpha \) is the volumetric expansion factor (–), \( M_{{{\text{O}}_{2} }} \) is the molecular weight of oxygen (g/mol), \( M_{air} \) is the molecular weight of air (g/mol), and \( \phi \) is the oxygen depletion factor (–), which is defined in Eq. (4) below:
\( X_{{{\text{O}}_{2} }}^{0} \) is the measured volumetric concentration of oxygen before the ignition (mol/mol), \( X_{{{\text{CO}}_{2} }}^{0} \) is the measured concentration of carbon dioxide before the ignition, \( X_{{{\text{O}}_{2} }}^{{}} \) is the measured concentration of oxygen, \( X_{{{\text{CO}}_{2} }}^{{}} \) is the measured concentration of carbon dioxide and \( X_{\text{CO}}^{{}} \) is the measured concentration of carbon monoxide.
However, the use of a calorimeter was not available for these experiments as they were performed outdoors. Thus, the approach used for the heat release calculation was based on gas species measurements at the top of the door opening, and calculations of mass flow through the opening. The latter was calculated by translating velocity measurements from the McCaffrey probes and temperature of the gas at the door opening into mass flow values. This approach allows approximate calculation of the heat release inside the compartment, but ignores the significant amount of external flaming from gaps between the panels, etc.
A series of uncertainties are encountered with this method that relates to the accuracy of the mass flow calculation of the different species leaving the compartment, shown in Eq. (5) below:
\( \dot{m}_{i} \) is the mass flow of the species i leaving the compartment, \( X_{i} \) is the concentration of species i in the smoke leaving the compartment, \( \dot{m}_{e} \) is the mass flow of smoke leaving the compartment, \( M_{i} \) is the molecular weight of the species i and \( M_{air} \) is the molecular weight of air.
The variables measured in the experiments are gas concentration, and velocity and temperature of the flow through the door opening. The limitations identified in the method are listed below:
-
The point at which the gases were analysed was 0.15 ± 0.05 m below the top of the door opening, in the centre. This procedure assumes uniformity of the different species in the smoke spilled by the door opening. While this assumption may be valid for post-flashover regimes, air entrainment in the bottom of the smoke layer is expected for well-ventilated fires, thus more dilution and less uniformity may be expected. This is illustrated in Fig. 18.
Figure 18 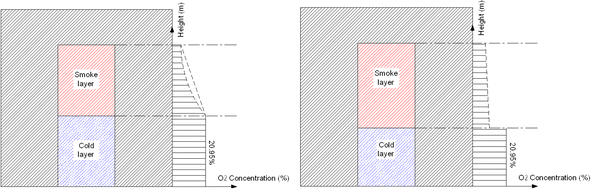
Expected profile of oxygen concentration along the opening of a pre-flashover compartment fire regime (left) and a post-flashover compartment fire regime (right)
-
The mass flow is assumed to be uniform along the width of the opening. This carries the uncertainty of the non-quantifiable discharge coefficient at the door opening, making it impossible to establish the mass flow through the door exactly.

These limitations prevent an exact calculation of the heat release rate in the compartment. Nevertheless, assuming a certain discharge coefficient and a correction factor that takes into account the non-uniformity of the gas species in the smoke leaving the compartment, a reasonable estimate can be obtained. Then the actual heat release rate in the compartment can be characterised by a range of values.
-
The upper limit corresponds to the calculated heat release rate based on the assumption of a uniform species profile along the smoke leaving the compartment, characteristic of a post-flashover regime. A discharge coefficient value of \( C_{D} = 0.65 \) is used for determining the mass flow.
-
The lower limit corresponds to the heat release rate based on the assumption of a non-uniform species profile along the smoke leaving the compartment, characteristic of a pre-flashover fire regime. This is obtained by applying a correction factor to the higher limit. The correction factor is assumed as the ratio between the calculated HRR from the gas burner and the higher limit for the gas burner experiment in the stone wool compartment without the wooden crib. This experiment was used as a baseline for the ratio calculation because it was a well-ventilated two layer compartment fire, where no significant contribution to the heat release rate was expected from the panels, resulting in a correction factor of value 0.56 for the oxygen consumption method. The correction factor was obtained as an average value from the three steps of HRR in the gas burner experiment in the stone wool compartment.
Rights and permissions
Open Access This article is distributed under the terms of the Creative Commons Attribution 4.0 International License (http://creativecommons.org/licenses/by/4.0/), which permits unrestricted use, distribution, and reproduction in any medium, provided you give appropriate credit to the original author(s) and the source, provide a link to the Creative Commons license, and indicate if changes were made.
About this article

Cite this article
Crewe, R.J., Hidalgo, J.P., Sørensen, M.X. et al. Fire Performance of Sandwich Panels in a Modified ISO 13784-1 Small Room Test: The Influence of Increased Fire Load for Different Insulation Materials. Fire Technol 54, 819–852 (2018). https://doi.org/10.1007/s10694-018-0703-5
Received:
Accepted:
Published:
Issue Date:
DOI: https://doi.org/10.1007/s10694-018-0703-5