
Abstract
The paper reports on the design of an augmented reality (AR) application for structural analysis education. Structural analysis is a significant course in every civil engineering program. The course focuses on load and stress distributions in buildings, bridges, and other structures. Students learn about graphical and mathematical models that embody structures as well as to utilize those models to determine the safety of a structure. An often reported obstacle is the missing link between these graphical models and a real building. Students often do not see the connection, which hinders them to utilize the models correctly. We designed an AR application that superimposes real buildings with graphical widgets of structural elements to help students establishing this link. The focus of this study is on application design, especially on the question whether students prefer an application that guides them when solving an engineering problem or whether the students prefer to explore. Students were asked to solve a problem with the application, which either instructed them step-by-step or allowed the students to use all feature on their own (exploring). The results are inconclusive, however, tend to favor the explore mode.
You have full access to this open access chapter, Download conference paper PDF
Keywords
1 Introduction
The goal of our research is to help students to better understand structural analysis using Augmented reality (AR). Structural analysis is a significant course in any engineering program. Students learn about load and stress distributions in buildings, bridges, and other structural elements. The course program incorporates the structural models such as beams, trusses, and others, as well as their utilization to determine the safety of a structure. All structural models, also called members, usually have a graphical component and a mathematical description. The first one allows students and engineers to sketch the load elements of a structure, the second one allows for analyzing the structure’s load. Figure 1 shows an example of a frame structure. Students learn in a course how they can use it theoretically. However, to connect it to a building such as the one Fig. 1 illustrates remains challenging.

(a) A typical frame structure engineers use to analyze the load and deformation of buildings. (b) The frame can represent parts of the building. Students often struggle to see the relation.
The struggle for novice learners is twofold: First, it is difficult for students to identify the correct member for a particular building (i.e., beam, truss, frame). Second, even if they found the element, it is often not clear how one has to represent a real building using the graphical and mathematical components. More massive structures incorporate multiple connected elements, connected by supports and other means. As a consequence, most novices in this course do not appear to gain the required understanding of fundamental concepts, such as load effects and load paths. They also cannot visualize the deformed shape of simple structures, a necessary skill to conceptualize structural behavior beyond formulas and methods [1, 2]. The prevailing theory attributes those learning deficiencies to the ineffectiveness of the traditional lecture-mode of teaching. Instructors spend much effort on the analysis of discrete members, and less on understanding the behavior of the entire structure in a three-dimensional context.
We developed an AR application denoted as iStructAR to supplement traditional structural analysis lectures. The application superimposes a building or any other structure with graphical widgets indicating members, supports, loads, and other elements. The application is interactive. Students can change, for instance, the magnitude of a load, its distribution, and other required elements to solve an engineering problem. We initially introduced the application in [3, 4]. This research focuses on the mode of instruction: Guiding or Exploring. Students of an introductory structural analysis course are novices to this topic. Consequently, an instructor guides the students through the problem-solving process before he or she encourages them to solve a problem on their own accord. Following this notion, the application may also guide the students. On the flipside, it may just act as a facilitator that encourage the students, nevertheless, requires them to know the problem-solving process. iStructAR implements the second option. However, it encountered opposition when students of an initial study [1] reported they “I did not know what to do.” To further assess these options, we realized a second, guided application mode, which takes the students through a step-by-step procedure. Students that participated in a study had to either use the guided mode or the exploring mode.
The next section introduces the application. Section 3 explains the study and reports the results. The last section closes with a conclusion and future aspects of this research.
2 iStructAR - Application Design and Scenarios
iStructAR is an application designed for an Apple iPad. Its interface and entire design utilize the standard Apple UI widgets (Sect. 2.1). To support typical lectures, it implements a set of structural analysis scenarios that supplement the problems instructors assign to students (Sect. 2.2). Each scenario addresses a different aspect of structural analysis.
2.1 Application Design
Figure 2 shows a screenshot of one of the application scenarios. The application operates in landscape model and shows a video of a selected building. Here, it shows a skywalk, the structure of interest. The graphical interface follows a typical border layout with the center area in the center surrounded by interaction widgets along the border. Since the application utilizes AR, the central area displays a video captured by the iPad’s back camera, which the renderer superimposes with 3D models representing different structural members. Several graphical widgets along the border allow a user to control the application. All widgets are organized by functions groups. The bar at the bottom contains widgets that allow the user to control the app. These widgets include, for instance, button icons to change the load situation. Since the load situation changes for different scenarios, the definition of these buttons can change. The right side of the bottom bar hosts control button icons. A user can control the usage mode (stand along, indoor, outdoors). At the upper left corner, the user can find several switches to turn on or off visualization widgets. These switches allow a user to enable or disable particular load visualizations, independently from the load itself. Depending on the task, the display can become cluttered with graphical widgets. Thus, a student might lose track of all the different items on the screen. Being able to switch specific features on and off helps to maintain the overview. Besides using button icons and switches to interact, all loads widgets on the primary display are also gesture controlled. The user can change the location and the magnitude of a load with his/her fingers.

The interface structure of iStructAR.
From an application point-of-view, students should work with the application in front of a physical buildingFootnote 1. The application works with object recognition. Thus, it recognizes when a student points the iPad towards, e.g., the skywalk, it calculates the pose, and instantly populates the image with 3D models indicating the load, reaction forces, and other scenario-dependent items. It is possible for a student to freeze the video feed and work with the last image instead. Pointing the iPad towards a building is tiring, so this option allows a student to work in a more comfortable posture.
The application also supports an indoor mode. During winter times or severe weather conditions, students can work with printouts of the structure. Although this solution is not ideal since they see the building from one perspective only, it is an acceptable tradeoff between good-weather and not using the application at all. The last mode is a so-called demo mode. This mode only shows a prepared image of the building. It acts as a demonstrations scenario to quickly show the application features. Students should not use it.
2.2 Application Scenarios
Currently, the application content is still under development. However, students can already practice their skills on three engineering application scenarios. Each application scenario is either related to a particular structural member (i.e., beam, frame, truss) or a load situation (i.e., static load distributions, wind load, seismic load).
Figure 3 depicts the beam application scenario. The objective of this scenario is to explain beam deflection under load. Every solid surface deflects when one exerts load to it. In this scenario, the load comes in the form of a so-called dead load, which is due to the weight of the structure, and a live load, due to the people crossing the skywalk.

The Skywalk scenario features a beam (blue line) Students can change the load, the application calculates and visualizes the response (deflection and reaction forces). (Color figure online)
Students need to understand how different load situations affect the deflection, especially the form of the deflected beam. For that reason, an instructor would usually assign a task to students that asks them to draw the deflected beam for different load situations and to compare the form of the beam. Instead of drawing, the application allows the students changing the load, its distribution and magnitude in particular, and to observe the differences. The essential point here is that students can instantly relate the form of the deflection to the concrete skywalk and notice the critical locations. When comparing multiple load situations, students should be able to develop an understanding which sections of a skywalk are the most critical once and how a beam member allows them to identify these critical points.
Figure 4 demonstrates a seismic load scenario. Earthquakes exert a seismic load on buildings. It appears as an oscillating load, which shakes the building. The challenge here comes in the form of the technical definition of the seismic load. Civil engineers employ a seismic map which states characteristic factors for every region of a country. Although these characteristic factors encode the load, engineers need to translate them it into an oscillating load first. Thus, those factors have no natural meaning. The AR application visualizes the load and the deflection. Load distribution and deflection change quadratic and can exceed a critical tolerance at a certain point. In this example, using a bell tower, the particular point is a certain height. Using the AR applications, students can observe the tower from multiple directions and notice the critical heights. Furthermore, they can change the characteristic factors. Changing factors technically means they virtually place the bell tower in a different location. Again, they can compare the different critical loads and deflections and analyze whether a bell tower build for Iowa would also last in California, for instance.

Seismic load on a tower. This scenario shows how a tower is modeled with beam members. The scenario shows the reaction forces and deflection due to seismic stimulation.
The hypothesis is that the AR application facilitates learning because the students can better associate a structural member or a response to a load to a building. Furthermore, the application should engage students to work on the topic. Therefore, the application design follows three principles, which were often favored in the related studies [5,6,7]: The content is semantically context-related, interactive, and provides instant feedback. Registered 3D models of members and load realize semantically context-related content. We hypothesize that this will allow students to better understand how they can utilize structural members. Instant feedback to interactive changes should also allow them to better learn the effects of load changed. Students can experiment with load situations and compare the results on structures.
3 Study
We encountered a challenge pertaining application usage during our initial study [1]. Students reported they were unsure how they can use the application to solve a problem the instructor assigned to them. With this result faced, we decided to test whether students would prefer a more guided approach. One that tells or asks them step-by-step what to do. Although this might betray the purpose of the entire class, students of this course are still novices and might be overwhelmed when already left alone with a problem after one first example. In an ideal case, students should experiment and explore until they can solve problems on their own accord. To better understand the struggle, we prepared two applications modes denoted as guided-mode and explore-mode (Sect. 3.2). Students were asked to solve a problem (Sect. 3.1) using one of these modes.
3.1 Problem
The problem incorporates three questions that the students had to solve using the application.
- Question 1::
-
“If a uniformly distributed load was placed over the structure shown below, how would each span deflect? Draw the deflection shape on the diagram below” (Fig. 5a).
Fig. 5. 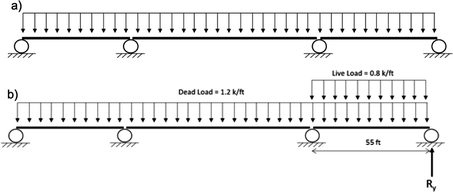
a–b: Supplementing figures that visualize the load situation of the problems.
- Question 2::
-
“If students were to walk across the entire Skywalk, or stand on the entire Skywalk, what type of load could be used to model their effect on the structure? And, how would this load affect the deflection? Draw the deflection from the additional load on your original deflection image.”
- Question 3::
-
“The diagram below has the same span lengths as the modeled Skywalk in the app. The third span length is 55 feet. If a uniformly distributed dead load of 1.2 k/ft was on the entire structure, and a uniformly distributed live load of 0.8 k/ft was on the third span, what would the reaction at the fourth support (shown as Ry) be? Remember that each individual span is simply supported.” (Figure 5b) shows the supplementing sketch

A student can solve all three questions with the application by adjusting application parameters until they match the stated situation. The first question requires the student to adjust the load on a beam. Hence, the student needs to identify a beam (Skywalk scenario) and adjust the load. As a result, the graphical beam would deflect and demonstrate the deflection. The procedure to solve the second question does not deviate much from the first one. Here, a student is required to know how he or she can model group of scattered people on a Skywalk. A solution for that is also part of the application scenario. Likewise, the last question asks the student to set the load parameters correctly.
Each question imposes two problem-solving aspects to a student. He or she first needs a minimum understanding of structural analysis. This aspect pertains structural analysis. Secondly, he or she also has to identify the graphical widgets allow one to change load parameters and visualization settings, which is a usability aspect.
3.2 Guided-Mode Vs. Explore-Mode
We prepared two versions of the application denoted as guided-mode and explore-mode.
The guided-mode provides step-by-step instructions as text to a student (Fig. 6). All instructions appear on the lower bottom of the screen. A “next” button icon allows the student to move through all instructions for this task. With “previous” they can step back. Currently, the application does not verify whether a student completed a step correctly. A student can also browse through all instructions first before attempting to solve the problem.

a–b: A window at the bottom of the screen conveys instructions.
The explore-mode allows the students to use the application as it is; as described before. We did not add any additional hints. This mode requires the student to possess some problem-solving skills or at least, need the student to be explorative so that he or she can understand how s/he can use the application to solve the problems.
On a difficulty scale, we consider the three questions as simple, on the right level for novices who just start to learn about structural analysis.
3.3 Experiments and Results
We recruited students from the civil engineering department to conduct experiments following a between-subject design. Upon arrival, each volunteer read and sign an informed consent document. Next, an experimenter introduced the tasks, the equipment and the procedure to the student. Next, every volunteer completed a brief prequestionnaire which record age, sex, level of education, and field of study or profession. The student could ask questions. The experiment started when the student had no further questions. There was no time limit imposed, although the experimenter asked the student to be as fast as possible. Each student completed a questionnaire afterward. The questionnaire asked 16 questions (Table 1). We used a 5-point Likert scale. Students were also asked to take screenshots.
Table 1 shows the results of the questionnaire. We calculated the mean and standard deviation for each question, split into the guided mode and explore model. The overall mean for the guided mode is μg = 4.08 (std. dev = 0.62) and for the explore mode μe = 4.40 (std. dev = 0.67).
The results are inconclusive. However, students tend to favor the unguided mode. Although the mean values for all questions do not yield any significant results, the variance indicates a particular trend towards the unguided mode. For unknown reasons, the students that used the guided mode tends towards problems finding the right buttons and graphical widgets that they need to solve the problem. The questions 1, 4, 6 and 7 indicate this trend given the variance within all answers. In general, all results indicate that the students only had little problems to use the application to solve the given problems. We initially assumed that students might have problems identifying beams or may struggle to distinguish the different types of load. The results to question 9 and 10 indicate the opposite, regardless of which mode a student worked with. Despite the fact that this result is also not significant, the overall trend also shows that the interface design complies with the students’ expectations for graphical representations of structural analysis members. A surprise to us was the students’ problem to take screenshots using an iPad; they were asked to take a screenshot to document their results. The application interface had no button to save screenshots at this time and we assumed that students know how they have to operate an iPad to record screenshots. Apparently, this assumption was wrong.
A limitation of this study is currently the number of scenarios that were tested. Students had to solve a beam problem only. Thus, other members such as frames and trusses remain untested. Although we currently see no essential differences from a problem-solving perspective, no data is available to underpin this assumption.
4 Conclusion and Outlook
Due to the insignificant results, we cannot state any certain conclusion. However, the initial plan for this project intends to use an explore mode, which allows students to gain a better understanding by exploring a solution on their own accord. The results at hand do not indicate any difference. Thus, the authors will maintain the explore mode solution for future studies. Additionally, and despite our initial doubts after testing, the authors also do believe that allowing students to explore a solution to a problem is a better teaching strategy. Guiding students is almost comparable to giving them a solution. Almost, since the students still have to connect the dots, e.g., identify a truss or beam and the effects of load on those structures on their own. Nonetheless, it denies them the experience to determine the procedure on their own accord.
A next step is a study in a classroom with two sections of a structural engineering class at Iowa State University. One section, the students, in particular, will pose the experimental group working with the iPad, the other the control group. We scheduled the study to be conducted during the Fall 2018 term.
Please visit web.me.iastate.edu/istructar for future update.
Notes
- 1.
A video demonstrating the usage can be found on YouTube: https://www.youtube.com/watch?v=kANM-r5Fh0k.
References
Davalos, J.F., Moran, C.J., Kodkani, S.S.: Neoclassical active learning approach for structural analysis. In: Proceedings of the 2003 American Society for Engineering Education Annual Conference & Exposition (2003)
Teng, J.G., Song, C.Y., Yuan, X.F.: Fostering creativity in students in the teaching of structural analysis. Int. J. Eng. Educ. 20(1), 96–102 (2004)
Turkan, Y., Radkowski, R., Karabulut-Ilgu, A., Behzadan, A.H., Chen, A.: Mobile augmented reality for teaching structural analysis. Adv. Eng. Inform. J. 34, 90–100 (2017)
Turkan, Y., Chen, A., Karabulut-Ilgu, A., Radkowski, R., Jahren, C., Behzadan, A.H.: Mobile augmented reality implementation for structural analysis. In: 23rd International Workshop of the European Group for Intelligent Computing in Engineering (EG-ICE), Krakow, Poland, June 2016
Singhal, S., Bagga, S., Goyal, P., Saxena, V.: Augmented chemistry: interactive education system. Int. J. Comput. Appl. 49(15), 1–5 (2012)
Qassem, L.M., Hawai, H.A., Shehhi, S.A., Zemerly, M.J., Ng, J.W.: AIR-EDUTECH: augmented immersive reality (AIR) technology for high school chemistry education. In: 2016 IEEE Global Engineering Education Conference (EDUCON), pp. 842–847 (2016)
Li, N., Gu, Y.X., Chang, L., Duh, H.B.L.: Influences of AR-supported simulation on learning effectiveness in face-to-face collaborative learning for physics. In: 2011 11th IEEE International Conference on Advanced Learning Technologies (ICALT), pp. 320–322 (2011)
Acknowledgment
This project is funded by the National Science Foundation under grant number #1712049.
Author information
Authors and Affiliations
Corresponding author
Editor information
Editors and Affiliations
Rights and permissions
Copyright information
© 2018 Springer International Publishing AG, part of Springer Nature
About this paper

Cite this paper
Radkowski, R., Karabulut-Ilgu, A., Turkan, Y., Behzadan, A., Chen, A. (2018). Guiding or Exploring? Finding the Right Way to Teach Students Structural Analysis with Augmented Reality. In: Chen, J., Fragomeni, G. (eds) Virtual, Augmented and Mixed Reality: Interaction, Navigation, Visualization, Embodiment, and Simulation. VAMR 2018. Lecture Notes in Computer Science(), vol 10909. Springer, Cham. https://doi.org/10.1007/978-3-319-91581-4_34
Download citation
DOI: https://doi.org/10.1007/978-3-319-91581-4_34
Published:
Publisher Name: Springer, Cham
Print ISBN: 978-3-319-91580-7
Online ISBN: 978-3-319-91581-4
eBook Packages: Computer ScienceComputer Science (R0)