
Abstract
Any given research claim can be made with a degree of confidence that a phenomenon is present, with an estimate of the precision of the observed effects and a prediction of the extent to which the findings might hold true under different experimental or real-world conditions. In some situations, the certainty and precision obtained from a single study are sufficient reliably to inform future research decisions. However, in other situations greater certainty is required. This might be the case where a substantial research investment is planned, a pivotal claim is to be made or the launch of a clinical trial programme is being considered. Under these circumstances, some form of summary of findings across studies may be helpful.
Summary estimates can describe findings from exploratory (observational) or hypothesis testing experiments, but importantly, the creation of such summaries is, in itself, observational rather than experimental research. The process is therefore particularly at risk from selective identification of literature to be included, and this can be addressed using systematic search strategies and pre-specified criteria for inclusion and exclusion against which possible contributing data will be assessed. This characterises a systematic review (in contrast to nonsystematic or narrative reviews). In meta-analysis, there is an attempt to provide a quantitative summary of such research findings.
You have full access to this open access chapter, Download chapter PDF
Keywords
1 Principles of Systematic Review
-
1.
Search strategy: the objective is to identify all possible sources of relevant information, so that they can contribute to the research summary. Informal searches have a number of weaknesses:
-
(a)
There is a risk of the preferential identification of work in high-impact journals. We know that the quality of work published in such journals is no higher than that in the rest of the literature and that a premium on novelty means that the findings in such journals tend to be more extreme than in other journals. This has been shown, for instance, in gene association studies in psychiatry (Munafo et al. 2009).
-
(b)
While English is still, largely, the language of science, searches which are limited to the English language literature will miss those studies published in other languages. For research conducted in countries where English is not the first language, there is likely to be a difference in the “newsworthiness” of work published in the English literature compared with the domestic literature, with work published in English being unrepresentative of the whole.
-
(c)
Where there is not a clear articulation of inclusion and exclusion criteria, de facto judgements may be made about eligibility based on convenience or information source, and eligibility criteria may drift with emerging understanding of the literature. This is essentially a data-led approach, and while it is sometimes appropriate, it needs to be apparent.
-
(d)
There should be articulation in advance of the research types to be included. Should conference abstracts be considered? In spite of their brevity, they do sometimes include sufficient information to contribute outcome data to meta-analysis. There is an increasing pre-peer-reviewed literature, most notably bioRxiv, often described in as much detail as a formal journal paper. Reviewers should decide this in advance, and in general in fast-moving fields, it is preferable to consider both of these sources if possible.
-
(e)
This decision also has implications for the number of databases to be searched. PubMed is easy to use, is widely accessible and provides good coverage of much of the published literature. However, conference abstracts and preprints are not reliably retrieved, and if these are important, then the use of, for instance, EMBASE and Google Scholar, or perhaps direct searching within bioRxiv, is preferred. Importantly, the Google Scholar algorithm is based in part on that user’s search history and will differ between individuals. Therefore, while potentially useful, it does not provide a reproducible search strategy and should not be used as the main or only search engine. As registries of animal experiments become more widely used, searching of these may provide useful information about the proportion of studies which have been initiated but not (at least not yet) published. The SRA-polyglot tool (http://crebp-sra.com/#/polyglot) developed by the Bond University Centre for Research in Evidence-Based Practice allows the syntax of search strings to be converted between the requirements of several different databases.
-
(a)
-
2.
Deduplication
-
(a)
Where more than one database is searched, it is inevitable that some articles will appear in more than one search result, and it is important to identify such duplication. The earliest this can be done, the more work is saved; and in some large multi-author reviews, duplicate publications may persist to very late stages of the review. Bibliographic software such as EndNote has deduplication facilities which require manual curation, as does the SRA-dedupe tool developed by the Bond University Centre for Research in Evidence-Based Practice. However, emerging experience in our group suggests that completely automated deduplication may be achieved with a high degree of precision using the RecordLinkage (https://cran.r-project.org/web/packages/RecordLinkage/index.html) R package with additional filters built into the code to maximise the number of duplicates detected without removing false duplicate records.
-
(a)
-
3.
Protocol registration (PROSPERO) and publication
-
(a)
Systematic review is observational research. There is opportunity therefore for hypothesising after results are known (“HARKing”) – that is, for the intention of the study to be changed in the light of observed data, with a claim made, the data supported what the investigators had been looking for all along, and for flexibility in data analysis (choosing the analysis technique that delivers p < 0.05), and for shifts in the entire purpose of the study. Say, for example, we were interested in the effect of maternal deprivation in the first trimester on blood pressure in adult offspring, but found many more studies using maternal deprivation in the third trimester and switched to studying that. These flexibilities increase the risk of identifying spurious associations and devalue the findings of systematic review. Researchers should articulate, in advance, the population to be studied, the hypothesis, the intervention of interest, the statistical analysis plan and the primary outcome measure. These should be recorded in a registry such as PROSPERO, which has a dedicated platform for reviews of animal studies (https://www.crd.york.ac.uk/prospero/#guidancenotes_animals).
-
(b)
For more complex reviews, it may be worth considering publication of a protocol manuscript, giving the opportunity to articulate in greater detail the background to the study and the approach to be used; and some journals have adopted the Registered Reports format, where the protocol is reviewed for methodological quality, with an undertaking to accept the final manuscript regardless of results, as long as the methodology described in the protocol has been followed (see https://cos.io/rr for further discussion).
-
(a)
-
4.
Ensuring reviews are up to date
-
(a)
Depending on the resources available, systematic reviews may take as much as 2 years to complete. Given the pace of scientific publication, this means that the findings may be out of date before the review is even published. One approach is to update the search once data extraction from the originally identified studies is complete, but this should be performed before any data analysis, and the intention to update the search, perhaps conditional on the original search being above a certain age, should be articulated in a study protocol.
-
(b)
An alternative approach is to conduct a living systematic review (Elliott et al. 2017). In this the intention is that the review is continually updated as new information becomes available. Automation of many of the key steps means that much of this can be done in the background, with little human intervention required (Thomas et al. 2017). At present the critical stage which resists automation is the extraction of outcome data, but even here the use of machine assistance may have much to offer; a pilot study suggests time saving of over 50% in data extraction, with gains in accuracy (Cramond et al. 2018). It is now possible to imagine completely automated living reviews, right through to a continually updated web-based dissemination of review findings.
-
(c)
Such reviews raise important issues about statistical analysis and versions of record. For the former, the concern is that sequential statistical analysis of an enlarging dataset raises the false discovery rate. The problem is similar to those encountered in interim analyses in clinical trials, but because data might continue to accumulate indefinitely, approaches such as alpha spending used in clinical trials would not be appropriate. Possible approaches include either adopting a Bayesian approach, with priors informed by the first formal meta-analysis, or a rationing of formal statistical testing at milestones of data accumulation, for instance, with each doubling of the amount of data available (Simmonds et al. 2017).
-
(d)
For a version of record, there needs to be a persisting digital identifier, with the possibility to recreate the data which contributed to that analysis. One approach would be to allow research users to create a snapshot of the analysis, with its own DOI and linked public domain data repository, with the snapshot labelled to indicate findings from the last formal statistical analysis and with the informal updated analysis. This would provide transparency to the provenance of the claims made.
-
(a)
-
5.
Machine learning for citation screening
-
(a)
Any bibliographic search represents a compromise between sensitivity and specificity – a highly sensitive search will identify all relevant studies and many more which are irrelevant; and attempts to increase specificity reduce sensitivity. For most systematic reviews, the proportion of relevant search results is around 10–20%. For some reviews, particularly “broad and shallow” reviews or living reviews, the work required in screening citations can be substantial. For instance, our search for a review of the animal modelling of depression returned more than 70,000 “hits”, and one for the modelling of Alzheimer’s disease returned over 260,000 “hits”. In such cases the burden of human screening is prohibitive.
-
(b)
The task of identifying citations is well suited to machine learning. Essentially an automated tool extracts features from the text such as word frequency and topics described, determines the representation of these features in a learning set of included versus excluded citations and makes a prediction of the probability that any given citation should be included. This can then be tested in a validation set and the sensitivity and specificity of various cut-off scores determined. By varying the cut-off score, the user can choose the levels of sensitivity and specificity which best meets their needs. Our practice is to choose the cut-off which provides sensitivity of 95% (roughly equivalent to human screening) and to observe the sensitivity achieved. If this is not sufficient, we increase the size of the training set in an attempt to secure better performance.
-
(c)
There is a further elaboration to improve performance. Although the training sets have usually been defined through dual screening (i.e. two humans have independently adjudicated the citation, and disagreements have been reconciled by a third screener), errors still occur. Such errors pollute the training sets and reduce machine performance. Citations in the training set where there is greatest mismatch between human decision and machine prediction are those most likely to represent human errors, and so identifying these for further human screening to identify errors leads to improved performance – in the depression example (Bannach-Brown et al. 2019), increasing sensitivity from 86.7% to 88.3% while achieving sensitivity of 98.7%, resulting in a reduction in the burden of screening of over 1,000 citations.
-
(a)
-
6.
Text mining to partition and annotate the literature
-
(a)
Particularly in a broad and shallow review, there is often a need to categorise studies according to the disease model, the experimental intervention or the outcome measure reported. In all reviews, it may be helpful to annotate studies according to the reporting of measures – such as blinding or randomisation – which might reduce the risk of bias. This can be done either on title and abstract only or can consider the full text if this is available. The basic approach is to use a dictionary-based approach, determining the frequency with which a specific word or phrase appears. In our experience, this is usually sufficient for disease model, experimental intervention and the outcome measure reported – probably because there is a very limited number of ways in which such details are reported. Annotation for risks of bias is more challenging, because there are more ways in which such details can be described. More sophisticated textual analysis using regular expressions – where a word or phrase is detected in proximity to (or without proximity to) other words or phrases – can be used to detect the reporting of, for instance, blinding and randomisation, with a reasonable degree of precision (Bahor et al. 2017). However, performance at the level of the individual publication is not perfect, and access to full text is required. In the clinical trial literature, tools using more sophisticated machine learning approaches have been described (Marshall et al. 2016), and we and others are currently exploring the performance of similar approaches to the in vivo literature.
-
(a)
-
7.
Wide and shallow reviews and narrow and deep reviews
-
(a)
Reviews can serve diverse purposes, from the very focussed investigation of the effect of a specific drug on a specific outcome in a specific disease model to more broad ranging reviews of a field of research. It is usually too burdensome for a review to be both wide and deep, but wide and shallow reviews can serve important purposes in describing a field of research; reporting the range of outcomes reported, drugs tested and models employed; and reporting of risks of bias, without a detailed meta-analysis. These can be critically important in designing future research questions, for instance, in determining priorities for future narrow and deep reviews. Indeed, by making available datasets from wide and shallow reviews with living searches, machine learning for citation screening and text mining to identify drugs and models of interest in “Curated current contents” (see below), these reviews can be a launch pad for those wishing to conduct narrow and deep reviews in particular areas, with much of the burden of searching and citation screening already performed.
-
(a)
2 Principles of Meta-Analysis
-
1.
Measures of effect size
-
(a)
Usually we are interested in measuring differences in outcomes between two or more experimental cohorts. This might be a difference in, for instance, infarct volume in an animal model of stroke, or of cognitive performance in animal models of dementia, or of ejection fraction in animal models of myocardial ischaemia. It is very unusual for the outcome measure used to function as a ratio scale across the different experimental designs presented (a 5 mm3 reduction in infarct volume has very different meaning in a mouse compared with a rat or a cat), and so simply taking the raw outcome measure is seldom appropriate.
-
(b)
Another approach is to calculate a “standardised mean difference” (SMD), where the difference is expressed as a proportion of the pooled standard deviation (Cohen’s D), sometimes with a correction factor to account for small group sizes (Hedges G). If groups are large enough, the measured pooled standard deviation reflects the underlying biological variability in the phenomenon under study and is independent of the scale used; it can therefore be used to convert between scales. For example, if the variation in daily temperature recordings is 3.6°F and is also 2.0°C, then we can establish that 1.8°F = 1.0°C.
-
(c)
However, when group size is smaller, the measured pooled standard deviation reflects both underlying variability and a measurement error. In a simple simulation of 100 control groups with 10 animals each, the observed standard deviation ranged from 51% to 172% of the modelled value, giving substantial imprecision if this was used as the yardstick to scale the effect size (unpublished simulation).
-
(d)
An alternative approach is to calculate a “normalised mean difference” (NMD) by mapping the observed outcomes onto a ratio scale where 0 is the outcome expected from an unlesioned, normal animal and 1 is the outcome observed in a lesioned, untreated animal (usually the control group). The effect size can then be expressed as the proportional or percentage improvement in the treatment group, with a pooled standard deviation on the same scale derived from that observed in the treatment and control groups. So a drug that reduced infarct volume in a rat from 300 to 240 mm3 would be considered to have the same magnitude of effect as one that reduced infarct volume in a mouse from 25 to 20 mm3.
-
(e)
This NMD approach also has shortcomings. Firstly, although some outcome measures such as infarct volume appear as a ratio scale, the range of possible infarct volumes in a rat has a minimum at zero and a maximum at the volume of the intracranial cavity, so we expect floor and ceiling effects. Secondly, many behavioural outcomes are measured on scales which are ordinal rather than interval or ratio scales, where parametric approaches are considered less appropriate. Finally, this approach can only be used where outcome in non-lesioned (“normal”) animals is either presented or can be inferred – for some outcomes (e.g. spontaneous motor activity), these data may not be available. Also, if the purpose is to summarise the impact of disease modelling rather than of the effect of an intervention in a disease model, the NMD approach is not possible.
-
(f)
Nonetheless, where an NMD approach is possible, it is preferred. It has fewer relevant weaknesses than the alternative approaches, and it is a more powerful approach when you are interested in identifying differences between groups of studies (see Sect. 3).
-
(a)
-
2.
Giving different studies different weights
-
(a)
The calculation of a summary estimate of effect could be as simple as presenting the median observed effect or a mean value from the observed effects. However, this approach would give the same weight to small and large studies, to precise and imprecise studies.
-
(b)
To address this, meta-analysis adjusts the weight which each study is given. In the simplest approach, studies are weighted according to the inverse of their observed variance. More precise studies – and this will generally also be the larger studies – are accorded greater importance than imprecise (usually smaller) studies. This is termed “fixed effects meta-analysis” and is appropriate where all studies are essentially asking the same question – we expect the differences between studies to be due simply to sampling error and that the true underlying results of these studies are the same.
-
(c)
In reviews of animal studies, it is unusual for this to be the case; drugs are tested in different species, at different doses, in models of different severities and at different times in relation to when disease modelling was initiated. We are therefore not so much interested in an “average” effect, but rather in how the observed effect varies under different circumstances. The true underlying results of included studies are likely to be different.
-
(d)
To account for this, we can use random effects meta-analysis. Here the principle is that we make a statistical observation of the differences between studies (the heterogeneity) and compare this to the differences expected if the studies were all drawn from the same population (i.e. if all the observed variation was within studies). The difference between these estimates is the between-study variability, expressed as τ2 (“tau squared”). Studies are then weighted by the inverse of the variance within that study and the between-study variance τ2. Because τ2 is constant across studies, if there is large between-study variation, this contributes a major, fixed component of study weights; and so the meta-analysis becomes more like a simple average. Where τ2 is measured as zero, the meta-analysis behaves as a fixed effects meta-analysis.
-
(e)
Importantly, the choice between fixed and random effects approaches should be made in advance, on the basis of investigator expectations of whether they expect there to be differences in true effect sizes between studies, rather than being decided once the data have been collected.
-
(a)
-
3.
Establishing differences between studies
-
(a)
As discussed above, the primary purpose of meta-analyses of in vivo data is not to come to some overall estimate of effect, but rather to gain a better understanding of differences in effect size between different types of studies. There are a number of approaches to this. Firstly we will outline these different approaches and then consider the strengths and weaknesses of each.
-
(b)
Partitioning heterogeneity: In this approach, the overall heterogeneity between studies is calculated as the weighted sum of the squared deviations from the fixed effects estimate. The studies are then divided (partitioned) according to the variable of interest, and meta-analysis is performed within each group. From this we calculate the within-group heterogeneity as the weighted sum of the squared deviations from the fixed effects estimate within that group. We can then add together all of these “within-group heterogeneities” and subtract this from the overall heterogeneity. What remains, the between-group heterogeneity, is interpreted as the differences which are “explained” by our partitioning, and the significance of such differences can be tested using the χ2 (“chi squared”) statistic with n−1 degrees of freedom, where n is the number of partitions.
-
(c)
Univariate meta-regression: Here we seek to model observed outcome (the dependent variable) in a simple regression equation. Firstly, we label each study for its status for the category of interest. Where this is a binary variable (present or absent), studies are labelled 0 or 1. For continuous variables such as weight, dose or time, it may be appropriate to offer these directly to the model, if you consider the response will be linear (or could be transformed to a linear response) or you could divide the studies into categories, for instance, in tertiles or quartiles of the distribution of values. For these and other categorical variables, we then create a series of dummy variables where each value of the category is either present or absent. With this approach we have redundant information – if there are three categories, and a study does not belong to A or B, it must belong to category C. It is our practice to censor the category which is the largest and to consider these as a reference category included in the baseline (and accounted for in the constant term (β0) of the regression equation).
-
(d)
Univariate meta-regression is essentially a linear regression, except that the best fitting model is chosen based on the minimisation of the weighted deviations from the model, with weights calculated as described above – so more precise studies are given greater weight. The constant (β0) is an estimate of the treatment effect in the base case (usually describing the most commonly observed value for the category in question), and the other β-coefficients give an estimate of the different efficacies observed for other values of the category being studied). These coefficients are reported with their standard errors, from which it is possible to determine whether the coefficient is significantly different from zero. Most software packages (such as R metafor and STATA metareg) are also able to provide 95% confidence intervals for efficacy according to each of the modelled values within the category.
-
(e)
Multiple meta-regression: In this extension, instead of one variable being offered, multiple variables can be offered simultaneously. As with other regression approaches, this can be done with unselected variables or with variables selected following univariate meta-regression, and it is possible to include interaction terms if this is desired. There is much discussion about both the number of instances of a variable within a category required for valid analysis and the number of categories which might be included. Having a small number of variables within a category will lead to imprecision in the estimate of the β-coefficient, but otherwise is unlikely to have deleterious consequences. For the number of variables which might be modelled, there is a general consensus that this should be no more than 10% of the number of observations, although the provenance of this recommendation is unknown to us.
-
(f)
Tools: Most software packages have packages developed to support these approaches. The flexibility of R, and in particular the ability to embed R code within shinyapps, makes this a particularly attractive approach, and our shinyapp, developed to support the SyRF platform, is available at https://camarades.shinyapps.io/meta-analysis-app-syrf/.
-
(g)
Choosing the best approach: Meta-analysis is a well-established technique, and many books and guides (e.g. the Cochrane Handbook, https://training.cochrane.org/handbook) are available. However, there are important differences between datasets derived from human clinical trials and those from animal studies. Broadly, human reviews include a relatively small number of studies each including a large number of subjects, addressing a reasonably well-focussed question. There may be substantial heterogeneity of subjects (different ages, sex, disease severity, geographical location, treatment centre) within a single study. In contrast, in animal reviews, there are usually a large number of individually small studies, and there may be much less focus (different drug doses because investigators have studied dose-response relationship, different stages or severity of disease, different species, different disease models, different outcome measures). Within each study, however, there is less heterogeneity, often sung animals of the same sex, age and weight of identical genetic background kept in the same cages on the same diet and undergoing identical study-related procedures.
It turns out these differences affect the performance of the statistical approaches used. Firstly, SMD estimates of effect size are less precise, as discussed in 1(c) above. In estimating the overall effect, NMD estimation of effect size has substantially greater power.
As well as having an impact on the effect size, this also has an impact on the attributed weight; studies which (through sampling error) have underestimated variance are given too much weight and (because calculated heterogeneity is the weighted squared deviation from the fixed effects estimate) contribute disproportionately to the observed heterogeneity. Following partitioning, the fixed effects estimate within that partition will move substantially towards overweighted studies (because they carry so much weight), and the within-group heterogeneity will fall substantially as a result.
-
(h)
This gives a large artefactual increase in the between-study heterogeneity, which results in false-positive test of significance. In simulation studies we have recently shown that this false-positive rate, for NMD estimates of effect size, is over 50% (Wang et al. 2018). SMD is not affected to quite the same extent, but the power of that approach is limited. In contrast, in those simulations, both univariate and multivariable meta-analyses have acceptable false-positive rates (at around the expected level of 5%); and here the power of the NMD approach is again higher than SMD approaches (Wang et al. 2018).
-
(i)
However, for reasons given above, it may not always be possible to calculate NMD effect sizes, and insistence on this approach would lead to exclusion of some studies. The best approach here depends on the number and the proportion of studies which would have to be excluded; if this number is less than around 30% of the total, and the studies to be excluded are in other respects typical of the included studies, then exclusion with NMD analysis provides greater statistical power. If however more than 30% of studies would be excluded, or these studies have specific features of interest not represented elsewhere in the dataset, it may be better to accept some diminution of power.
-
(a)
-
4.
Approaches to identifying publication bias
-
(a)
The Soviet Union had two key newspapers, Izvestia and Pravda. An old Russian joke held that Izvestia meant “News” and Pravda meant “Truth”, and that meant there was no truth in Izvestia and no news in Pravda. The scientific literature is similarly afflicted by a focus on things which are newsworthy, but not necessarily true. Because our experiments (biases in the underlying study designs notwithstanding) sample underlying truth, our experiments are approximations to that truth. The results of our sampling are likely to follow a normal distribution, with some overstating and some understating the observed effect and most being about right. If our publication model only communicates a subset of our experimental results – selected, for instance, on the basis of statistical “significance” – then the literature will mislead. Rosenthal described this as the file drawer problem, where the 5% of studies which were falsely positive were in the journals and the 95% which were truly negative were in the file drawers of the investigators. His statement contains a latent suggestion that the problem may be due as much to investigators not seeking publication, rather than journals rejecting neutral or negative findings. Certainly, there is evidence from human clinical trials that this may be the case (Chan et al. 2014).
-
(b)
In meta-analysis, we have the advantage of seeing a collection of publications rather than a single publication. If there is an underlying effect, we would expect to see a distribution of estimates around that true underlying effect, with more precise studies giving estimates closer to the true effect and less precise studies giving more variable estimates. A funnel plot is a graphical representation of effect size plotted against a measure of precision, and asymmetry is suggestive of “small study” effects, which include but are not limited to publication bias. As well as visual inspection, it is possible to analyse this mathematically using either Egger regression or the iterative “trim and fill” approach.
-
(c)
Each of these approaches requires using a measure of precision, and because SMD effect size estimates are based in part on a consideration of precision, this leads to constraints in the possible values represented in a funnel plot determined in part by the number of subjects in each study. In clinical research this “n” is highly variable, and so few studies have the exact same n. In contrast, most animal studies are small, and many studies will have the same number of subjects. This leads to funnel plots showing studies with the same “n” describing curves easily seen in visual inspections. Analysis of several existing datasets using both SMD and NMD approaches and simulation studies modelling the presence of publication bias approaches have shown significant publication bias is more frequently found with SMD (rather than NMD) estimates of effect size. The simulation studies suggested that this was due to increased false-positive results with SMD analysis (Zwetsloot et al. 2017), and the authors suggested that, if it is not possible to use NMD effect size estimates, alternative measure of precision such as the square root of the number of experimental subjects should be used instead.
-
(d)
Selective outcome reporting bias: Unlike human clinical trials publications, most publications describing in vivo research report findings from more than one experimental cohort, and – like human studies – they often describe more than one outcome from each cohort or the same outcome measured at different times. This gives substantial opportunities for selective reporting of outcome data and is a main factor in recommendations that ex ante study protocols should specify which outcome measure will be considered the primary yardstick of success or failure and a listing of all the outcomes which will be measured.
The extent of such selective outcome reporting can be estimated by seeking evidence of an excess of significant studies. Essentially the approach is to establish an overall measure of effect, to then estimate, based on the characteristics of identified studies, the number of positive studies one would expect to observe and then to compare this to the number of positive studies actually observed. Any excess significance might be due to data coercion in individual experiments (asymmetric exclusion of outliers, flexibility in statistical tests applied) or to the selective non-reporting of outcomes which do not reach statistical significance. Tsilidis et al. have applied this approach to the in vivo neuroscience literature (Tsilidis et al. 2013) and suggest that in some fields, up to 75% of experimental outcomes may be unreported.
-
(a)
-
5.
How complete are the data?
Useful biomedical research informs either further research or policy decisions. Further research may involve seeking to apply the findings in a different research domain, for instance, where findings from in vivo research provide motivation for a human clinical trial. This is conventionally called “translational research”. Alternatively, if there are not yet sufficient data to support such translation, there may be motivation to conduct further research in the same domain, which one might term “cis-lational research”, or to decide that further research is likely to be fruitless. Getting these decisions right is critical and depends not only on the findings of individual experiments but also on an assessment of the “maturity”, the completeness of the data portfolio being assessed. There are of course no precise boundaries, but in principle at least it should be possible to predict the chances of successful translation or of appropriate discontinuation. This might allow more rational research investment decisions to be made. The thresholds of evidence required for translation or discontinuation will of course differ according to circumstance; a lower threshold for translation would be appropriate, for instance, for the development of a treatment for Ebola virus infection than for the common cold.
To date, we have not had the tools to allow a quantitative assessment of a data portfolio against these thresholds, and such decisions have been largely qualitative, based instead on habit, experience and expert opinion. However, systematic review and meta-analysis are beginning to offer novel approaches. The optimal approach is not yet clear, but in our reviews both of tissue plasminogen activator (tPA) and of hypothermia in focal cerebral ischaemia, we have mature datasets, developed because investigators have been interested either in the effectiveness of co-treatments or where these interventions have been used as a positive control.
-
(a)
Assessing the impact of known variables of interest and their beta coefficients: In some fields there is reasonably clear consensus around a range of circumstance under which efficacy should be observed in animal studies to justify attempted translation to human clinical trials. For instance, the stroke community, in the Stroke Therapy Academic Industry Roundtable (STAIR), suggested that efficacy be observed in more than one species, for both structural (infarct volume) and functional (neurobehavioral) outcomes, in animals with comorbidities (STAIR 1999). Using meta-regression it is possible to go beyond the basic requirement that efficacy be observed in such circumstances, to consider also the precision of the estimate of efficacy in each species, for both structural and functional outcomes, for animals with comorbidities and so on. This can be established using meta-regression, the factor of interest being the precision of the estimates of the beta coefficients for each of these features. For instance, it might be considered desirable that the impact of co-morbidity be estimated to within a 5% difference in infarct volume.
-
(b)
The precision of the estimate of the impact of species on the efficacy of tPA in reducing infarct volume changed over time, increasing as more experiments were available for analysis. The figure shows the precision of the estimate of effect in different species and how this changed as the literature grew. For simplicity we show the estimates when 25, 50, 75% and all of the data (by date of publication) were included. If it were considered important to have a precise estimate of efficacy in primates, then further experiments are required. If knowing the difference between rats and mice is all that is important, then the data for species can be considered mature (Fig. 1 ).
Fig. 1 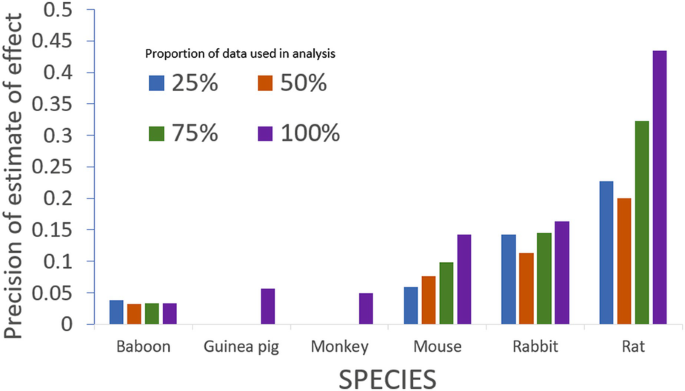
Increasing precision in estimating the impact of species: because tPA is often tested in combination with other drugs, the literature is particularly mature. This allows us to observe changes in the precision of the estimation of the impact of the species of the experimental animal (the inverse of the standard error of the beta coefficient derived from meta-regression) as the amount of available data grows. In the figure we show precision after 75, 150 and 225; and finally the complete set of 301 experiments were available for analysis
-
(c)
Total variability and marginal change in τ2: We know that, even when offered a large number of potential independent variables, meta-regression is able to explain only a modest proportion of the observed variability. We consider that this is due to the impact of other variables which might either be latent (unreported or unknown to the investigators) or too sparsely represented to be sampled (for instance, between-lab effects). Under these circumstances, it would be interesting to know whether an additional experiment would add valuable new information or whether the data can be considered complete.
-
(d)
As discussed above, the between-study differences are measured using a statistic called τ2, for which different measures are available. The computationally simplest approach is the DerSimonian and Laird estimator. This is derived from the observed Cochrane’s Q and gives an estimate of the heterogeneity adjusted for the number of observations. However, it tends to give biased estimates when sample size is small, and alternative approaches such as restricted maximum likelihood (REML) are now widely available and are probably more appropriate in the context of meta-analysis of animal data.
-
(e)
When the evidence in support of a hypothesis is immature, we expect that additional experiments – through deliberate or accidental differences in the circumstance of testing – will add to the value of τ2. Conversely, when a field is mature, additional experiments will add little useful additional information and will not increase the observed τ2. We can therefore track – again using the tPA and hypothermia datasets described above – how τ2 changes as new studies are added.
-
(f)
When we do this, an interesting biphasic pattern emerges. At first there is a rapid increase in observed τ2, followed by a decline, followed by another increase (although not to the same peak as the first rise), after which the value is relatively constant. We think that the first rise in heterogeneity reflects differences in experimental design (for instance, using different drug doses to characterise dose-response relationships) and heterogeneity as different research teams seek to replicate the originator finding. The fall occurs, we propose, as the community unites or coalesces around designs where efficacy is reliably observed. The second rise, we propose, occurs as investigators seek to extend the range of circumstances under which efficacy is seen, to identify the limits to efficacy. Finally, the plateau occurs when investigators have tested all relevant circumstances and represents the maturation of the evidence. Under this schema, evidence for efficacy cannot be considered mature until τ2 has plateaued.
-
(g)
Using datasets from systematic reviews of NXY059 (Macleod et al. 2008), FK506 (Macleod et al. 2005), nicotinamide (Macleod et al. 2004), tirilazad (Sena et al. 2007), IL1RA (McCann et al. 2016), hypothermia (van der Worp et al. 2007) and tPA (Sena et al. 2010), which include varying numbers of experiments, we have performed cumulative random effects meta-analysis and investigated the changes in the heterogeneity as more studies are added. As the number of included studies increases, all the datasets show the expected increase in Cochrane’s Q. However, for both I2 (the percentage of the variability in effect sizes that is due to variability between studies rather than just random sampling error) and when Q is adjusted for the number of included studies, there is first an increase with small number of studies, followed by a slow decline and stabilisation as more studies are included. Using cumulative meta-regression with inclusion of explanatory variables in the analysis shows an increasing precision in the estimates of beta coefficients with inclusion of more studies. Similarly, the cumulative between-study variability (measured using the REML estimate of τ2 explained by an explanatory variable shows an initial peak with a later decreasing trend, where it gradually stabilises, suggesting that saturation of evidence has been reached. These preliminary findings using seven preclinical datasets suggest that the systematic characterisation of heterogeneity within stroke datasets relating to important community-identified requirements for the circumstances in which efficacy is observed, when considered alongside the size of effects observed, might form the basis of a useful guide to inform decisions to proceed with further clinical testing.
-
(h)
It is inconceivable that a drug will show efficacy under all conceivable circumstances of testing; and (for decisions to embark on human clinical trials at least) it is important that the limits to efficacy are established. Therefore, where a cohort of animal studies shows evidence for efficacy but little or no heterogeneity, this should raise concern – it is scarcely credible that a drug always works and much more likely that the range of circumstances under which efficacy has been tested has been too narrow reliably to define the characteristics of drug response.
-
(i)
This is important; the GRADE approach to evidence synthesis considers that heterogeneity in a body of evidence is a bad thing and that the strength of evidence-based recommendations should be downgraded in the presence of heterogeneity. While this may be true for very tightly defined clinical questions, it is in our view certainly not the case when summarising a group of animal studies.
-
(a)
-
6.
Examples
-
(a)
Disease models: Systematic review and meta-analysis can be used to summarise published work using a particular disease model. For instance, Currie and colleagues examined the literature on bone cancer-induced pain (Currie et al. 2013). Across 112 studies they found substantial increases in pain-related behaviours, most commonly measured using mechanical allodynia, along with reduced body weight and reduced locomotion, but no change in reported food intake. There was also evidence of changes in the spinal cord, each reported by more than five publications, of astrocytosis, and increased c-Fos, substance P (NK1) receptor internalisation, dynorphin, IL-1b and TNF-a.
-
(b)
Drugs: Rooke et al. reported (Rooke et al. 2011) the effect of dopamine agonists in animal models of Parkinson’s disease. For drugs tested in more than one publication, all drugs in common clinical use showed evidence of substantial efficacy, with ropinirole, rotigotine, apomorphine, lisuride and pramipexole having more efficacy (in the point estimate) than the 95% confidence limits of the overall estimate for all drugs combined. However, as discussed above these estimates have limited value, and random allocation to group was reported by 16% of publications (16%), blinded assessment of outcome by 15% and a sample size calculation by <1%. Across all neurobehavioural outcomes, there was an inverse relationship between study quality and effect size, and reporting of blinded assessment of outcome was associated with significantly smaller effect sizes.
-
(c)
Outcome measures: Egan et al. conducted a systematic review of publications reporting the efficacy of drugs tested in animal models of Alzheimer’s disease (Egan et al. 2016). As well as describing the variety of neurobehavioural and histological outcomes which had been reported, they gave particular focus to the use of the Morris water maze. Reporting of experimental details was generally incomplete; 16% of studies did not report the size of the water maze used, and in those that did, this ranged from 85 cm to 200 cm. 35% of studies did not report water temperature, and in those that did, this ranged from 16°C to 28°C. The number of acquisition trials per day ranged from 2 to 12 and was unreported in 23%, and the number of days training ranged from 1 to 15 and was unreported in 13. Remarkably, in 57 publications describing the probe phase, there were 59 different approaches used to demonstrate efficacy, suggesting a degree of flexibility in analysis and reporting. Only 36% of experiments reported randomisation to intervention or control, and only 24% of experiments reported the blinded assessment of outcome. Overall, reported efficacy was significantly higher in non-randomised and in non-blinded studies.
-
(d)
Risks of bias: Following the publication of the neutral SAINT II trial (Shuaib et al. 2007), we conducted a systematic review of published in vivo data on the efficacy of NYY-059 (Macleod et al. 2008). Reporting of measures to reduce the risk of bias was again low, with lower estimates of improvement in infarct volume in those studies which reported randomisation, in those which reported the blinded conduct of the experiment and in those which reported the blinded assessment of outcome. These findings were supported by a later individual animal meta-analysis which also had access to unpublished industry data (Bath et al. 2009).
In later work we examined reporting of risks of bias in work published in leading journals and, separately, in work from leading UK institutions (Macleod et al. 2015). We found journal impact factor to be no guarantee of study quality, and in fact randomisation was less frequently reported in high-impact journals. At an institutional level, only 1 of 1,173 publications from leading UK institutions reported 4 aspects of study design (randomisation, blinding, reporting of inclusions and exclusions and sample size calculations) identified by Landis et al. as being critical to allowing readers to judge the provenance of the findings presented, and 68% of publications reported not one of these.
-
(e)
Power calculations: Appropriate design of animal experiments includes consideration of how many subjects should be included. Formal power calculations require assertion of the minimum effect size of interest which the investigator would like to be able to detect, their tolerance of the risk of missing a true result and the variability of the outcome measure used. As well as giving some indication of the possible statistical variance which might be observed when a lab uses a model or outcome measure for the first time, knowledge of the performance of different outcome measures testing broadly similar behavioural substrates can inform refinement of experimental designs to reduce animal pain and suffering. For instance, as part of a systematic review of animal studies modelling chemotherapy-induced peripheral neuropathy, Currie et al. compared the statistical performance of different approaches to measuring mechanical allodynia, showing superiority of electronic over mechanical von Frey testing (Currie et al. 2019).
-
(f)
Curated current contents: Borrowing from the concept of “Living” systematic reviews (Elliott et al. 2017), real-time information in a given field can be summarised on an online platform which presents the up-to-date results visually. Ideally, such a platform should be interactive, allowing any research user (a biomedical researcher, a funder, an institution) not only to gain a quick overview of the field but also to filter the results in a way which is most relevant to them, e.g. by specific models or treatments of interest, by reporting quality or by year of publication. Two recent examples are our RShiny applications which summarise the literature on animal models of depression (https://abannachbrown.shinyapps.io/preclinical-models-of-depression/) and animal models of chemotherapy-induced peripheral neuropathy (https://khair.shinyapps.io/CIPN/).
-
(a)

3 Summary
The amount of relevant in vivo data is substantial, and nonsystematic attempts to summarise what is already known may draw misleading conclusions. Because the selection of included information is an objective process, it is not possible critically to appraise the conclusions drawn, other than by reference to the reputation of the authors (as indeed is the case with the current work). Systematic review offers a transparent approach to identifying relevant information such that it would be possible for others to replicate the approach. Such reviews also allow ascertainment of the features of a body of work, which might lead to suggestions for how a field might seek improvement. Meta-analysis allows a quantitative summary of overall effects, any association between various study design factors and observed outcome, an assessment of the likelihood of publication bias and recommendations for sample size calculations for future experiments.
While the process is burdensome, the value of the information obtained is substantial, and emerging automation tools are likely substantially to reduce the costs, and the time taken, for systematic review and meta-analysis.
References
Bahor Z, Liao J, Macleod MR, Bannach-Brown A, McCann SK, Wever KE et al (2017) Risk of bias reporting in the recent animal focal cerebral ischaemia literature. Clin Sci (Lond) 131(20):2525–2532. https://doi.org/10.1042/CS20160722
Bannach-Brown A, Przybyla P, Thomas J, Rice ASC, Ananiadou S, Liao J et al (2019) Machine learning algorithms for systematic review: reducing workload in a preclinical review of animal studies and reducing human screening error. Syst Rev 8(1):23. https://doi.org/10.1186/s13643-019-0942-7
Bath PM, Gray LJ, Bath AJ, Buchan A, Miyata T, Green AR (2009) Effects of NXY-059 in experimental stroke: an individual animal meta-analysis. Br J Pharmacol 157(7):1157–1171
Chan AW, Song F, Vickers A, Jefferson T, Dickersin K, Gotzsche PC et al (2014) Increasing value and reducing waste: addressing inaccessible research. Lancet 383(9913):257–266. https://doi.org/10.1016/S0140-6736(13)62296-5
Cramond F, O’Mara-Eves A, Doran-Constant L, Rice AS, Macleod M, Thomas J (2018) The development and evaluation of an online application to assist in the extraction of data from graphs for use in systematic reviews. Wellcome Open Res 3:157. https://doi.org/10.12688/wellcomeopenres.14738.3
Currie GL, Delaney A, Bennett MI, Dickenson AH, Egan KJ, Vesterinen HM et al (2013) Animal models of bone cancer pain: systematic review and meta-analyses. Pain 154(6):917–926
Currie GL, Angel-Scott HN, Colvin L, Cramond F, Hair K, Khandoker L et al (2019) Animal models of chemotherapy-induced peripheral neuropathy: a machine-assisted systematic review and meta-analysis. PLoS Biol 17(5):e3000243. https://doi.org/10.1371/journal.pbio.3000243
Egan KJ, Vesterinen HM, Beglopoulos V, Sena ES, Macleod MR (2016) From a mouse: systematic analysis reveals limitations of experiments testing interventions in Alzheimer’s disease mouse models. Evid Based Preclin Med 3:e00015
Elliott JH, Synnot A, Turner T, Simmonds M, Akl EA, McDonald S et al (2017) Living systematic review: 1. Introduction-the why, what, when, and how. J Clin Epidemiol 91:23–30. https://doi.org/10.1016/j.jclinepi.2017.08.010.
Macleod MR, O’Collins T, Howells DW, Donnan GA (2004) Pooling of animal experimental data reveals influence of study design and publication bias. Stroke 35(5):1203–1208
Macleod MR, O'Collins T, Horky LL, Howells DW, Donnan GA (2005) Systematic review and metaanalysis of the efficacy of FK506 in experimental stroke. J Cereb Blood Flow Metab 25(6):713–721
Macleod MR, van der Worp HB, Sena ES, Howells DW, Dirnagl U, Donnan GA (2008) Evidence for the efficacy of NXY-059 in experimental focal cerebral ischaemia is confounded by study quality. Stroke 39(10):2824–2829
Macleod MR, Lawson MA, Kyriakopoulou A, Serghiou S, de WA, Sherratt N et al (2015) Risk of bias in reports of in vivo research: a focus for improvement. PLoS Biol 13(10):e1002273
Marshall IJ, Kuiper J, Wallace BC (2016) RobotReviewer: evaluation of a system for automatically assessing bias in clinical trials. J Am Med Inform Assoc 23(1):193–201. https://doi.org/10.1093/jamia/ocv044
McCann SK, Cramond F, Macleod MR, Sena ES (2016) Systematic review and Meta-analysis of the efficacy of Interleukin-1 receptor antagonist in animal models of stroke: an update. Transl Stroke Res 7(5):395–406. https://doi.org/10.1007/s12975-016-0489-z
Munafo MR, Stothart G, Flint J (2009) Bias in genetic association studies and impact factor. Mol Psychiatry 14(2):119–120
Rooke ED, Vesterinen HM, Sena ES, Egan KJ, Macleod MR (2011) Dopamine agonists in animal models of Parkinson’s disease: a systematic review and meta-analysis. Parkinsonism Relat Disord 17(5):313–320
Sena E, Wheble P, Sandercock P, Macleod M (2007) Systematic review and meta-analysis of the efficacy of tirilazad in experimental stroke. Stroke 38(384):391
Sena ES, Briscoe CL, Howells DW, Donnan GA, Sandercock PA, Macleod MR (2010) Factors affecting the apparent efficacy and safety of tissue plasminogen activator in thrombotic occlusion models of stroke: systematic review and meta-analysis. J Cereb Blood Flow Metab 30(12):1905–1913
Shuaib A, Lees KR, Lyden P, Grotta J, Davalos A, Davis SM et al (2007) NXY-059 for the treatment of acute ischemic stroke. N Engl J Med 357(6):562–571
Simmonds M, Salanti G, McKenzie J, Elliott J (2017) Living systematic review N. living systematic reviews: 3. Statistical methods for updating meta-analyses. J Clin Epidemiol 91:38–46. https://doi.org/10.1016/j.jclinepi.2017.08.008
STAIR (1999) Recommendations for standards regarding preclinical neuroprotective and restorative drug development. Stroke 30(12):2752–2758
Thomas J, Noel-Storr A, Marshall I, Wallace B, McDonald S, Mavergames C et al (2017) Living systematic reviews: 2. Combining human and machine effort. J Clin Epidemiol 91:31–37. https://doi.org/10.1016/j.jclinepi.2017.08.011
Tsilidis KK, Panagiotou OA, Sena ES, Aretouli E, Evangelou E, Howells DW et al (2013) Evaluation of excess significance bias in animal studies of neurological diseases. PLoS Biol 11(7):e1001609
van der Worp HB, Sena ES, Donnan GA, Howells DW, Macleod MR (2007) Hypothermia in animal models of acute ischaemic stroke: a systematic review and meta-analysis. Brain 130(Pt 12):3063–3074
Wang Q, Liao J, Hair K, Bannach-Brown A, Bahor Z, Currie GL et al (2018) Estimating the statistical performance of different approaches to meta-analysis of data from animal studies in identifying the impact of aspects of study design. bioRxiv:256776. https://doi.org/10.1101/256776
Zwetsloot PP, van der Naald M, Sena ES, Howells DW, IntHout J, de Groot JA et al (2017) Standardized mean differences cause funnel plot distortion in publication bias assessments. elife 6:10. https://doi.org/10.7554/eLife.24260
Author information
Authors and Affiliations
Corresponding author
Editor information
Editors and Affiliations
Rights and permissions
Open Access This chapter is licensed under the terms of the Creative Commons Attribution 4.0 International License (http://creativecommons.org/licenses/by/4.0/), which permits use, sharing, adaptation, distribution and reproduction in any medium or format, as long as you give appropriate credit to the original author(s) and the source, provide a link to the Creative Commons licence and indicate if changes were made.
The images or other third party material in this chapter are included in the chapter's Creative Commons licence, unless indicated otherwise in a credit line to the material. If material is not included in the chapter's Creative Commons licence and your intended use is not permitted by statutory regulation or exceeds the permitted use, you will need to obtain permission directly from the copyright holder.
Copyright information
© 2019 The Author(s)
About this chapter

Cite this chapter
Macleod, M.R., Tanriver-Ayder, E., Hair, K., Sena, E. (2019). Design of Meta-Analysis Studies. In: Bespalov, A., Michel, M., Steckler, T. (eds) Good Research Practice in Non-Clinical Pharmacology and Biomedicine. Handbook of Experimental Pharmacology, vol 257. Springer, Cham. https://doi.org/10.1007/164_2019_289
Download citation
DOI: https://doi.org/10.1007/164_2019_289
Published:
Publisher Name: Springer, Cham
Print ISBN: 978-3-030-33655-4
Online ISBN: 978-3-030-33656-1
eBook Packages: Biomedical and Life SciencesBiomedical and Life Sciences (R0)