
Abstract
Single-case experimental designs (SCEDs) are increasingly used in fields such as clinical psychology and educational psychology for the evaluation of treatments and interventions in individual participants. The AB phase design, also known as the interrupted time series design, is one of the most basic SCEDs used in practice. Randomization can be included in this design by randomly determining the start point of the intervention. In this article, we first introduce this randomized AB phase design and review its advantages and disadvantages. Second, we present some data-analytical possibilities and pitfalls related to this design and show how the use of randomization tests can mitigate or remedy some of these pitfalls. Third, we demonstrate that the Type I error of randomization tests in randomized AB phase designs is under control in the presence of unexpected linear trends in the data. Fourth, we report the results of a simulation study investigating the effect of unexpected linear trends on the power of the randomization test in randomized AB phase designs. The implications of these results for the analysis of randomized AB phase designs are discussed. We conclude that randomized AB phase designs are experimentally valid, but that the power of these designs is sufficient only for large treatment effects and large sample sizes. For small treatment effects and small sample sizes, researchers should turn to more complex phase designs, such as randomized ABAB phase designs or randomized multiple-baseline designs.
Introduction
Single-case experimental designs (SCEDs) can be used to evaluate treatment effects for specific individuals or to assess the efficacy of individualized treatments. In such designs, repeated observations are recorded for a single person on a dependent variable of interest, and the treatment can be considered as one of the levels of the independent variable (Barlow, Nock, & Hersen, 2009; Kazdin, 2011; Onghena, 2005). SCEDs are widely used as a methodological tool in various domains of science, including clinical psychology, school psychology, special education, and medicine (Alnahdi, 2015; Chambless & Ollendick, 2001; Gabler, Duan, Vohra, & Kravitz, 2011; Hammond & Gast, 2010; Kratochwill & Stoiber, 2000; Leong, Carter, & Stephenson, 2015; Shadish & Sullivan, 2011; Smith, 2012; Swaminathan & Rogers, 2007). The growing interest in these types of designs can be inferred from the recent publication of guidelines for reporting the results of SCEDs in various fields of the educational, behavioral, and health sciences (Shamseer et al., 2015; Tate et al., 2016; Vohra et al., 2015).
SCEDs are often confused with case studies or other nonexperimental research, but these types of studies should be clearly distinguished from each other (Onghena & Edgington, 2005). More specifically, SCEDs involve the deliberate manipulation of an independent variable, whereas such a manipulation is absent in nonexperimental case studies. In addition, the reporting of results from SCEDs usually involves visual and statistical analyses, whereas case studies are often reported in a narrative way.
SCEDs should also be distinguished from experimental designs that are based on comparing groups. The principal difference between SCEDs and between-subjects experimental designs concerns the definition of the experimental units. Whereas the experimental units in group-comparison studies refer to participants assigned to different groups, the experimental units in SCEDs refer to repeated measurements of specific entities under investigation (e.g., a person) that are assigned to different treatments (Edgington & Onghena, 2007). Various types of SCEDs exist. In the following section we will discuss the typology of single-case designs.
Typology of single-case experimental designs
A comprehensive typology of SCEDs can be constructed using three dimensions: (1) whether the design is a phase or an alternation design, (2) whether or not the design contains random assignment, and (3) whether or not the design is replicated. We will discuss each of these dimensions in turn.
Design type
Various types of SCEDs can be broadly categorized into two main types: phase designs and alternation designs (Heyvaert & Onghena, 2014; Onghena & Edgington, 2005; Rvachew & Matthews, 2017), although hybrids of both types are possible (see, e.g., Levin, Ferron, & Gafurov, 2014; Onghena, Vlaeyen, & de Jong, 2007). Phase designs divide the sequence of measurement occasions in a single-case experiment (SCE) into separate treatment phases, with each phase containing multiple measurements (Edgington, 1975a, 1980; Onghena, 1992). The basic building block of phase designs is the AB phase design that features a succession of a baseline phase (A) and a treatment phase (B). This basic design can be expanded by including more A phases or B phases leading to more complex phase designs such as ABA and ABAB phase designs. Furthermore, it is also possible to construct phase designs that compare more than two treatments (e.g., an ABC design). In contrast to phase designs, alternation designs do not feature distinct phases but rather involve rapid alternation of the experimental conditions throughout the course of the SCE. Consequently, these designs are intended for research situations in which rapid and frequent alternation of treatments is possible (Barlow & Hayes, 1979; Onghena & Edgington, 1994). Some common alternation designs include the completely randomized design (CRD), the randomized block design (RBD), and the alternating treatments design (ATD, Onghena, 2005). Manolov and Onghena (2017) provide a recent overview of the use of ATDs in published single-case research and discuss various data-analytical techniques for this type of design.
Random assignment
When treatment labels are randomly assigned to measurement occasions in an SCED, one obtains a randomized SCED. This procedure of random assignment in an SCED is similar to the way in which subjects are randomly assigned to experimental groups in a between-subjects design. The main difference is that in SCEDs repeated measurement occasions for one subject are randomized across two or more experimental conditions whereas in between-subjects designs individual participants are randomized across two or more experimental groups. The way in which SCEDs can be randomized depends on the type of design. Phase designs can be randomized by listing all possible intervention start points and then randomly selecting one of them for conducting the actual experiment (Edgington, 1975a). Consider, for example, an AB design, consisting of a baseline (A) phase and a treatment (B) phase, with a total of ten measurement occasions and a minimum of three measurement occasions per phase. For this design there are six possible start points for the intervention, leading to the following divisions of the measurement occasions:
AAABBBBBBB
AAAABBBBBB
AAAAABBBBB
AAAAAABBBB
AAAAAAABBB
This type of randomization can also be applied to more complex phase designs, such as ABA or ABAB phase designs, by randomly selecting time points for all the moments of phase change in the design (Onghena, 1992). Alternation designs are randomized by imposing a randomization scheme on the set of measurement occasions, in which the treatment conditions are able to alternate throughout the experiment. The CRD is the simplest alternation design as it features “unrestricted randomization.” In this design, only the number of measurement occasions for each level of the independent variable has to be fixed. For example, if we consider a hypothetical SCED with two conditions (A and B) and three measurement occasions per condition, there are 20 possible randomizations \( \left(\genfrac{}{}{0pt}{}{6}{3}\right) \) using a CRD:
AAABBB | BBBAAA |
AABABB | BBABAA |
AABBAB | BBAABA |
AABBBA | BBAAAB |
ABAABB | BABBAA |
ABABAB | BABABA |
ABABBA | BABAAB |
ABBAAB | BAABBA |
ABBABA | BAABAB |
ABBBAA | BAAABB |
The randomizations schemes for an RBD or an ATD can be constructed by imposing additional constraints on the CRD randomization scheme. For example, an RBD is obtained by grouping measurement occasions in pairs and randomizing the treatment order within each pair. For the same number of measurement occasions as in the example above, an RBD yields 23 = 8 possible randomizations, which are a subset of the CRD randomizations.
ABABAB | BABABA |
ABABBA | BABAAB |
ABBAAB | BAABBA |
ABBABA | BAABAB |
This type of randomization can be useful to counter the effect of time-related confounding variables on the dependent variable, as the randomization within pairs (or blocks of a certain) size eliminates any time-related effects that might occur within these pairs. An ATD randomization scheme can be constructed from a CRD randomization scheme with the restriction that only a certain maximum number of successive measurement occasions are allowed to have the same treatment, which ensures rapid treatment alternation. Using the example of our hypothetical SCED, an ATD with a maximum number of two consecutive administrations of the same condition yields the following 14 randomizations:
AABABB | BBABAA |
AABBAB | BBAABA |
ABAABB | BABBAA |
ABABAB | BABABA |
ABABBA | BABAAB |
ABBAAB | BAABBA |
ABBABA | BAABAB |
Note again that all of these randomizations are a subset of the CRD randomizations. Many authors have emphasized the importance of randomizing SCEDs for making valid inferences (e.g., Dugard, 2014; Dugard, File, & Todman, 2012; Edgington & Onghena, 2007; Heyvaert, Wendt, Van den Noortgate, & Onghena, 2015; Kratochwill & Levin, 2010). The benefits and importance of incorporating random assignment in SCEDs are also stressed in recently developed guidelines for the reporting of SCE results, such as the CONSORT extension for reporting N-of-1 trials (Shamseer et al., 2015; Vohra et al., 2015) and the single-case reporting guideline in behavioral interventions statement (Tate et al., 2016). SCEDs that do not incorporate some form of random assignment are still experimental designs in the sense that they feature a deliberate manipulation of an independent variable, so they must still be distinguished from nonexperimental research such as case studies. That being said, the absence of random assignment in a SCED makes it harder to rule out alternative explanations for the occurrence of a treatment effect, thus weakening the internal validity of the design. In addition, it should be noted that the incorporation of randomization in SCEDs is still relatively rare in many domains of research.
Replication
It should be noted that research projects and single-case research publications rarely involve only one SCED, and that usually replication is aimed at. Kratochwill et al. (2010) noted that replication also increases the internal validity of an SCED. In this sense it is important to emphasize that randomization and replication should be used concurrently for increasing the internal validity of an SCED. Replication can occur in two different ways: simultaneously or sequentially (Onghena & Edgington, 2005). Simultaneous replication designs entail conducting multiple alternation or phase designs at the same time. The most widely used simultaneous replication design is the multiple baseline across participants design, which combines two or more phase designs (usually AB phase designs), in which the treatment is administered in a time-staggered manner across the individual participants (Hammond & Gast, 2010; Shadish & Sullivan, 2011). Sequential replication designs entail conducting individual SCEs sequentially in order to test the generalizability of the results to other participants, settings, or outcomes (Harris & Jenson, 1985; Mansell, 1982). Also for this part of the typology, it is possible to create hybrid designs by combining simultaneous and sequential features—for example, by sequentially replicating multiple-baseline across-participant designs or using a so-called “nonconcurrent multiple baseline design,” with only partial temporal overlap (Harvey, May, & Kennedy, 2004; Watson & Workman, 1981). Note that alternative SCED taxonomies have been proposed (e.g., Gast & Ledford, 2014). The focus of the present article is on the AB phase design, also known as the interrupted time series design (Campbell & Stanley, 1966; Cook & Campbell, 1979; Shadish, Cook, & Campbell, 2002).
The single-case AB phase design
The AB phase design is one of the most basic and practically feasible experimental designs for evaluating treatments in single-case research. Although widely used in practice, the AB phase design has received criticism for its low internal validity (Campbell, 1969; Cook & Campbell, 1979; Kratochwill et al., 2010; Shadish et al., 2002; Tate et al., 2016; Vohra et al., 2015). Several authors have rated the AB phase design as “quasi-experimental” or even “nonexperimental,” because the lack of a treatment reversal phase leaves the design vulnerable to the internal validity threats of history and maturation (Kratochwill et al., 2010; Tate et al., 2016; Vohra et al., 2015). History refers to the confounding influence of external factors on the treatment effect during the course of the experiment, whereas maturation refers to changes within the subject during the course of the experiment that may influence the treatment effect (Campbell & Stanley, 1966). These confounding effects can serve as alternative explanations for the occurrence of a treatment effect other than the experimental manipulation and as such threaten the internal validity of the SCED. Kratochwill et al. argue that the internal validity threats of history and maturation are mitigated when SCEDs contain at least two AB phase pair repetitions. More specifically, their argument is that the probability that history effects (e.g., the participant turns ill during the experiment) occurring simultaneously with the introduction of the treatment is smaller when there are multiple introductions of the treatment than in the situation in which there is only one introduction of the treatment. Similarly, to lessen the impact of potential maturation effects (e.g., spontaneous improvement of the participant yielding an upward or downward trend in the data) on the internal validity of the SCED, Kratochwill et al. argue that an SCED should be able to record at least three demonstrations of the treatment effect. For these reasons, they argue that only phase designs with at least two AB phase pair repetitions (e.g., an ABAB design) are valid SCEDs, and that designs with only one AB phase pair repetition (e.g., an AB phase design) are inadequate for drawing valid inferences. Similarly, Tate et al. and Vohra et al. do not consider the AB phase design as a valid SCED. More specifically, Tate et al. consider the AB phase design as a quasi-experimental design, and Vohra et al. even regard the AB phase design as a nonexperimental design, putting it under the same label as case studies. In contrast, the SCED classification by Logan, Hickman, Harris, and Heriza (2008) does include the AB phase design as a valid design.
Rather than using discrete classifications, we propose a gradual view of evaluating the internal validity of an SCED. In the remainder of this article we will argue that randomized AB phase designs have an important place in the methodological toolbox of the single-case researcher as valid SCEDs. It is our view that the randomized AB phase design can be used as a basic experimental design for situations in which this design is the only feasible way to collect experimental data (e.g., when evaluating treatments that cannot be reversed due to the nature of the treatment or because of ethical concerns). We will build up this argument in several steps. First, we will explain how random assignment strengthens the internal validity of AB phase designs as compared to AB phase designs without random assignment, and discuss how the internal validity of randomized AB phase designs can be increased further through the use of replication and formal statistical analysis. Second, after mentioning some common statistical techniques for analyzing randomized AB phase designs we will discuss the use of a statistical technique that can be directly derived from the random assignment that is present in randomized AB phase designs: the randomization test (RT). In addition we will discuss some potential data-analytical pitfalls that can occur when analyzing randomized AB phase designs and argue how the use of the RT can mitigate some of these pitfalls. Furthermore, we will provide a worked example of how AB phase designs can be randomized and subsequently analyzed with the RT using the randomization method proposed by Edgington (1975a). Third, we will demonstrate the validity of the RT when analyzing randomized AB phase designs containing a specific manifestation of a maturation effect: An unexpected linear trend that occurs in the data yielding a gradual increase in the scores of the dependent variable that is unrelated to the administration of the treatment. More specifically we will show that the RT controls the Type I error rate when unexpected linear trends are present in the data. Finally, we will also present the results of a simulation study that investigated the power of the RT when analyzing randomized AB phase designs containing various combinations of unexpected linear trends in the baseline phase and/or treatment phase. Apart from controlled Type I error rates, adequate power is another criterion for the usability of the RT for specific types of datasets. Previous research already investigated the effect of different levels of autocorrelation on the power of the RT in randomized AB phase designs but only for data without trend (Ferron & Ware, 1995). However, a study by Solomon (2014) showed that trend is quite common in single-case research, making it important to investigate the implications of trend effects on the power of the RT.
Randomized AB phase designs are valid single-case experimental designs
There are several reasons why the use of randomized AB phase designs should be considered for conducting single-case research. First of all, the randomized AB phase design contains all the required elements to fit the definition of an SCED: A design that involves repeated measurements on a dependent variable and a deliberate experimental manipulation of an independent variable. Second, the randomized AB phase design is the most feasible single-case design for treatments that cannot be withdrawn for practical or ethical reasons and also the most cost-efficient and the most easily implemented of all phase designs (Heyvaert et al., 2017). Third, if isolated randomized AB phase designs were dismissed as invalid, and if only a randomized AB phase design was feasible, given the very nature of psychological and educational interventions that cannot be reversed or considered undone, then practitioners would be discouraged from using an SCED altogether, and potentially important experimental evidence would never be collected.
We acknowledge that the internal validity threats of history and maturation have to be taken into account when drawing inferences from AB phase designs. Moreover we agree with the views from Kratochwill et al. (2010) that designs with multiple AB phase pairs (e.g., an ABAB design) offer better protection from threats to internal validity than designs with only one AB phase pair (e.g., the AB phase design). However, we also argue that the internal validity of the basic AB phase design can be strengthened in several ways.
First, the internal validity of the AB phase design (as well as other SCEDs) can be increased considerably by incorporating random assignment into the design (Heyvaert et al., 2015). Random assignment can neutralize potential history effects in SCEDs as random assignment of measurement occasions to treatment conditions allows us to statistically control confounding variables that may manifest themselves throughout the experiment. In a similar vein, random assignment can also neutralize potential maturation effects because any behavioral changes that might occur within the subject are unrelated to the random allocation of measurement occasions to treatment conditions (Edgington, 1996). Edgington (1975a) proposed a way to incorporate random assignment into the AB phase design. Because the phase sequence in a AB phase design is fixed, random assignment should respect this phase structure. Therefore, Edgington (1975a) proposed to randomize the start point of the treatment phase. In this approach the researcher initially specifies the total number of measurement occasions to be included in the design along with limits for the minimum number of measurement occasions to be included in each phase. This results in a range of potential start points for the treatment phase. The researcher then randomly selects one of these start points to conduct the actual experiment. By randomizing the start point of the treatment phase in the AB phase design it becomes possible to evaluate the treatment effect for each of the hypothetical start points from the randomization process and to compare these hypothetical treatment effects to the observed treatment effect from the start point that was used for the actual experiment. Under the assumption that potential confounding effects such as history and maturation are constant for the various possible start points of the treatment phase these effects are made less plausible as alternative explanations in case a statistically significant treatment effect is found. As such, incorporating random assignment into the AB phase design can also provide a safeguard for threats against internal validity without the need for adding extra phases to the design. This method of randomizing start points in AB phase designs can easily be extended to more complex phase designs such as ABA or ABAB designs by generating random start points for each moment of phase change in the design (Levin et al., 2014; Onghena, 1992).
Second, the internal validity of randomized AB phase designs can be increased further by replications, and replicated randomized AB phase designs are acceptable by most standards (e.g., Kratochwill et al., 2010; Tate et al., 2016). When a treatment effect can be demonstrated across multiple replicated randomized AB phase designs, it lowers the probability that this treatment effect is caused by history or maturation effects rather than by the treatment itself. In fact, when multiple randomized AB phase designs are replicated across participants and the treatment is administered in a staggered manner across the participants, one obtains a multiple-baseline across-participant design, which is accepted as a valid SCED according to many standards (Kratochwill et al., 2010; Logan et al., 2008; Tate et al., 2016; Vohra et al., 2015).
Third, one can increase the chance of making valid inferences from randomized AB phase designs by analyzing them statistically with adequate statistical techniques. Many data-analytical techniques for single-case research focus mainly on analyzing randomized AB phase designs and strengthening the resulting inferences (e.g., interrupted time series analysis, Borckardt & Nash, 2014; Gottman & Glass, 1978; nonoverlap effect size measures, Parker, Vannest, & Davis, 2011; multilevel modeling, Van den Noortgate & Onghena, 2003). Furthermore, one can analyze the randomized AB phase design using a statistical test that is directly derived from the random assignment that is present in the design: the RT (Kratochwill & Levin, 2010; Onghena & Edgington, 2005).
Data analysis of randomized AB phase designs: techniques and pitfalls
Techniques for randomized AB phase designs can be broadly categorized in two groups: visual analysis and statistical analysis (Heyvaert et al., 2015). Visual analysis refers to inspecting the observed data for changes in level, phase overlap, variability, trend, immediacy of the effect, and consistency of data patterns across similar phases (Horner, Swaminathan, Sugai, & Smolkowski, 2012). The advantages of visual analysis are that it is quick, intuitive, and requires little methodological knowledge. The main disadvantages of visual analysis are that small but systematic treatment effects are hard to detect (Kazdin, 2011) and that it is associated with low interrater agreement (e.g., Bobrovitz & Ottenbacher, 1998; Ximenes, Manolov, Solanas, & Quera, 2009). Although visual analysis remains widely used for analyzing randomized AB phase designs (Kazdin, 2011), there is a general consensus that visual analysis should be used concurrently with supplementary statistical analyses to corroborate the results (Harrington & Velicer, 2015; Kratochwill et al., 2010).
Techniques for the statistical analysis of randomized AB phase designs can be divided into three groups: effect size calculation, statistical modeling, and statistical inference. Effect size (ES) calculation involves evaluating treatment ESs by calculating formal ES measures. One can discern proposals that are based on calculating standardized mean difference measures (e.g., Busk & Serlin, 1992; Hedges, Pustejovsky, & Shadish, 2012), proposals that are based on calculating overlap between phases (see Parker, Vannest, & Davis, 2011, for an overview), proposals that are based on calculating standardized or unstandardized regression coefficients (e.g., Allison & Gorman, 1993; Solanas, Manolov, & Onghena, 2010; Van den Noortgate & Onghena, 2003), and proposals that are based on Bayesian methods (Rindskopf, Shadish, & Hedges, 2012; Swaminathan, Rogers, & Horner, 2014). Statistical modeling refers to constructing an adequate description of the data by fitting the data to a statistical model. Some proposed modeling techniques include interrupted time series analysis (Borckardt & Nash, 2014; Gottman & Glass, 1978), generalized mixed models (Shadish, Zuur, & Sullivan, 2014), multilevel modeling (Van den Noortgate & Onghena, 2003), Bayesian modeling techniques (Rindskopf, 2014; Swaminathan et al., 2014), and structural equation modeling (Shadish, Rindskopf, & Hedges, 2008).
Statistical inference refers to assessing the statistical significance of treatment effects through hypothesis testing or by constructing confidence intervals for the parameter estimates (Heyvaert et al., 2015; Michiels, Heyvaert, Meulders, & Onghena, 2017). On the one hand, inferential procedures can be divided into parametric and nonparametric procedures, and on the other hand, they can be divided into frequentist and Bayesian procedures. One possibility for analyzing randomized AB phase designs is to use parametric frequentist procedures, such as statistical tests and confidence intervals based on t and F distributions. The use of these procedures is often implicit in some of the previously mentioned data-analytical proposals, such as the regression-based approach of Allison and Gorman (1993) and the multilevel model approach of Van den Noortgate and Onghena (2003). However, it has been shown that data from randomized AB phase designs often violate the specific distributional assumptions made by these parametric procedures (Shadish & Sullivan, 2011; Solomon, 2014). As such, the validity of these parametric procedures is not guaranteed when they are applied to randomized AB phase designs. Bayesian inference can be either parametric or nonparametric, depending on the assumptions that are made for the prior and posterior distributions of the Bayesian model employed. De Vries and Morey (2013) provide an example of parametric Bayesian hypothesis testing for the analysis of randomized AB phase designs.
An example of a nonparametric frequentist procedure that has been proposed for the analysis of randomized AB phase designs is the RT (e.g., Bulté & Onghena, 2008; Edgington, 1967; Heyvaert & Onghena, 2014; Levin, Ferron, & Kratochwill, 2012; Onghena, 1992; Onghena & Edgington, 1994, 2005). The RT can be used for statistical inference based on random assignment. More specifically, the test does not make specific distributional assumptions or an assumption of random sampling, but rather obtains its validity from the randomization that is present in the design. When measurement occasions are randomized to treatment conditions according to the employed randomization scheme, a statistical reference distribution for a test statistic S can be calculated. This reference distribution can be used for calculating nonparametric p values or for constructing nonparametric confidence intervals for S by inverting the RT (Michiels et al., 2017). The RT is also flexible with regard to the choice of the test statistic (Ferron & Sentovich, 2002; Onghena, 1992; Onghena & Edgington, 2005). For example, it is possible to use an ES measure based on standardized mean differences as the test statistic in the RT (Michiels & Onghena, 2018), but also ES measures based on data nonoverlap (Heyvaert & Onghena, 2014; Michiels, Heyvaert, & Onghena, 2018). This freedom to devise a test statistic that fits the research question makes the RT a versatile statistical tool for various research settings and treatment effects (e.g., with mean level differences, trends, or changes in variability; Dugard, 2014).
When using inferential statistical techniques for randomized AB phase designs, single-case researchers can encounter various pitfalls with respect to reaching valid conclusions about the efficacy of a treatment. A first potential pitfall is that single-case data often violate the distributional assumptions of parametric hypothesis tests (Solomon, 2014). When distributional assumptions are violated, parametric tests might inflate or deflate the probability of Type I errors in comparison to the nominal significance level of the test. The use of RTs can provide a safeguard from this pitfall: Rather than invoking distributional assumptions, the RT procedure involves the derivation of a reference distribution from the observed data. Furthermore, an RT is exactly valid by construction: It can be shown that the probability of committing a Type I error using the RT is never larger than the significance level α, regardless of the number of measurement occasions or the distributional properties of the data (Edgington & Onghena, 2007; Keller, 2012). A second pitfall is the presence of serial dependencies in the data (Shadish & Sullivan, 2011; Solomon, 2014). Serial dependencies can lead to inaccurate variance estimates in parametric hypothesis tests, which in turn can result in either too liberal or too conservative tests. The use of RTs can also provide a solution for this pitfall. Although the presence of serial dependencies does affect the power of the RT (Ferron & Onghena, 1996; Ferron & Sentovich, 2002; Levin et al., 2014; Levin et al., 2012), the Type I error of the RT will always be controlled at the nominal level, because the serial dependency is identical for each element of the reference distribution (Keller, 2012). A third pitfall that can occur when analyzing randomized AB phase designs is that these designs typically employ a small number of measurement occasions (Shadish & Sullivan, 2011). As such, statistical power is an issue with these designs. A fourth pitfall to analyzing single-case data is the presence of an unexpected data trend (Solomon, 2014). One way that unexpected data trends can occur is through maturation effects (e.g., a gradual reduction in pain scores of a patient due to a desensitization effect). In a subsequent section of this article, we will show that the RT does not alter the probability of a Type I error above the nominal level for data containing general linear trends, and thus it also mitigates this pitfall.
Analyzing randomized AB phase designs with randomization tests: a hypothetical example
For illustrative purposes, we will discuss the steps involved in constructing a randomized AB phase design and analyzing the results with an RT by means of a hypothetical example. In a first step, the researcher chooses the number of measurement occasions to be included in the design and the minimum number of measurement occasions to be included in each separate phase. For this illustration we will use the hypothetical example of a researcher planning to conduct a randomized AB phase design with 26 measurement occasions and a minimum of three measurement occasions in each phase. In a second step, the design can be randomized using the start point randomization proposed by Edgington (1975a). This procedure results in a range of potential start points for the treatment throughout the course of the SCE. Each individual start point gives rise to a unique division of measurement occasions into baseline and treatment occasions in the design (we will refer to each such a division as an assignment). The possible assignments for this particular experiment can be obtained by placing the start point at each of the measurement occasions, respecting the restriction of at least three measurement occasions in each phase. There are 21 possible assignments, given this restriction (not all assignments are listed):
AAABBBBBBBBBBBBBBBBBBBBBBB
AAAABBBBBBBBBBBBBBBBBBBBBB
AAAAABBBBBBBBBBBBBBBBBBBBB
...
AAAAAAAAAAAAAAAAAAAAABBBBB
AAAAAAAAAAAAAAAAAAAAAABBBB
AAAAAAAAAAAAAAAAAAAAAAABBB
Suppose that the researcher randomly selects the assignment with the 13th measurement occasion as the start point of the B phase for the actual experiment: AAAAAAAAAAAABBBBBBBBBBBBBB. In a third step, the researcher chooses a test statistic that will be used to quantify the treatment effect. In this example, we will use the absolute difference between the baseline phase mean and the treatment phase mean as a test statistic. In a fourth step, the actual experiment with the randomly selected start point is conducted, and the data are recorded. Suppose that the recorded data of the experiment are 0, 2, 2, 3, 1, 3, 3, 2, 2, 2, 2, 2, 6, 7, 5, 8, 5, 6, 5, 7, 4, 6, 8, 5, 6, and 7. Figure 1 displays these hypothetical data graphically. In a fifth step, the researcher calculates the randomization distribution, which consists of the value of the test statistic for each of the possible assignments. The randomization distribution for the present example consists of 21 values (not all values are listed; the observed value is marked in bold):
AAABBBBBBBBBBBBBBBBBBBBBBB | 3.23 |
AAAABBBBBBBBBBBBBBBBBBBBBB | 2.89 |
. . . | . . . |
AAAAAAAAAAAABBBBBBBBBBBBBB | 4.07 |
. . . | . . . |
AAAAAAAAAAAAAAAAAAAAAABBBB | 2.73 |
AAAAAAAAAAAAAAAAAAAAAAABBB | 2.04 |

Data from a hypothetical AB design
In a final step, the researcher can calculate a two-sided p value for the observed test statistic by determining the proportion of test statistics in the randomization distribution that are at least as extreme as the observed test statistic. In this example, the observed test statistic is the most extreme value in the randomization distribution. Consequently, the p value is 1/21, or .0476. This p value can be interpreted as the probability of observing the data (or even more extreme data) under the null hypothesis that the outcome is unrelated to the levels of the independent variable. Note that the calculation of two-sided p values are preferable if the treatment effects can go in both directions. Alternatively, the randomization test can also be inverted, in order to obtain a nonparametric confidence interval of the observed treatment effect (Michiels et al., 2017). The benefit of calculating confidence intervals over p values is that the former conveys the same information as the latter, with the advantage of providing a range of “plausible values” for the test statistic in question (du Prel, Hommel, Röhrig, & Blettner, 2009).
The Type I error of the randomization test for randomized AB phase designs in the presence of unexpected linear trend
One way in which a maturation effect can manifest itself in an SCED is through a linear trend in the data. Such a linear trend could be the result of a sensitization or desensitization effect that occurs in the participant, yielding an unexpected upward or downward trend throughout the SCE that is totally unrelated to the experimental manipulation of the design. The presence of such an unexpected data trend can seriously diminish the power of hypothesis tests in which the null and alternative hypotheses are formulated in terms of differences in mean level between phases, to the point that they become useless. A convenient property of the start point randomization of the randomized AB phase design in conjunction with the RT analysis is that the RT offers nominal Type I error rate protection for data containing linear trends under the null hypothesis that there is no differential effect of the treatment on the A phase and the B phase observations. Before illustrating this property with a simple derivation, we will demonstrate that, in contrast to the RT, a two-sample t test greatly increases the probability of a Type I error for data with a linear trend. Suppose that we have a randomized AB phase design with ten measurement occasions (with five occasions in the A phase and five in the B phase). Suppose there is no intervention effect and we just have a general linear time trend (“maturation”):
A | A | A | A | A | B | B | B | B | B |
1 | 2 | 3 | 4 | 5 | 6 | 7 | 8 | 9 | 10 |
A t test on these data with a two-sided alternative hypothesis results in a t value of 5 for eight degrees of freedom, and a p value of .0011, indicating a statistically significant difference between the means at any conventional significance level. In contrast, an RT on these data produces a p value of 1, which is quite the opposite from a statistically significant treatment effect. The p value of 1 can be explained by looking at the randomization distribution for this particular example (assuming a minimum of three measurement occasions per case):
AAABBBBBBB | 5 |
AAAABBBBBB | 5 |
AAAAABBBBB | 5 |
AAAAAABBBB | 5 |
AAAAAAABBB | 5 |
The test statistic values for all randomizations are identical, leading to a maximum p value of 1. The result for the RT in this hypothetical example is reassuring, and it can be shown that the RT with differences between means as the test statistic guarantees Type I error rate control in the presence of linear trends, whereas the rejection rate of the t test increases dramatically with increasing numbers of measurement occasions.
The nominal Type I error rate protection of the RT in a randomized AB phase design for data containing a linear trend holds in a general way. If the null hypothesis is true, the data from a randomized AB phase design with a linear trend can be written as
with Yt being the dependent variable score at time t, β0 being the intercept, β1 being the slope of the linear trend, εt being the residual error, T being the time variable, and t being the time index. Assuming that the errors have a zero mean, the expected value for these data is
In a randomized AB phase design, these scores are divided between an A phase (\( {\widehat{Y}}_{\mathrm{At}} \)) and a B phase (\( {\widehat{Y}}_{\mathrm{Bt}} \)):
and with nA + nB = n. The mean of the expected A phase scores (\( {\widehat{\overline{Y}}}_{\mathrm{A}} \)) and the mean of the expected B phase scores (\( {\widehat{\overline{Y}}}_{\mathrm{B}} \)) are equal to
Consequently, the difference between \( {\widehat{\overline{Y}}}_{\mathrm{B}} \) and \( {\widehat{\overline{Y}}}_{\mathrm{A}} \) equals
which simplifies to
This derivation shows that, under the null hypothesis, \( {\widehat{\overline{Y}}}_{\mathrm{B}}-{\widehat{\overline{Y}}}_{\mathrm{A}} \) is expected to be a constant for every assignment of the randomized AB phase design. The expected difference between means, \( {\widehat{\overline{Y}}}_{\mathrm{B}}-{\widehat{\overline{Y}}}_{\mathrm{A}} \), is only a function of the slope of the linear trend, β1, and the total number of measurement occasions, n. This implies that the expected value of the test statistic for each random start point is identical if the null hypothesis is true, exactly what is needed for Type I error rate control. In contrast, the rejection rate of the t test will increase with increasing β1 and increasing n, because the difference between means constitutes the numerator of the t test statistic, and the test will only refer to Student’s t distribution with n – 2 degrees of freedom. The t test will therefore detect a difference between means that is merely the result of a general linear trend.
The result of this derivation can be further clarified by comparing the null hypotheses that are evaluated in both the RT and the t test. The null hypothesis of the t test states that there is no difference in means between the A phase observations and the B phase observations, whereas the null hypothesis of the RT states that there is no differential effect of the levels of the independent variable (i.e., the A and B observations) on the dependent variable. A data set with a perfect linear trend such as the one displayed above yields a mean level difference between the A phase observations and the B phase observations, but no differential effect between the A phase observations and the B phase observations (i.e., the trend effect is identical for both the A phase and the B phase observations). For this reason, the null hypothesis of the t test gets rejected, whereas the null hypothesis of the RT is not. Consequently, we can conclude that the RT is better suited for detecting unspecified treatment effects than is the t test, because its null hypothesis does not specify the nature of the treatment effect. Note that the t test, in contrast to the RT, assumes a normal distribution, homogeneity of variances, and independent errors, assumptions that are often implausible for SCED data. It is also worth noting that, with respect to the prevention of Type I errors, the RT also has a marked advantage over visual analysis, as the latter technique offers no way to prevent such errors when dealing with unexpected treatment effects. Consequently, we argue that statistical analysis using RTs is an essential technique for achieving valid conclusions from randomized AB phase designs.
The effect of unexpected linear trends on the power of the randomization test in randomized AB phase designs: a simulation study
In the previous section, we showed the validity of the randomized AB phase design and the RT with respect to the Type I error for data containing unexpected linear trends. Another criterion for the usability of the RT for specific types of data sets, apart from controlled Type I error rates, is adequate power. In this section we focus on the power of the RT in the randomized AB phase design when the data contain unexpected linear trends. Previous research has not yet examined the effect of unexpected linear data trends on the power of the RT in randomized AB phase designs. However, Solomon (2014) investigated the presence of linear trends in a large sample of published single-case research and found that the single-case data he surveyed were characterized by moderate levels of linear trend. As such, it is important to investigate the implications of unexpected data trends for the power of the RT in randomized AB phase designs.
When assessing the effect of linear trend on the power of the RT, we should make a distinction between the situation in which a data trend is expected and the situation in which a data trend is not expected. Edgington (1975b) proposed a specific type of RT for the former situation. More specifically, the proposed RT utilizes a test statistic that takes the predicted trend into account, in order to increase its statistical power. Using empirical data from completely randomized designs, Edgington (1975b) illustrated that such an RT can be quite powerful when the predicted trend is accurate. Similarly, a study by Levin, Ferron, and Gafurov (2017) showed that the power of the RT can be increased for treatment effects that are delayed and/or gradual in nature, by using adjusted test statistics that account for these types of effects. Of course, in many realistic research situations, data trends are either unexpected or are expected but cannot be accurately predicted. Therefore, we performed a Monte Carlo simulation study to investigate the effect of unexpected linear data trends on the power of the RT when it is used to assess treatment effects in randomized AB phase designs. A secondary goal was to provide guidelines for the number of measurement occasions to include in a randomized AB phase design, in order to achieve sufficient power for different types of data patterns containing trends and various treatment effect sizes. Following the guidelines by Cohen (1988), we defined “sufficient power” as a power of 80% or more.
Methods
The Monte Carlo simulation study contained the following factors: mean level change, a trend in the A phase, a trend in the B phase, autocorrelation in the residuals, and the number of measurement occasions for each data set. We used the model of Huitema and McKean (2000) to generate the data. This model uses the following regression equation:
with
Yt being the outcome at time t, with t = 1, 2, . . . , nA, nA+1, . . . , nA+nB,
nA being the number of observations in the A phase,
nB being the number of observations in the B phase,
β0 being the regression intercept,
Tt being the time variable that indicates the measurement occasions,
Dt being the value of the dummy variable indicating the treatment phase at time t,
[Tt – (nA+1)]Dt being the value of the slope change variable at time t,
β1 being the regression coefficient for the A phase trend,
β2 being the regression coefficient for the mean level treatment effect,
β*3 being the regression coefficient for the slope change variable, and
εt being the error at time t.
In this simulation study, we will sample εt from a standard normal distribution or from a first-order autoregressive model (AR1) model.
The A phase trend, the treatment effect, and the B phase slope change correspond to the β1, β2, and β*3 regression coefficients of the Huitema–McKean model, respectively. Note that β*3 of the Huitema–McKean model indicates the amount of slope change in the B phase relative to the A phase trend. For our simulation study, we defined a new parameter (denoted by β3) that indicates the value of the trend in the B phase independent of the level of trend in the A phase. The relation between β*3 and β3 can be written as follows: β3 = β*3 + β1. To include autocorrelation in the simulated data sets, the εts were generated from an AR1 model with different values for the AR parameter. Note that residuals with an autocorrelation of 0 are equivalent to the residuals from a standard normal distribution. The power of the RT was evaluated for two different measures of ES: an absolute mean difference statistic (MD) and an immediate treatment effect index (ITEI).
The MD is defined as
with \( \overline{A} \) being the mean of all A phase observations and \( \overline{B} \) being the mean of all B phase observations. The ITEI is defined as
with \( {\overline{A}}_{ITEI} \) being the mean of the last three A phase observations before the introduction of the treatment and \( {\overline{B}}_{ITEI} \) being the mean of the first three B phase observations after the introduction of the treatment. For each of the simulation factors, the following levels were used in the simulation study:
β1: 0, .25, .50
β2: – 4, – 1, 0, 1, 4
β3: – .50, – .25, 0, .25, .50
AR1: – .6, – .3, 0, .3, .6.
N: 30, 60, 90, 120
ES: MD, ITEI
The β1 and β3 values were based on a survey by Solomon (2014), who calculated trend values through linear regression for a large number of single-case studies. A random-effects meta-analysis showed that the mean standardized trend regression weight for all analyzed data was .37, with a 95% confidence interval of [.28 ; .43]. On the basis of these results, we defined a “small” trend as a standardized regression weight of .25 and a “large” trend as a standardized regression weight of .50. Note that we included upward trends (i.e., β3 values with a positive sign) as well as downward trends in the B phase (i.e., β3 with a negative sign), in order to account for data patterns with A phase trends and B phase trends that go in opposite directions. It was not necessary to also include downward trends in the A phase, because this would lead to some data patterns being just mirror images (when only the direction of the A phase trend as compared to the B phase trend was considered) in the full factorial crossing of all included parameter values. The full factorial combination of these three β1 values and five β3 values resulted in 15 different data patterns containing an A phase trend and/or a B phase trend. Table 1 provides an overview of these 15 data patterns, and Fig. 2 illustrates the data patterns visually. Note that the data patterns in Fig. 2 only serve to illustrate the described A phase trends and/or B phase trends, as these patterns do not contain any data variability nor a mean level treatment effect. Hereafter, we will use the numbering in Table 1 to refer to each of the 15 data patterns individually.
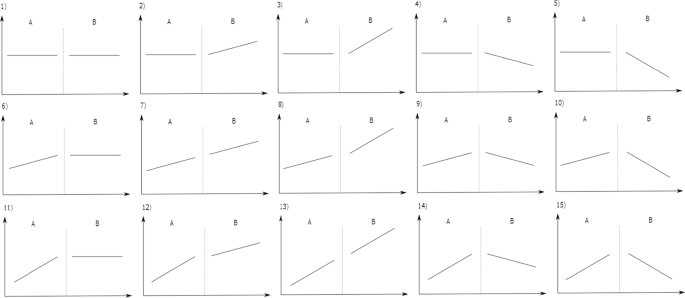
Fifteen AB data patterns containing an A phase trend and/or a B phase trend
The values for β2 were based on the standardized treatment effects reported by Harrington and Velicer (2015), who used interrupted time series analyses on a large number of empirical single-case data sets published in the Journal of Applied Behavioral Analysis. The Huitema–McKean model is identical to the interrupted time series model of Harrington and Velicer when the autoregressive parameter of the latter model is zero. We collected the d values (which correspond to standardized β2 values in the Huitema–McKean model) reported in Table 1 of Harrington and Velicer’s study, and defined β2 = 1 as a “small” treatment effect and β2 = 4 as a “large” treatment effect. These values were the 34th and 84th percentiles of the empirical d distribution, respectively. The AR1 parameter values were based on a survey by Solomon (2014), who reported a mean absolute autocorrelation of .36 across a large number of single-case data sets. On the basis of this value, we defined .3 as a realistic AR1 parameter value. To obtain an additional “bad case scenario” condition with respect to autocorrelation, we doubled the empirical value of .3. Both the AR1 values of .3 and .6 were included with negative and positive signs in the simulation study, in order to assess the effects of both negative and positive autocorrelation. The numbers of measurement occasions of the simulated data sets were either 30, 60, 90, or 120. We chose a lower limit of 30 measurement occasions because this is the minimum number of measurement occasions that is needed in a randomized AB phase design with at least five measurement occasions in each phase to achieve a p value equal to .05 or smaller. The upper limit of 120 measurement occasions was chosen on the basis of a survey by Harrington and Velicer that showed that SCEDs rarely contain more than 120 measurement occasions.
The ES measures used in this simulation study are designed to quantify two important aspects of evaluating treatment effects of single-case data, according to the recommendations of the What Works Clearinghouse (WWC) Single-Case Design Standards (Kratochwill et al., 2010). The first aspect is the overall difference in level between phases, which we quantified using the absolute mean difference between all A phase observations and all B phase observations. Another important indicator for treatment effectiveness in randomized AB phase designs is the immediacy of the treatment effect (Kratochwill et al., 2010). For this aspect of the data, we calculated an immediate treatment effect index (ITEI). On the basis of the recommendation by Kratochwill et al., we defined the ITEI in a randomized AB phase design as the average difference between the last three A observations and the first three B observations. Both ESs were used as the test statistic in the RT for this simulation study. In accordance with the WWC standards’ recommendation that a “phase” should consist of five or more measurement occasions (Kratochwill et al., 2010), we took a minimum limit of five measurement occasions per phase into account for the start point randomization in the RT. A full factorial crossing of all six simulation factors yielded 3,750 simulation conditions. The statistical power of the RT for each condition was calculated by generating 1,000 data sets and calculating the proportion of rejected null hypotheses at a 5% significance level across these 1,000 replications.
Results
The results will be presented in two parts. To evaluate the effect of the simulation factors on the power of the RT, we will present the main effects of each simulation factor. Apart from a descriptive analysis of the statistical power in the simulation conditions, we will also look at the variation between conditions using a multiway analysis of variance (ANOVA). We will limit the ANOVA to main effects because the interaction effects between the simulation factors were small and difficult to interpret. For each main effect, we will calculate eta-squared (η2) in order to identify the most important determinants of the results. Second, we will report the power for each specific AB data pattern that was included in the simulation study for both the MD and the ITEI.
Main effects
The results from the multiway ANOVA indicated that all simulation factors had a statistically significant effect on the power of the RT at the .001 significance level. Table 2 displays the η2 values for the main effect of each simulation factor, indicating the relative importance of these factors in determining the power of the RT, in descending order.
Table 2 shows that by far the largest amount of variance was explained by the size of the treatment effect (β2). Of course, this result is to be expected, because the size of the treatment effect ranged from 0 to 4 (in absolute value), which is a very large difference. The large amount of variance explained by the treatment effect size also accounts for the large standard deviations for the power levels of the other main effects (displayed in Tables 4–8 in the Appendix). To visualize the effect of the simulation factors on the RT’s power, we plotted the effect of each simulation factor in interaction with the size of the treatment effect (β2) while averaging the power across all other simulation factors in the simulation study in Fig. 3. The means and standard deviations of the levels of the main effect for each experimental factor (averaged across all other simulation factors, including the size of the treatment effect) can be found in Tables 4–8 in the Appendix.

Effects of the simulation factors of the simulation study in interaction with the size of the treatment effect: (1) the number of measurement occasions, (2) the level of autocorrelation, (3) the A phase trend, (4) the B phase trend, and (5) the test statistic used in the randomization test. The proportions of rejections for the conditions in which the treatment effect is zero are the Type I error rates. N = number of measurement occasions, AR = autoregression parameter, β1 = A phase trend regression parameter, β3 = B phase trend regression parameter, ES = effect size measure
Panels 1–5 in Fig. 3 show the main effects of the number of measurement occasions, the level of autocorrelation, the size of the A phase trend, the size of the B phase trend, and the effect size measure used, respectively, on the power of the RT. We will summarize the results concerning the main effects for each of these experimental factors in turn.
Number of measurement occasions
Apart from the obvious result that an increase in the number of measurement occasions increases the power of the RT, we can also see that the largest substantial increase in average power occurs when increasing the number of measurement occasions from 30 to 60. In contrast, increasing the number of measurement occasions from 60 to 90, or even from 90 to 120, yields only very small increases in average power.
Level of autocorrelation
The main result for this experimental factor is that the presence of positive autocorrelation in the data decreases the power, whereas the presence of negative autocorrelation increases the power. However, Table 2 shows that the magnitude of this effect is relatively small as compared to the other effects in the simulation study.
Effect size measure
The results show that the ITEI on average yields larger power than does the MD for the types of data patterns that were used in this simulation study.
A phase trend (β1)
On average, the power of the randomized AB phase design is reduced when there is an A phase trend in the data, and this reduction increases when the A phase trend gets larger.
B phase trend (β3)
The presence of B phase trend in the data reduces the power of the RT, as compared to data without a B phase trend. In addition, the power reduction increases as the B phase trend gets larger. Furthermore, the increase in the reduction of power is larger for downward B phase trends than for upward B phase trends for data that also contain an upward A phase trend. Because the A phase trends in this simulation study were all upward trends, we can conclude that the power reduction associated with the presence of B phase trend is larger when the B phase trend has a direction opposite the direction of the A phase trend than in the situation in which both trends have the same direction. Similarly, it is also evident across all panels of Fig. 3 that the power of the RT is lower for treatment effects that have a direction opposite to the direction of the A phase trend.
Finally, the conditions in Fig. 3 in which the treatment effect is zero show that the manipulation of each experimental factor did not inflate the Type I error rate of the RT above the nominal significance level. However, this result is to be expected, as the RT provides guaranteed nominal Type I error control.
Trend patterns
In this section we will discuss the power differences between the different types of data patterns in the simulation study. In addition, we will pay specific attention to the differences between the MD and the ITEI in the different data patterns, as the ES measure that was used in the RT was the experimental factor that explained the most variance in the ANOVA apart from the size of the treatment effect. Figure 4a contains the power graphs for Data Patterns 1–5, Fig. 4b contains the power graphs for Data Patterns 6–10, and Fig. 4c contains the power graphs for Data Patterns 11–15.
- 1.
Data patterns with no A phase trend (Data Patterns 1–5): The most important results regarding Data Patterns 1–5 can be summarized in the following bullet points:
For data patterns without any trend (Data Pattern 1), the average powers of the MD and the ITEI are similar.
The average power of the ITEI is substantially larger than the average power of the MD for data patterns with any type of B phase trend (Data Patterns 2–5).
Comparison of Data Patterns 2 and 3 shows that the average power advantage of the ITEI as compared to the MD in data patterns with an upward B phase trend increases as the B phase trend grows larger.
The average power of the MD in Data Patterns 2–5 is very low.
The average power graphs for Data Patterns 1–5 are symmetrical, which means that the results for negative and positive mean level treatment effects are similar.
- 2.
Data patterns with an A phase trend of .25 (Data Patterns 6–10):
For all five of these data patterns, the ITEI has a large average power advantage as compared to the MD, for both positive and negative treatment effects.
The average powers of both the ITEI and the MD are higher when the treatment effect has the same direction as the A phase trend, as compared to when the effects go in opposite directions.
The average power difference between the MD and the ITEI is larger when the A phase trend and the treatment effect go in opposite directions than when they have the same direction.
When the A phase trend and the B phase trend have the same value (Data Pattern 7), the average power advantage of the ITEI relative to the MD disappears, but only for positive treatment effects.
The average power of the MD is extremely low in nearly all data patterns.
- 3.
Data patterns with an A phase trend of .50 (Data Patterns 11–15):
In comparison to Data Patterns 6–10, the overall average power drops due to the increased size of the A phase trend (for both the ITEI and the MD and for both positive and negative treatment effects).
For all five data patterns, the ITEI has a large average power advantage over the MD, for both positive and negative treatment effects.
When the A phase trend and the B phase trend have the same value (Data Pattern 13), the average power advantage of the ITEI relative to the MD disappears, but only for positive treatment effects.
The average power of the MD is extremely low for all types of treatment effects in all data patterns (except for Data Pattern 13). In contrast, the ITEI still has substantial average power, but only for positive treatment effects.


a Power graphs for the five AB data patterns without an A phase trend. β1 and β3 represent the trends in the A and B phases, respectively. b Power graphs for the five AB data patterns with an upward A phase trend of .25. β1 and β3 represent the trends in the A and B phases, respectively. c Power graphs for the five AB data patterns with an upward A phase trend of .5. β1 and β3 represent the trends in the A and B phases, respectively
The most important results regarding differences between the individual data patterns and between the MD and the ITEI can be summarized as follows:
The presence of A phase trend and/or B phase trend in the data decreases the power of the RT, as compared to data without such trends, and the decrease is proportional to the magnitude of the trend.
Treatment effects that go in the same direction as the A phase trend can be detected with higher power than treatment effects that go in the opposite direction from the A phase trend.
The ITEI yields higher power than does the MD in data sets with trends, especially for large trends and trends that have a direction opposite from the direction of the treatment effect.
An additional result regarding the magnitude of the power in the simulation study is that none of the conditions using 30 measurement occasions reached a power of 80% or more. Also, all conditions that reached a power of 80% or more contained large treatment effects (β2 = 4). The analysis of the main effects showed that designs with 90 or 120 measurement occasions only yielded very small increases in power as compared to designs with 60 measurement occasions. Table 3 contains an overview of the average powers for large positive and large negative mean level treatment effects (β2 = |4|) for each of the 15 different data patterns with 60 measurement occasions, for both the MD and the ITEI (averaged over the levels of autocorrelation in the data).
Upon inspecting Table 3, one can see that for detecting differences in mean level (i.e., the simulation conditions using the MD as the test statistic), the randomized AB phase design only has sufficient power for data patterns without any trend (Data Pattern 1) or for data patterns in which the A phase trend and the B phase trend are equal (Data Patterns 7 and 13) and in which the treatment effect is in the same direction as the A phase trend. With respect to detecting immediate treatment effects, one can see that the randomized AB phase design had sufficient power for all the data patterns with no A phase trend included in the simulation study, provided that the treatment effect was large (Data Patterns 1–5). For data patterns with A phase trend, the randomized AB phase design also has sufficient power, provided that the treatment effect is in the same direction as the A phase trend. When the treatment effect is in the opposite direction from the A phase trend, the randomized AB phase design only has sufficient power when both the A phase trend and the B phase trend are small (Data Patterns 6, 7, and 9). It is also important to note that the RT only has sufficient power for large treatment effects.
Discussion and future research
In this article we have argued that randomized AB phase designs are an important part of the methodological toolbox of the single-case researcher. We discussed the advantages and disadvantages of these designs in comparison with more complex phase designs, such as ABA and ABAB designs. In addition, we mentioned some common data-analytical pitfalls when analyzing randomized AB phase designs and discussed how the RT as a data-analytical technique can lessen the impact of some of these pitfalls. We demonstrated the validity of the RT in randomized AB phase designs containing unexpected linear trends and investigated the implications of unexpected linear data trends for the power of the RT in randomized AB phase designs. To cover a large number of potential empirical data patterns with linear trends, we used the model of Huitema and McKean (2000) for generating data sets. The power was assessed for both the absolute mean phase difference (MD, designed to evaluate differences in level) and the immediate treatment effect index (ITEI, designed to evaluate the immediacy of the effect) as the test statistic in the RT. In addition, the effect of autocorrelation on the power of the RT in randomized AB phase designs was investigated by incorporating residual errors with different levels of autocorrelation into the Huitema–McKean model.
The results showed that the presence of any combination of A phase trend and/or B phase trend reduced the power of the RT in comparison to data patterns without trend. In addition, the results showed that the ITEI yielded substantially higher power in the RT than did the MD for randomized AB phase designs containing linear trend. Autocorrelation only had a small effect on the power of the RT, with positive autocorrelation diminishing the power of the RT and negative autocorrelation increasing its power. Furthermore, the results showed that none of the conditions using 30 measurement occasions reached a power of 80% or more. However, the power increased dramatically when the number of measurement occasions was increased to 60. The main effect of number of measurement occasions showed that the power of randomized AB phase designs with 60 measurement occasions hardly benefits from an increase to 90 or even 120 measurement occasions.
The overarching message of this article is that the randomized AB phase design is a potentially valid experimental design. More specifically, the use of repeated measurements, a deliberate experimental manipulation, and random assignment all increase the probability that a valid inference regarding the treatment effect of an intervention for a single entity can be made. In this respect, it should be noted that the internal validity of an experimental design is also dependent on all plausible rival hypotheses, and that it is difficult to make general statements regarding the validity of a design, regardless of the research context. As such, we recommend that single-case researchers should not reject randomized AB phase designs out of hand, but consider how such designs can be used in a valid manner for their specific purposes.
The results from this simulation study showed that the randomized AB phase design has relatively low power: A power of 80% or more is only reached when treatment effects are large and the design contains a substantial number of measurement occasions. These results echo the conclusions of Onghena (1992), who investigated the power of randomized AB phase designs for data without trend or autocorrelation. That being said, this simulation study also showed that it is possible to achieve a power of 80% or more for specific data patterns containing unexpected linear trends and/or autocorrelation, at least for large effect sizes.
One possibility for increasing the power of the RT for data sets with trends may be the use of adjusted test statistics that accurately predict the trend (Edgington, 1975b; Levin et al., 2017). Rather than predicting the trend before the data are collected, another option might be to specify an adjusted test statistic after data collection using masked graphs (Ferron & Foster-Johnson, 1998).
Recommendations with regard to an appropriate number of measurement occasions for conducting randomized AB phase designs should be made cautiously, for several reasons. First, the manipulation of the treatment effect in this simulation study was very large and accounted for most of the variability in the power. Consequently, the expected size of the treatment effect is an important factor in selecting the number of measurement occasions for the randomized AB phase design. Of course, the size of the treatment effect cannot be known beforehand, but it is plausible that effect size magnitudes vary depending on the specific domain of application. Second, we did not investigate possible interactions between the various experimental factors, because these would be very difficult to interpret. However, these potential interactions might have an effect on the power of different types of data patterns, making it more difficult to formulate general recommendations. Taking the previous disclaimers into account, we can state that randomized AB phase designs in any case should contain more than 30 measurement occasions to achieve adequate power. Note that Shadish and Sullivan (2011) reported that across a survey of 809 published SCEDs, the median number of measurement occasions was 20, and that 90.6% of the included SCEDs had fewer than 50 data points. It is possible that randomized AB phase designs with fewer than 60 measurement occasions may also have sufficient power in specific conditions we simulated, but we cannot verify this on the basis of the present results. As we previously mentioned, we do not recommend implementing randomized AB phase designs with more than 60 measurement occasions, since the extra practical burden this entails does not outweigh the very small increase in power it yields.
Although we advocate the use of randomization in SCEDs, readers should note that some authors oppose to this practice, as well as the use of RTs, because it conflicts with response-guided experimentation (Joo, Ferron, Beretvas, Moeyaert, & Van den Noortgate, 2017; Kazdin, 1980). According to this approach, decisions to implement, withdraw, or alter treatments are often based on the observed data patterns during the course of the experiment (e.g., starting the treatment only after the baseline phase has stabilized). Response-guided experimentation conflicts with the use of RTs, because RTs require prespecifying the start of the treatment in a random fashion. In response to this criticism, Edgington (1980) proposed an RT in which only part of the measurement occasions of the SCE are randomized, thus giving the researcher control over the nonrandomized part.
Some additional remarks concerning the present simulation study are in order. First, although this simulation study showed that the randomized AB phase design has relatively low power, we should mention that multiple randomized AB phase designs can be combined in a multiple-baseline, across-participant design that increases the power of the RT considerably (Onghena & Edgington, 2005). More specifically, a simulation study has shown that under most conditions, the power to detect a standardized treatment effect of 1.5 for designs with four participants and a total of 20 measurement occasions per participant is already 80% or more (Ferron & Sentovich, 2002). A more recent simulation study by Levin, Ferron, and Gafurov (2018) investigating several different randomization test procedures for multiple-baseline designs showed similar results. Another option to obtain phase designs with more statistical power would be to extend the basic AB phase design to an ABA or ABAB design. Onghena (1992) has developed an appropriate randomization test for such extended phase designs.
Second, it is important to realize that the MD and ITEI analyses used in this simulation study quantify two different aspects of the difference between the phases. The MD aims to quantify overall level differences between the A phase and the B phase, whereas the ITEI aims to quantify the immediate treatment effect after the implementation of the treatment. The fact that the power of the RT in randomized AB phase designs is generally higher for the ITEI than for the MD indicates that the randomized AB phase design is mostly sensitive to immediate changes in the dependent variable after the treatment has started. Kratochwill et al. (2010) argued that immediate treatment effects are more reliable indicators of a functional relation between the outcome variable and the treatment than are gradual or delayed treatment effects. In this sense, the use of a randomized AB phase design is appropriate to detect such immediate treatment effects.
Third, in this article we assumed a research situation in which a researcher is interested in analyzing immediate treatment effects and differences in mean level, but in which unexpected linear trends in the data hamper such analyses. In this context it is important to mention that over the years multiple proposals have been made concerning how to deal with the presence of trends in the statistical analysis of single-case data. These proposals include RTs for predicted trends (Edgington, 1975b), calculating measures of ES that control for trend (e.g., the percentage of data points exceeding the baseline median; Ma, 2006), calculating ESs that incorporate the trend into the treatment effect itself (e.g., Tau-U; Parker, Vannest, Davis, & Sauber, 2011), and quantifying trend separately from a mean level shift effect, which is an approach adopted by most regression-based techniques (e.g., Allison & Gorman, 1993; Van den Noortgate & Onghena, 2003), and also by slope and level change (SLC; Solanas et al., 2010), which is a nonparametric technique to isolate the trend from the mean level shift effect in SCEDs. The possibilities to deal with trends in single-case data are numerous and beyond of the scope of the present article.
The present study has a few limitations that we will now mention. First of all, the results and conclusions of this simulation study are obviously limited to the simulation conditions that were included. Because we simulated a large number of data patterns, we had to compromise on the number of levels of some simulation factors in order to keep the simulation study computationally manageable. For example, we only used three different treatment effect sizes (in absolute value) and four different numbers of measurement occasions. Moreover, the incremental differences between the different values of these factors were quite large. Second, this simulation study only considered the 15 previously mentioned data patterns generated from the Huitema–McKean model, featuring constant and immediate treatment effects and linear trends. We did not simulate data patterns with delayed or gradual treatment effects or nonlinear trends. An interesting avenue for future research would be to extend the present simulation study to delayed and/or gradual treatment effects and nonlinear trends. Third, in this simulation study we only investigated randomized AB phase designs. Future simulation studies could investigate the effect of unexpected trends in more complex phase designs, such as ABA and ABAB designs or multiple-baseline designs. Fourth, we only used test statistics designed to evaluate two aspects of single-case data: level differences and the immediacy of the effect. Although these are important indicators of treatment effectiveness, other aspects of the data might provide additional information regarding treatment efficacy. More specifically, data aspects such as variability, nonoverlap, and consistency of the treatment effect must also be evaluated in order to achieve a fuller understanding of the data (Kratochwill et al., 2010). In this light, more research needs to be done evaluating the power of the RT using test statistics designed to quantify trend, variability, and consistency across phases. Future research could focus on devising an RT test battery consisting of multiple RTs with different test statistics, each aimed at quantifying a different aspect of the data at hand. In such a scenario, the Type I error rate across multiple RTs could be controlled at the nominal level using multiple testing corrections. A final limitation of this simulation study is that the data were generated using a random-sampling model with the assumption of normally distributed errors. It is also possible to evaluate the power of the RT in a random assignment model (cf. conditional power; Keller, 2012; Michiels et al., 2018). Future research could investigate whether the results of the present simulation study would still hold in a conditional power framework.
Conclusion
The AB phase design has been commonly dismissed as inadequate for research purposes because it allegedly cannot control for maturation and history effects. However this blanket dismissal of AB phase designs fails to discern between randomized and nonrandomized versions of the design. The present article has demonstrated that the randomized AB phase design is a potentially internally valid experimental design that can be used for assessing the effect of a treatment in a single participant when the treatment is irreversible or cannot be withdrawn due to ethical reasons. We showed that randomized AB phase designs can be analyzed with randomization tests to assess the statistical significance of the mean level changes and immediate changes in the outcome variable by using appropriate test statistics for each type of effect. The results of a simulation study showed that the power with which mean level changes and immediate changes can be evaluated depends on the specific type of data pattern that is analyzed. We concluded that for nearly every data pattern in this simulation study that included an upward A phase trend, a positive treatment effect, and/or a downward or upward B phase trend, it was possible to detect immediate treatment effects with sufficient power using the RT. In any case, randomized AB phase designs should contain more than 30 measurement occasions to provide adequate power in the RT. Researchers should be aware that the randomized AB phase design generally has low power, even for large sample sizes. For this reason, we recommend that researchers use single-case phase designs with more power (such as randomized multiple-baseline designs or a serially replicated randomized AB phase design) whenever possible, as they have a higher statistical-conclusion validity. When an AB phase design is the only feasible option, researchers should consider the benefits of randomly determining the intervention point. It is far better to perform the randomized AB phase design, which can provide tentative information about a treatment effect, than not to perform an SCED study at all.
References
Allison, D. B., & Gorman, B. S. (1993). Calculating effect sizes for meta-analysis: The case of the single case. Behaviour Research and Therapy, 31, 621–631.
Alnahdi, G. H. (2015). Single-subject design in special education: Advantages and limitations. Journal of Research in Special Educational Needs, 15, 257–265.
Barlow, D. H., & Hayes, S. C. (1979). Alternating treatments design: One strategy foßr comparing the effects of two treatments in a single subject. Journal of Applied Behavior Analysis, 12, 199–210.
Barlow, D. H., Nock, M. K., & Hersen, M. (2009). Single case experimental designs: Strategies for studying behavior change (3rd ed.). Boston, MA: Pearson.
Bobrovitz, C. D., & Ottenbacher, K. J. (1998). Comparison of visual inspection and statistical analysis of single-subject data in rehabilitation research. American Journal of Physical Medicine and Rehabilitation 77, 94–102.
Borckardt, J. J., & Nash, M. R. (2014). Simulation modelling analysis for small sets of single-subject data collected over time. Neuropsychological Rehabilitation, 24, 492–506.
Bulté, I., & Onghena, P. (2008). An R package for single-case randomization tests. Behavior Research Methods, 40, 467–478. https://doi.org/10.3758/BRM.40.2.467
Busk, P. L., & Serlin, R. C. (1992). Meta-analysis for single-case research. In T. R. Kratochwill, J. R. Levin (Eds.), Single-case research design and analysis: New directions for psychology and education (pp. 187–212). Hillsdale, NJ: Erlbaum.
Campbell, D. T. (1969). Reforms as experiments. American Psychologist, 24, 409–429. https://doi.org/10.1037/h0027982
Campbell, D. T., & Stanley, J. C. (1966). Experimental and quasi- experimental designs for research. Boston, MA: Houghton Mifflin.
Chambless, D. L., & Ollendick, T. H. (2001). Empirically supported psychological interventions: Controversies and evidence. Annual Review of Psychology, 52, 685–716.
Cohen, J. (1988). Statistical power analysis for the behavioral sciences (2nd ed.). Hillsdale, NJ: Erlbaum.
Cook, T. D., & Campbell, D. T. (1979). Quasi-experimentation: Design and analysis issues for field settings. Chicago, IL: Rand McNally.
de Vries, R. M., & Morey, R. D. (2013). Bayesian hypothesis testing for single-subject designs. Psychological Methods, 18, 165–185. https://doi.org/10.1037/a0031037
du Prel, J., Hommel, G., Röhrig, B., & Blettner, M. (2009). Confidence interval or p-value? Deutsches Ärzteblatt International, 106, 335–339.
Dugard, P. (2014). Randomization tests: A new gold standard? Journal of Contextual Behavioral Science, 3, 65–68.
Dugard, P., File, P., & Todman, J. (2012). Single-case and small-n experimental designs: A practical guide to randomization tests (2nd ed.). New York, NY: Routledge.
Edgington, E. S. (1967). Statistical inference from N = 1 experiments. Journal of Psychology, 65, 195–199.
Edgington, E. S. (1975a). Randomization tests for one-subject operant experiments. Journal of Psychology, 90, 57–68.
Edgington, E. S. (1975b). Randomization tests for predicted trends. Canadian Psychological Review, 16, 49–53.
Edgington, E. S. (1980). Overcoming obstacles to single-subject experimentation. Journal of Educational Statistics, 5, 261–267.
Edgington, E. S. (1996). Randomized single-subject experimental designs. Behaviour Research and Therapy, 34, 567–574.
Edgington, E. S., & Onghena, P. (2007). Randomization tests (4th ed.). Boca Raton, FL: Chapman & Hall/CRC.
Ferron, J., & Foster-Johnson, L. (1998). Analyzing single-case data with visually guided randomization tests. Behavior Research Methods, Instruments, & Computers, 30, 698–706. https://doi.org/10.3758/BF03209489
Ferron, J., & Onghena, P. (1996). The power of randomization tests for single-case phase designs. Journal of Experimental Education, 64, 231–239.
Ferron, J., & Sentovich, C. (2002). Statistical power of randomization tests used with multiple-baseline designs. Journal of Experimental Education, 70, 165–178.
Ferron, J., & Ware, W. (1995). Analyzing single-case data: The power of randomization tests. Journal of Experimental Education, 63, 167–178.
Gabler, N. B., Duan, N., Vohra, S., & Kravitz, R. L. (2011). N-of-1 trials in the medical literature: A systematic review. Medical Care, 49, 761–768.
Gast, D.L., & Ledford, J.R. (2014). Single case research methodology: Applications in special education and behavioral sciences (2nd ed.).New York, NY: Routledge.
Gottman, J. M., & Glass, G. V. (1978). Analysis of interrupted time-series experiments. In T. R. Kratochwill (Ed.), Single-subject research: Strategies for evaluating change (pp. 197–237). New York, NY: Academic Press.
Hammond, D., & Gast, D. L. (2010). Descriptive analysis of single-subject research designs: 1983–2007. Education and Training in Autism and Developmental Disabilities, 45, 187–202.
Harrington, M., & Velicer, W. F. (2015). Comparing visual and statistical analysis in single-case studies using published studies. Multivariate Behavioral Research, 50, 162–183.
Harris, F. N., & Jenson, W. R. (1985). Comparisons of multiple- baseline across persons designs and AB designs with replications: Issues and confusions. Behavioral Assessment, 7, 121–127.
Harvey, M. T., May, M. E., & Kennedy, C. H. (2004). Nonconcurrent multiple baseline designs and the evaluation of educational systems. Journal of Behavioral Education, 13, 267–276.
Hedges, L. V., Pustejovsky, J. E., & Shadish, W. R. (2012). A standardized mean difference effect size for single case designs. Research Synthesis Methods, 3, 324–239.
Heyvaert, M., Moeyaert, M.,Verkempynck, P., Van den Noortgate, W., Vervloet, M., Ugille M., & Onghena, P. (2017). Testing the intervention effect in single-case experiments: A Monte Carlo simulation study. Journal of Experimental Education, 85, 175–196.
Heyvaert, M., & Onghena, P. (2014). Analysis of single-case data: Randomisation tests for measures of effect size. Neuropsychological Rehabilitation, 24, 507–527.
Heyvaert, M., Wendt, O., Van den Noortgate, W., & Onghena, P. (2015). Randomization and data-analysis items in quality standards for single-case experimental studies. Journal of Special Education, 49, 146–156.
Horner, R. H., Swaminathan, H., Sugai, G., & Smolkowski, K. (2012). Considerations for the systematic analysis and use of single-case research. Education & Treatment of Children, 35, 269–290.
Huitema, B. E., & McKean, J. W. (2000). Design specification issues in time- series intervention models. Educational and Psychological Measurement, 60, 38–58.
Joo, S.-H., Ferron, J. M., Beretvas, S. N., Moeyaert, M., & Van den Noortgate, W. (2017). The impact of response-guided baseline phase extensions on treatment effect estimates. Research in Developmental Disabilities. https://doi.org/10.1016/j.ridd.2017.12.018
Kazdin, A. E. (1980). Obstacles in using randomization tests in single-case experimentation. Journal of Educational Statistics, 5, 253–260.
Kazdin, A. E. (2011). Single-case research designs: Methods for clinical and applied settings (2nd ed.). New York, NY: Oxford University Press.
Keller, B. (2012). Detecting treatment effects with small samples: The power of some tests under the randomization model. Psychometrika, 2, 324–338.
Kratochwill, T. R., Hitchcock, J., Horner, R. H., Levin, J. R., Odom, S. L., Rindskopf, D. M., & Shadish, W. R. (2010). Single-case designs technical documentation. Retrieved from the What Works Clearinghouse website: http://ies.ed.gov/ncee/wwc/pdf/wwc_scd.pdf.
Kratochwill, T. R., & Levin, J. R. (2010). Enhancing the scientific credibility of single-case intervention research: Randomization to the rescue. Psychological Methods, 15, 124–144. https://doi.org/10.1037/a0017736
Kratochwill, T. R., & Stoiber, K. C. (2000). Empirically supported interventions and school psychology: Conceptual and practical issues: Part II. School Psychology Quarterly, 15, 233–253.
Leong, H. M., Carter, M., & Stephenson, J. (2015). Systematic review of sensory integration therapy for individuals with disabilities: Single case design studies. Research in Developmental Disabilities, 47, 334–351.
Levin, J. R., Ferron, J. M., & Gafurov, B. S. (2014). Improved randomization tests for a class of single-case intervention designs. Journal of Modern Applied Statistical Methods, 13, 2–52.
Levin, J. R., Ferron, J. M., & Gafurov, B. S. (2017). Additional comparisons of randomization-test procedures for single-case multiple-baseline designs: Alternative effect types. Journal of School Psychology, 63, 13–34.
Levin, J. R., Ferron, J. M., & Gafurov, B. S. (2018). Comparison of randomization-test procedures for single-case multiple-baseline designs. Developmental Neurorehabilitation, 21, 290–311. https://doi.org/10.1080/17518423.2016.1197708
Levin, J. R., Ferron, J. M., & Kratochwill, T. R. (2012). Nonparametric statistical tests for single-case systematic and randomized ABAB … AB and alternating treatment intervention designs: New developments, new directions. Journal of School Psychology, 50, 599–624.
Logan, L. R., Hickman, R. R., Harris, S. R., & Heriza, C. B. (2008). Single-subject research design: Recommendations for levels of evidence and quality rating. Developmental Medicine and Child Neurology, 50, 99–103.
Ma, H. H. (2006). An alternative method for quantitative synthesis of single-subject research: Percentage of data points exceeding the median. Behavior Modification, 30, 598–617.
Manolov, R., & Onghena, P. (2017). Analyzing data from single-case alternating treatments designs. Psychological Methods. Advance online publication. https://doi.org/10.1037/met0000133
Mansell, J. (1982). Repeated direct replication of AB designs. Journal of Behavior Therapy and Experimental Psychiatry, 13, 261–262.
Michiels, B., Heyvaert, M., Meulders, A., & Onghena, P. (2017). Confidence intervals for single-case effect size measures based on randomization test inversion. Behavior Research Methods, 49, 363–381. https://doi.org/10.3758/s13428-016-0714-4
Michiels, B., Heyvaert, M., & Onghena, P. (2018). The conditional power of randomization tests for single-case effect sizes in designs with randomized treatment order: A Monte Carlo simulation study. Behavior Research Methods, 50, 557–575. https://doi.org/10.3758/s13428-017-0885-7
Michiels, B., & Onghena, P. (2018). Nonparametric meta-analysis for single-case research: Confidence intervals for combined effect sizes. Behavior Research Methods. https://doi.org/10.3758/s13428-018-1044-5
Onghena, P. (1992). Randomization tests for extensions and variations of ABAB single-case experimental designs: A rejoinder. Behavioral Assessment, 14, 153–171.
Onghena, P. (2005). Single-case designs. In B. Everitt & D. Howell (Eds.), Encyclopedia of statistics in behavioral science (Vol. 4, pp. 1850–1854). Chichester, UK: Wiley.
Onghena, P., & Edgington, E. S. (1994). Randomization tests for restricted alternating treatments designs. Behaviour Research and Therapy, 32, 783–786.
Onghena, P., & Edgington, E. S. (2005). Customization of pain treatments: Single-case design and analysis. Clinical Journal of Pain, 21, 56–68.
Onghena, P., Vlaeyen, J. W. S., & de Jong, J. (2007). Randomized replicated single-case experiments: Treatment of pain-related fear by graded exposure in vivo. In S. Sawilowsky (Ed.), Real data analysis (pp. 387–396). Charlotte, NC: Information Age.
Parker, R. I., Vannest, K. J., & Davis, J. L. (2011). Effect size in single-case research: a review of nine nonoverlap techniques. Behavior Modification, 35, 303–322.
Parker, R. I., Vannest, K. J., Davis, J. L., & Sauber, S. B. (2011). Combining nonoverlap and trend for single-case research: Tau-U. Behavior Therapy, 42, 284–299.
Rindskopf, D. (2014). Nonlinear Bayesian analysis for single case designs. Journal of School Psychology, 52, 179–189.
Rindskopf, D., Shadish, W. R., & Hedges, L. V. (2012). A simple effect size estimator for single-case designs using WinBUGS. Washington DC: Society for Research on Educational Effectiveness.
Rvachew, S., & Matthews, T. (2017). Demonstrating treatment efficacy using the single subject randomization design: A tutorial and demonstration. Journal of Communication Disorders, 67, 1–13.
Shadish, W. R., Cook, T. D., & Campbell, D. T. (2002). Experimental and quasi-experimental designs for generalized causal inference. New York, NY: Houghton Mifflin.
Shadish, W. R., Rindskopf, D. M., & Hedges, L. V. (2008). The state of the science in the meta-analysis of single-case experimental designs. Evidence-Based Communication Assessment and Intervention, 2, 188–196.
Shadish, W. R., & Sullivan, K. J. (2011). Characteristics of single-case designs used to assess intervention effects in 2008. Behavior Research Methods, 43, 971–980. https://doi.org/10.3758/s13428-011-0111-y
Shadish, W. R., Zuur, A. F., & Sullivan, K. J. (2014). Using generalized additive (mixed) models to analyze single case designs. Journal of School Psychology, 52, 149–178.
Shamseer, L., Sampson, M., Bukutu, C., Schmid, C. H., Nikles, J., Tate, R., … the CENT Group. (2015). CONSORT extension for reporting N-of-1 trials (CENT) 2015: Explanation and elaboration. British Medical Journal, 350, h1793.
Smith, J. D. (2012). Single-case experimental designs: A systematic review of published research and current standards. Psychological Methods, 17, 510–550. https://doi.org/10.1037/a0029312
Solanas, A., Manolov, R., & Onghena, P. (2010). Estimating slope and level change in N = 1 designs. Behavior Modification, 34, 195–218.
Solomon, B. G. (2014). Violations of assumptions in school-based single-case data: Implications for the selection and interpretation of effect sizes. Behavior Modification, 38, 477–496.
Swaminathan, H., & Rogers, H. J. (2007). Statistical reform in school psychology research: A synthesis. Psychology in the Schools, 44, 543–549.
Swaminathan, H., Rogers, H. J., & Horner, R. H. (2014). An effect size measure and Bayesian analysis of single-case designs. Journal of School Psychology, 52, 213–230.
Tate, R. L., Perdices, M., Rosenkoetter, U., Shadish, W., Vohra, S., Barlow, D. H., … Wilson, B. (2016). The Single-Case Reporting guideline In Behavioural interventions (SCRIBE) 2016 statement. Aphasiology, 30, 862–876.
Van den Noortgate, W., & Onghena, P. (2003). Hierarchical linear models for the quantitative integration of effect sizes in single-case research. Behavior Research Methods, Instruments, & Computers, 35, 1–10. https://doi.org/10.3758/BF03195492
Vohra, S., Shamseer, L., Sampson, M., Bukutu, C., Schmid, C. H., Tate, R., … the CENT Group. (2015). CONSORT extension for reporting N-of-1 trials (CENT) 2015 Statement. British Medical Journal, 350, h1738.
Watson, P. J., & Workman, E. A. (1981). The non-concurrent multiple baseline across-individuals design: An extension of the traditional multiple baseline design. Journal of Behavior Therapy and Experimental Psychiatry, 12, 257–259.
Ximenes, V. M., Manolov, R., Solanas, A., & Quera, V. (2009). Factors affecting visual inference in single-case designs. Spanish Journal of Psychology, 12, 823–832.
Author note
This research was funded by the Research Foundation–Flanders (FWO), Belgium (Grant ID: G.0593.14). The authors assure that all research presented in this article is fully original and has not been presented or made available elsewhere in any form.
Author information
Authors and Affiliations
Corresponding author
Electronic supplementary material
ESM 1
(TXT 5 kb)
Appendix: Descriptive results (means and standard deviations) of the main effects in the simulation study
Appendix: Descriptive results (means and standard deviations) of the main effects in the simulation study
Rights and permissions
About this article

Cite this article
Michiels, B., Onghena, P. Randomized single-case AB phase designs: Prospects and pitfalls. Behav Res 51, 2454–2476 (2019). https://doi.org/10.3758/s13428-018-1084-x
Published:
Issue Date:
DOI: https://doi.org/10.3758/s13428-018-1084-x