
Abstract
Driven by industrial development and the rising population, the upward trend of electricity consumption is not going to curb. While the electricity suppliers make every endeavor to satisfy the needs of consumers, they are facing the plight of indirect losses caused by technical or non-technical factors. Technical losses are usually induced by short circuits, power outage, or grid failures. The non-technical losses result from humans’ improper behaviors, e.g., electricity burglars. Due to the restrictions of the detection methods, the detection rate in the traditional power grid is lousy. To provide better electricity service for the customers and minimize the losses for the providers, a leap in the power grid is occurring, which is referred to as the smart grid. The smart grid is envisioned to increase the detection accuracy to an acceptable level by utilizing modern technologies, such as cloud computing. With the aim of obtaining achievements of anomaly detection for electricity consumption with cloud computing, we firstly introduce the basic definition of anomaly detection for electricity consumption. Next, we conduct the surveys on the proposed framework of anomaly detection for electricity consumption and propose a new framework with cloud computing. This is followed by centralized and decentralized detection methods. Then, the applications of centralized and decentralized detection methods for the anomaly electricity consumption are listed. Finally, the open challenges of the accuracy of detection and anomaly detection for electricity consumption with edge computing are discussed.
1 Introduction
The development of the industry and the rise in population have increased the consumption of electricity. The upward trend of electricity consumption is not going to curb [1, 2]. While the electricity providers make every effort to fulfill the electricity consumption and to provide the best service to the customers, the service providers are suffering losses in technical and non-technical forms. Technical losses are usually caused by short circuits, power outage, or grid failures. Non-technical losses are mainly caused by humans’ inappropriate usage of electricity and electricity theft, etc. [3, 4]. In the USA alone, electricity theft was reported to cost the providers around <DOLLAR/>6B/year. Energy theft has been a serious problem in the traditional power system [5].
Identifying the non-technical factors and mitigating the losses incurred by them are the major concerns of the electricity service providers [6, 7]. The approach of anomaly detection in the traditional power grid was as follows: If abnormal electricity consumption behaviors were detected by manually monitored, the inspection team would be sent to the detected locations for further inspection. The detection result was considered abnormal if the electricity consumption changes drastically from the normal consumption in either way if it was increased or decreased. This traditional approach required tedious man-hour and money and added more burden to the electricity service providers. Meanwhile, the approach had a low detection rate of below 5% [8].
The requirements for greater efficiency, reliability, and security, as well as the concerns of anomaly detection for electricity consumption, constantly highlight the necessity of a leap in the power grid. This leap is referred to as the smart grid. The smart grid is defined as an electricity network that efficiently integrates the behaviors and actions of all users connected to it such as generators, consumers, and those that do both [9, 10]. The smart grid is capable of delivering electricity more efficiently and making a timely response to wide-ranging events, such as detecting abnormal electricity consumption and adopting the corresponding strategies [11, 12].
As a key technology in the smart grid, advanced metering infrastructure (AMI) can reduce the probability of electricity theft through its excellent monitoring capacities and the detailed usage measurements [13]. Due to the widespread popularity, smart meters provide the opportunity for the utilizers to collect massive electricity consumption data. High-resolution data collected by smart meters provide information on electricity consumption and the lifestyles of the consumers [14]. With the analysis result of customs’ normal power consumption, irregular statistics can reveal some malicious activities. However, the detection rate is limited by some shortcomings in existing classification schemes:
-
1
Data imbalance. The numbers of normal and abnormal samples are out of proportion. Benign samples are easy to get through analyzing historical data. In contrast, abnormal samples or theft samples are rare or do not exist in the dataset. Lack of exhaustive dataset limits the detection rate.
-
2
Non-malicious factors’ interference. The detection rate can be influenced by several non-malicious factors, such as the dynamical change of consumers’ energy demands and the diversity of appliances’ categories, etc. If these non-malicious factors are not properly distinguished and dealt with, they are likely to be mistaken for the false alarm which can result in bad performance of the detection.
To achieve acceptable detection accuracy and manage plenty of smart meters in safe and reliable ways, utilities have to extend existing systems to a distributed data center. Cloud computing, in this respect, is considered to play the key role [15]. It refers to a new computation paradigm, which has extensively spread among industries, academic organizations, and individual clients. In the smart grid, cloud computing can deal well with the massive data generated by millions of smart meters which are deployed in every corner of the city [16]. Cloud computing is capable of improving the detection rate of energy consumption for the following reasons [17]. Managing massive data and distinguishing the malicious factors are complex and beyond the processing capability of the existing system in the smart grid. Therefore, with the aim of achieving a higher detection rate, cloud computing can be utilized to optimize information processing due to the storage and computing mechanisms [18].
The paper is organized as follows. Section 2 introduces the definitions of anomalies and anomaly detection. Section 3 surveys proposed frameworks of anomaly detection for electricity consumption and the framework of anomaly detection for electricity consumption in edge-cloud computing. Section 4 presents the centralized detection of anomaly electricity consumption with big data analysis and decentralized detection of anomaly electricity consumption with edge-cloud computing. Section 5 describes the applications of centralized and decentralized methods for anomaly electricity consumption. Section 6 discusses the open challenges of the accuracy of detection and anomaly detection for electricity consumption with edge computing.
2 Definition
In this section, we first elaborate on the definitions of anomalies and anomaly detection, respectively, then discuss three categories of anomaly detection techniques, and particularly focus on anomaly detection for electricity consumption.
2.1 Anomaly electricity consumption
Anomalies, in general, are also known as outliers, deviants, discordance, or exceptions [19]. Generally, anomalies encompass the following types:
-
i
Point anomalies. While a data point is distinct from the rest of the data, it could refer to as a point anomaly. A point anomaly is the simplest case and is very common.
-
ii
Contextual anomalies. While a data point is anomalous in one specific context, it could refer to as a contextual anomaly. In other words, contextual anomalies often are identified in time-series and spatial data.
-
iii
Collective anomalies. While a collection of data is anomalous, it could refer to as a collective anomaly. Generally, the term “collective” represents the spatial-temporal collection. Even if a set of data is a collective anomaly, it may not be a point anomaly, respectively.
Table 1 lists four definitions of anomalies, respectively. Definitions are all from the perspective of the discrepancies of data [20]. However, for a more comprehensive definition, Johnson et al. [21] not only considered the distinctions of data but also discussed the individual characteristics of each data point. Given aberrant data may do harm for analysis and lead to deviated parameters and faulty results, anomaly detection is a key task to scale down such potential risks. In addition, three definitions of anomaly detection are also presented in Table 1.
Due to the data explosion and the hidden disadvantage of aberrant data, detecting anomalous events is becoming essential increasingly. In Table 2, these three categories of anomaly detection techniques are summarized.
-
1)
Classification:
-
i)
Bayesian network. Khosravi et al. [29] leveraged an improved dynamic Bayesian network to satisfy the demand of a detection model that recognizes anomalous events in the data.
Table 2 Techniques for anomaly detection -
ii)
Support vector machine (SVM). Miao et al. [25] proposed a distributed online one-class SVM algorithm to discover anomalous data via wireless sensor networks and get a decentralized loss function.
-
iii)
Neural networks. Sabokrou et al. [26] used an unsupervised fully convolutional neural network providing anomalous detection in the video stream.
-
i)
-
2)
Nearest neighbor:
-
i)
KNN algorithm. Wang et al. [41] used the KNN algorithm based on the design and simulation of the QualNet simulation platform.
-
ii)
Relative density-based method. Gan et al. [32] proposed a method using an improved local outlier factor (LOF) algorithm for implementing adaptive dynamic adjustment of parameters in network traffic scenarios.
-
i)
-
3)
Clustering:
2.2 Cloud computing
Recently, with the speedy advances of the economy and improvement of residents’ living standards, the amount of power usage is getting higher increasingly and the requirement of utilizing electricity tends to diversify. In 2007, the Energy Independence and Security Act (EISA) stated a national policy to support the National Institute of Standards and Technology (NIST) to create a new power grid [45]. Therefore, to make an extensive distributed power delivery network, a novel power grid, the smart grid, was proposed that is informative, digital, automatic, and interactive. Moreover, there are several characteristics of the smart grid concluded by EISA, including improving power reliability and quality, optimized utilization, higher capacity, and efficiency of the electric network [46]. Given the emergence of smart meters and sensors, anomaly detection could be better adapted to get access to real-time measured data in smart grids aiming to identify the irrelevant data or events that happen infrequently. In particular, the detection of anomalous electricity consumption is one of the most serious issues for electricity providers in smart grids. In this section, losses of electricity in smart grids were discussed; after that, we will show leveraging cloud computing platforms to detect electrical consumption anomalies.
-
1)
Losses of electricity: Due to the rapid advances in modernization and industrialization, the consumption of electricity rises rapidly. Meanwhile, energy providers could face serious problems with anomalous electricity consumption since there are billions of dollars which are lost in energy utilization. In recent years, anomaly detection attracted much attention to electricity consumption in the power systems since it is beneficial for electricity providers to find unusual events that happen infrequently or unconventionally, enhance operational safety, and diminish revenue losses. Particularly, as shown in Table 3, losses of electricity are typically classified into two categories as follows: (i) Technical losses—in the power grid, technical losses are caused by power dissipation, transmission, and distribution loss or equipment failure, which means it occurs inevitably and naturally. Technical losses give rise to financial losses and inefficient usage of energy for a country. Therefore, the improvement of technical losses should be considered from the perspective of a country rather than an institution or an organization. (ii) Non-technical losses (NTLs)—NTLs, on the other hand, are specifically caused by utilizing electricity illegally, electricity theft, meter failure, or bill fraud [47, 48]. Compared with technical losses, NTLs make up the most portion of electricity losses and lead to a huge amount of economic cost. The electricity theft by connecting to the power grid illegally or unauthorized tampering of electric meter is one of the most typical cases in NTLs. It is estimated that up to <DOLLAR/>25 billion was lost in electricity usage due to power theft worldwide every year.
Table 3 Techniques for anomaly detection -
2)
Using cloud platforms to detect power consumption anomalies: During the last decade, a novel computation paradigm, cloud computing, has been developing dramatically, which has extensively spread among industries, academic organizations, and individual clients. In general, the principle of cloud computing is to leverage distributed data centers or central servers to satisfy the demand of computer resources, specifically data storage (e.g., cloud storage) and data computing, at any time for different customers [49]. With the development of smart grids in recent years, the electricity requirement from consumers has increased sharply in diverse periods. The pressure from discovering anomalous electricity consumption, especially NTLs, as well as security analysis and communication efficiency, is growing for smart grid systems. Consequently, electricity providers need to integrate most resources into cloud computing platforms for more powerful computation capability and a higher efficient communication network. Compared with the conventional identifying patterns for power consumption, a novel detecting model of electricity consumption with cloud computing [50], which will be elaborated on in Section 3, can boost the efficiency of resource utilization and reduce the time of computation. Therefore, energy providers can discover anomalous electricity usage in real-time by leveraging cloud platforms.
3 Framework
Considering that anomalous electricity consumption could give rise to multiple revenue losses, significant efforts have been spent on identifying unusual events of electricity use by energy service providers. In this section, the frameworks of anomaly detection for electricity consumption were reviewed, and we propose a framework with a particular focus on cloud computing.
3.1 Surveys on proposed frameworks of anomaly detection for electricity consumption
In general, anomaly detection in smart grid systems relates to unusual power consumption, especially NTLs which encompass illegal electricity usage, theft of power, and bill fraud. It could lead to numerous economic costs every year globally. Electricity theft, in particular, plays a key role in NTLs using power by unauthorized connection to power systems or faking bills without paying [51]. There is a considerable body of studies in anomaly detection for electricity consumption to identify aberrant activities of power theft and minimize financial costs for energy providers. This section introduces a survey on existing frameworks of anomaly detection for power consumption, then summarizes it in Table 4. Moghaddass et al. [45] put forward an anomaly detection framework in real-time to discover the events, conditions, and behaviors that occur infrequently. Such a framework is much different from existing works that it is designed based on the hierarchical structure of the grid and smart grid data and solves significant challenges, including multivariate counting data, missing points, high-dimensionality, and variable selection. Yip et al. [46] proposed a novel anomaly detection framework aiming to assess the electricity usage of consumers for discovering the possible behaviors of power theft, energy fraud, and meter errors. Due to the existing approaches for discovering NTLs that do not perform very well, it is necessary to utilize a new framework that can availably identify electricity theft for minimizing revenue costs. Therefore, they proposed such a framework using linear programming to address the problems concerning existing detection methods. Tao et al. [47] developed a statistical framework that can detect electricity theft and discover consumers involved based on information usage of higher-order statistics of energy consumption. Owing to the financial losses by electricity theft, advanced metering infrastructure (AMI) has emerged to control the occurrence and decrease the potential risk of energy theft. To improve the capability of monitoring anomalous events, smart meters and sensors are utilized extensively. Qiu et al. [48] designed a monitoring and alarm framework that describes the patterns of consumers’ electricity consumption by acquiring multiple features. To improve the detection efficiency, the framework leverages the grid processing technology that chooses outliers of low-density regions. Xu et al. [56] put forward an AMI intrusion detection framework aiming to integrate the sensors and consumption data, as well as integrate meter audit logs of events to the anomaly detection model for detecting electricity theft with higher precision. Although several proposed frameworks, as mentioned above, can discover and recognize electricity theft-related events, they may have some drawbacks as follows: (i) Limited computation resources—driven by the increasing requirement of electricity, the scale of power data or information from meters or sensors generated by consumers is expanding constantly. The local data servers in power systems are not able to execute such computational and processing tasks due to finite computing power. (ii) Limited storage capability—in general, the storage capability of local servers in power systems is hard to satisfy the infinite storage. Once the storage limit will be reached, the data center needs to extend the number of servers, which is inefficient, unadaptable, and costly. Therefore, in the next section, we will propose a novel framework of anomaly detection for electricity consumption by using cloud computing.
3.2 Framework of anomaly detection for electricity consumption with cloud computing
Besides the overview of proposed frameworks, we further propose a framework of anomaly detection for electricity consumption by utilizing cloud platforms, as illustrated in Fig. 1. The goal of such a framework is to identify anomalous power consumption with high scalability, availability, and reliability. Main components of this framework are described as follows:
-
1)
Data collection: Due to the improvement of industrialization and modernization, the amounts of power consumption are getting higher significantly. One of the big features of smart grids is the data explosion generated from meters or sensors. Compared with the conventional meters, the capability of smart meters is gathering electricity consumption from customers and appending more power information, including the values of voltage, phase angle, and frequency [62]. Smart meters can also read real-time electricity use and transmit these data to the energy providers. In our framework, the data collection phase contains three steps to collect higher accurate, complete, and consistent data.
-
Step 1:
Data acquisition. Multiple data of power consumption generated from industries, buildings, and households are collected by smart meters or sensors. All these electrical data do not store to the database or data centers immediately; however, they could be transferred to executing further processing in the next step.
Fig. 1 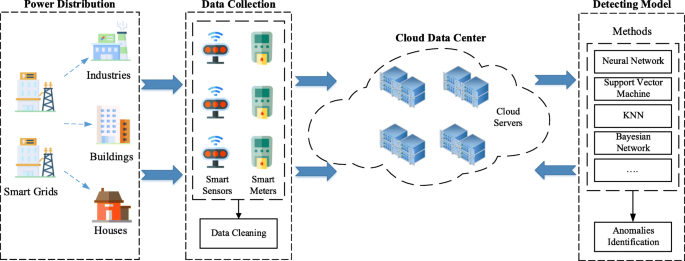
The framework of anomaly detection for electricity consumption with cloud computing
-
Step 2:
Data cleaning. Although numerous electricity consumption data are gathered, we may need to remove irrelevant data. Smart grid data have the characteristics of time-series, such as intra-week, intra-day, intra-hour, and real-time. There may have some incomplete data, error data, duplicated data, or noise. Therefore, before utilizing these raw data to identify anomalous events, they could be cleaned.
-
Step 3:
Data transmission. After pre-processing collected data, these ready data will be transmitted to a cloud data center. Smart grids could utilize the characteristics of cloud platforms which can provide high fault-tolerance through redundancy and rollback-recovery through versioned copies [63]. Furthermore, cloud data centers could extend the existing communication network to a distributed network for satisfying the demand of sending smart meter data in a reliable, real-time, and elastic way.
-
Step 1:
-
2)
Anomaly detecting: In this stage, a detection model, deployed in the cloud computing platform, will be used to identify anomalous electricity consumption data in smart grids, especially power theft. Compared with the conventional detection model distributed on local servers, the utilization of cloud computing can offer consumers a virtualized infrastructure and raw materials of hardware (e.g., processing, memory, and servers). The virtual machines with different configurations based on clients’ requirements are provisioned, which improves the flexibility and customization for using computing resources. The size of ready data generated from smart meters or sensors is considerable. Therefore, traditional data centers of power grids may not be capable of processing such scale data due to limited computing performance, while the cloud data center has a more powerful computing capability. After data cleaning, the features of pre-processed data will be calculated. The data size could be scaled down by removing data with duplicated or similar features to reduce the data dimension. Moreover, several methods are available for detecting anomalous electricity consumption, including neural network, support vector machine, KNN algorithm, and Bayesian network [64]. Such approaches run in real-time for anomaly detection in cloud platforms, which is the key part of this stage. The results of the anomaly detection model could depend on the selected method and its outputs. After that, the outputs are analyzed and evaluated to identify anomalies.
-
3)
Results evaluation: In this stage, we need to provide insight into different factors that could influence the performance of anomaly detection for electricity consumption. For a better intuition about its advantages and limitations, the following metrics could be used to evaluate the performance of the detection model: (i) Accuracy—the accuracy is the percentage of the number of correctly detecting values Nc out of the total number of the detected values N. The accuracy rate Ra is calculated by Ra=Nc/N. For example, a high Ra means a better detection performance. (ii) False positives—if some negative samples are identified with the positive or non-negative samples by detection method, that case is referred to as false positives [65]. Supposed that the number of false positives is FP, and the number of true negatives is TN, the false positive rate FPR is calculated by FPR = FP/(TN + FP). (iii) False negatives—on the other hand, if some positive samples are identified with the negative or non-positive samples by detection method, that case is referred to as false negatives. Supposed that the number of false negatives is FN, and the number of true negatives is TP, the false negative rate FNR is calculated by FNR = FN/(TP + FN) [66].

4 Methods for prevention of anomaly power consumption
Currently, plenty of studies have been carried out which point to the anomaly detection of electricity. In this section, we will methodically present, categorize, and outline the extant methods both in the centralized and decentralized aspects.
4.1 Centralized detection of anomaly electricity consumption with big data analysis
Centralized detection of anomaly electricity consumption methods can be generally separated into two sides: the mathematical analysis methods and machine learning algorithms. In this section, we will discuss these two sides in great detail.
4.1.1 Mathematical methods
In truth, there is presently no state-of-the-art method that has been proposed in the mathematical area of anomaly detection for electricity consumption, and the existing methods may all have different benefits and weaknesses. Therefore, we extract mathematical analysis methods to high-dimensional random matrix methods and sequence discretization methods [67]. In this section, we take a holistic view of these methods, with the hope of setting a clear direction for future research.
Tasfi et al. [68] described the merit of minimum variance distortionless response beam-forming (or Capon beam-forming). Moreover, the author analyzed the need of estimating the inverse covariance matrix of the received signals from data. Besides, the author designed an estimator to optimize the inverse covariance, which is suitable for high-dimensional settings.
Rashid et al. [69] identified and defined factor models to reduce dimension. Furthermore, the author presented a new approach to estimate high-dimensional factor models, using the empirical spectral density of residuals. The proposed method is robust to noise or the presence of weak factors. Whereas the method failed to employ more general residual modeling, so further study is needed to calculate the distribution readily.
Morris et al. [70] paid attention to the problem of low-rank plus sparse matrix decomposition for big data. Meanwhile, the author proposed an approach that transforms the decomposition problem into a subspace learning problem. In addition, the author proposed adaptive sampling algorithms to address the problem of column/row sampling.
Basumallik et al. [71] performed an average case analysis of the generalization dynamics of large neural networks trained using gradient descent. Especially, the author studied the practically-relevant “high-dimensional” to use random matrix theory and exact solutions in linear models. As a result, the author identified two novel phenomena underlying this behavior in over-complete models.
Table 5 shows the benefits and weaknesses of mathematical methods.
4.1.2 Machine learning algorithms
During the post-more law age, the hash rate ceases to be the restraining factor in the big data processing area. Therefore, machine learning algorithms have become mainstream in the electricity consumption detection industry. In this section, we will explain the applications of machine learning algorithms based on the most common model: deep neural networks (DNN) and recurrent neural networks (RNN).
Rashid et al. [69] proposed a revised method based on the non-intrusive load monitoring theory. They constructed a workload model by using the REFIT dataset from smart-meter devices and regarded it as a built-in prediction model for the method. The method focuses on estimating the electricity consumption based on the built-in model to detect the anomaly consumption, if and only if the worker node is in running.
Eldali et al. [73] investigated the influence of acquisition frequency in the electrical power system and proposed a detecting method by regulating the frequency dynamically for every worker node in the system. By incorporating the detecting rate of different acquisition frequencies under the normal condition and the sudden increase condition, they found the corresponding frequency for each situation. The method detects anomaly consumption by looking for changing data under the appropriate acquisition frequency.
Guarany et al. [74] proposed a classification method base on the CNN model. They identified the problem as a multiclass classification problem and combined the electricity consumption data (e.g., worker nodes’ states, aggressive behaviors, common time sequences) as a multivariate vector for feeding the CNN model.
Kou et al. [75] collected the electricity consumption dataset generated by the smart sockets and used the dataset to build the user behavior model. They proposed a classification method by inferring users’ abnormal behaviors, based on estimating the operating states of users’ smart home devices in view of the user behavior model.
Table 6 shows the benefits and weaknesses of machine learning algorithms.
4.2 Decentralized detection of anomaly electricity consumption with edge-cloud computing
The centralized detection methods mainly focused on detecting the unnatural value in the dataset but neglect the trend of period series [76]. Instead, we use decentralized detection methods to find the anomaly trend in the dataset generated by smart appliances [77]. In this section, we will review some significant decentralized methods.
Buzau et al. [78] argued that the following two steps can identify anomalies: (1) electricity consumption forecasting and (2) anomaly detection. Consequently, the author proposed a shared connected deep neural network for forecasting electricity consumption time-series anomaly. What is more, the method of transferring learning knowledge between domains significantly to improve the forecasting results has been proposed.
García et al. [65] described the great impact of analyzing consumption to find unexpected behaviors. The research conducted by the author presents an experimental study of supervised and unsupervised neural networks for anomaly detection in electrical consumption. Besides, the result of experiments shows that the supervised approach has a significant improvement in the anomaly detection rate.
Xiang et al. [80] identified detecting consumption anomalies with a real-time big data analytic problem. Moreover, the author proposed a supervised learning and statistical-based anomaly detection method, and implemented a lambda system using the in-memory distributed computing framework, Spark, and its extension Spark Streaming.
Ahn and Wang [67] proposed a residential electrical load anomaly detection framework that includes a hybrid one-step-ahead load predictor and a rule-engine-based load anomaly detector for the goal of improving prediction and detection accuracy. Meanwhile, through employing the Bayesian information criterion, the author reduced the influence of the over- or under-fitting problem.
Zhou et al. [82] utilized two subnetworks: one performs reconstruction and uses unlabeled data, while the other one performs classification with labeled data. On this basis, the author presented a deep semi-supervised convolutional neural network with confidence sampling for electrical anomaly detection.
5 Applications
5.1 Applications of centralized detection methods for the anomaly electricity consumption
The centralized detection methods for the anomaly electricity consumption process and analyze the obtained electricity consumption data uniformly, and the methods which are based on the big data have been widely used in practice. Advanced metering infrastructure (AMI), such as smart meters, can measure the user’s electricity consumption at fine-grained intervals, including the user’s electricity consumption, voltage level, and the switching status of power services. The smart meter sends these data to the data processing center for processing and analysis. In this process, the methods based on big data or other centralized detection ways are used to analyze the electricity data generated by a large number of electricity meters and these methods have provided a suitable solution for the detection of the anomaly electricity consumption. Cui et al. [72] used the centralized detection method and built a system to help a facilities management company to detect and visualize anomalous events in the school electricity consumption data. This system based on the centralized detection method can greatly improve the performance when detecting the anomaly electricity consumption in the school. Eldali et al. [73] got the AMI data through the smart meters and applied the AMI data to anomaly detection. They developed a kind of open-source computer software based on the centralized detection methods, and this software can analyze the AMI data and visualize the anomaly detection results. Silva et al. [74] anticipated the occurrence of anomaly electricity consumption with the centralized detection method. They applied this method to the data generated by the building in 20 weeks and achieved the expected result. At the same time, this method can be used for anomaly prediction directly.
5.2 Applications of decentralized detection methods for the anomaly electricity consumption
The decentralized detection methods for the anomaly electricity consumption distribute and analyze a large number of electricity consumption data by installing an electricity meter device in each household [86]. In the latest smart-grid architecture, millions of smart devices are distributed across buildings and homes over a wide geographical area and use smart meters to monitor electricity consumption. A large number of data will be generated under the architecture of the smart grid, but these data are difficult to handle with cloud computing alone and often lead to a large number of latency [87]. In this case, adopting edge-cloud computing or fog computing can effectively reduce delay and improve data processing efficiency[88]. In the process of electricity anomaly detection, the data such as current and voltage are obtained from the sensor of the smart electricity meter firstly, and then, the obtained data are trained and analyzed with an appropriate model so that the abnormal data can be extracted efficiently. EI-Awadi et al. [74] used fog computing to solve the problem of anomaly electricity consumption detection. They applied this method to the microgrid of the University of Vigo and detected the anomaly electricity consumption through the distributed collaboration of terminal devices. Qi et al. [89] used the decentralized detection method based on deep learning and extract the high-level representation from the data acquired automatically from the smart meters. This method has a good prospect for intelligent applications and can improve the efficiency of calculation. Buzau et al. [78] used an end-to-end solution based on the decentralized detection methods to solve the problem of the non-technical losses in anomaly electricity consumption, and this model has been used in Endesa, which is the largest electricity company in Spain.
6 Open challenges
The existing methods show good performance in anomaly electricity consumption detection, but at the same time, there are some shortcomings. In order to improve the accuracy and security of anomaly electricity consumption detection and ensure the reliable and efficient operation of the smart grid, the challenges in anomaly electricity consumption detection need to be further analyzed.
6.1 The accuracy of detection
Centralized and decentralized detections of anomaly electricity consumption can effectively know whether the user has anomaly electricity consumption, but in practical application, the accuracy of the two methods needs to be further improved [91]. At the same time, when we receive the electricity consumption data, we should ensure the security of the data transmission.
-
1
Some anomaly detection methods use the AMI data to analyze the behavior of power users. But the AMI data do not have a common data format, so it is difficult to share the data generated by different providers.
-
2
The smart grid consists of a large number of smart nodes, and this kind of network may be more vulnerable to malicious attacks. To ensure the security of the smart grid, it is necessary to detect any unusual behaviors in the smart grid.
-
3
In the electric system, the malfunction of measuring instruments is almost inevitable and will affect the detection accuracy. Using the double devices or backing up the electricity consumption data is helpful to rectify the erroneous data.
6.2 Anomaly detection for electricity consumption in edge computing
After obtaining more accurate anomaly electricity detection data, the next step is to further improve the real-time performance of anomaly electricity detection. Real-time detection of anomaly electricity consumption needs to use a large amount of data, and it needs to be able to quickly process a large number of data streams in the real-time environment and use the edge calculation which can effectively improve the concurrency of data processing [92]. In the future anomaly electricity consumption detection, smart electricity meters with calculation performance can be set in each power consumption place, and a large amount of data calculation can be distributed to each smart electricity meter, so as to realize real-time detection of anomaly electricity consumption[93].
7 Conclusion
With the development of the industry and the population rise, the upward trend of electricity consumption is not going to cease. Meanwhile, due to some technical and non-technical factors such as electricity theft, anomaly detection for electricity consumption in the traditional power grid needs to be upgraded. As a result, the smart grid is an enhancement of the traditional power grid. With the utilization of advancing technologies, for instance, cloud computing, anomaly detection for electricity consumption in the smart grid can achieve acceptable accuracy. In this paper, the definition of anomalies and anomaly detection was first introduced. Then, comprehensive surveys on the proposed framework of anomaly detection for electricity consumption were conducted, and the framework of anomaly detection for electricity consumption with cloud computing was proposed. Afterward, overviews of methods and applications of centralized and decentralized detection were provided. Finally, the open challenges of the accuracy of detection and anomaly detection for electricity consumption with edge computing were discussed. We hope the survey is capable of eliciting further research on anomaly detection for electricity consumption with cloud computing.
Abbreviations
- AMI:
-
Advanced metering infrastructure
- SVM:
-
Support vector machine
- KNN:
-
K-nearest neighbor
- LOF:
-
Local outlier factor
- EISA:
-
Energy Independence and Security Act
- NIST:
-
National Institute of Standards and Technology
- NTL:
-
Non-technical loss
- DNN:
-
Deep neural networks
- RNN:
-
Recurrent neural networks
- CNN:
-
Convolutional neural networks
References
T. B. Smith, Electricity theft: a comparative analysis. Energy policy. 32(18), 2067–2076 (2004).
C. Banad Ramesh, Electricity Consumption Anomaly Detection Model Using Deep Learning (National College of Ireland, Dublin, 2019).
X. Chi, C. Yan, H. Wang, W. Rafique, L. Qi, Amplified locality-sensitive hashing-based recommender systems with privacy protection. Concurr. Comput. Pract. Experience (2020). https://doi.org/10.1002/cpe.5681.
J. I. Guerrero, I. Monedero, F. Biscarri, J. Biscarri, R. Millán, C. León, Non-technical losses reduction by improving the inspections accuracy in a power utility. IEEE Trans. Power Syst.33(2), 1209–1218 (2017).
Y. Kabalci, A survey on smart metering and smart grid communication. Renew. Sust. Energ. Rev.57:, 302–318 (2016).
K. Moslehi, R. Kumar, A reliability perspective of the smart grid. IEEE Trans. Smart Grid. 1(1), 57–64 (2010).
M. L. Tuballa, M. L. Abundo, A review of the development of smart grid technologies. Renew. Sust. Energ. Rev.59:, 710–725 (2016).
J. Zheng, D. W. Gao, L. Lin, in 2013 IEEE Green Technologies Conference (GreenTech). Smart meters in smart grid: an overview (IEEEDenver, 2013), pp. 57–64.
E. Mengelkamp, B. Notheisen, C. Beer, D. Dauer, C. Weinhardt, A blockchain-based smart grid: towards sustainable local energy markets. Comput. Sci. Res. Dev.33:, 207–214 (2018).
P. Jokar, N. Arianpoo, V. C. Leung, Electricity theft detection in ami using customers’ consumption patterns. IEEE Trans. Smart Grid. 7(1), 216–226 (2015).
X. Chen, L. Jiao, W. Li, X. Fu, Efficient multi-user computation offloading for mobile-edge cloud computing. IEEE/ACM Trans. Netw.24(5), 2795–2808 (2015).
W. Zhong, X. Yin, X. Zhang, S. Li, W. Dou, R. Wang, L. Qi, Multi-dimensional quality-driven service recommendation with privacy-preservation in mobile edge environment. Comput. Commun.157:, 116–123 (2020).
S. Tan, D. De, W. -Z. Song, J. Yang, S. K. Das, Survey of security advances in smart grid: a data driven approach. IEEE Commun. Surv. Tutorials. 19(1), 397–422 (2017).
V. C. Gungor, D. Sahin, T. Kocak, S. Ergut, C. Buccella, C. Cecati, G. P. Hancke, A survey on smart grid potential applications and communication requirements. IEEE Trans. Ind. inform.9(1), 28–42 (2012).
X. Xu, R. Mo, F. Dai, W. Lin, S. Wan, W. Dou, Dynamic resource provisioning with fault tolerance for data-intensive meteorological workflows in cloud. IEEE Trans. Ind. inform.16(9), 6172–6181 (2019).
C. Zhou, A. Li, A. Hou, Z. Zhang, Z. Zhang, P. Dai, F. Wang, Modeling methodology for early warning of chronic heart failure based on real medical big data. Expert Syst. Appl.151:, 113361 (2020).
L. Baldacci, M. Golfarelli, D. Lombardi, F. Sami, Natural gas consumption forecasting for anomaly detection. Expert Syst. Appl.62:, 190–201 (2016).
J. Li, T. Cai, K. Deng, X. Wang, T. Sellis, F. Xia, Community-diversified influence maximization in social networks. Inf. Syst.92:, 101522 (2020).
L. Decker, D. Leite, L. Giommi, D. Bonacorsi, Real-time anomaly detection in data centers for log-based predictive maintenance using an evolving fuzzy-rule-based approach. arXiv preprint arXiv:2004.13527 (2020).
X. Xu, X. Zhang, X. Liu, J. Jiang, L. Qi, M. Z. A. Bhuiyan, Adaptive computation offloading with edge for 5g-envisioned internet of connected vehicles. IEEE Trans. Intell. Transp. Syst.PP:, 1–10 (2020).
V. Hodge, J. Austin, A survey of outlier detection methodologies. Artif. Intell. Rev.22(2), 85–126 (2004).
X. Xue, X. Zhang, H. Gao, Y. Xue, L. Qi, W. Dou, Become: blockchain-enabled computation offloading for iot in mobile edge computing. IEEE Trans. Ind. Inform. 16(6), 4187–4195 (2019).
S. Pauwels, T. Calders, in Proceedings of the 34th ACM/SIGAPP Symposium on Applied Computing. An anomaly detection technique for business processes based on extended dynamic Bayesian networks (ACMLafayette, 2019), pp. 494–501.
R. Moghaddass, S. Sheng, An anomaly detection framework for dynamic systems using a Bayesian hierarchical framework. Appl. Energy. 240:, 561–582 (2019).
X. Miao, Y. Liu, H. Zhao, C. Li, Distributed online one-class support vector machine for anomaly detection over networks. IEEE Trans. Cybern.49(4), 1475–1488 (2018).
M. Sabokrou, M. Fayyaz, M. Fathy, Z. Moayed, R. Klette, Deep-anomaly: fully convolutional neural network for fast anomaly detection in crowded scenes. Comp. Vision Image Underst.172:, 88–97 (2018).
S. K. Patel, A. Sonker, Rule-based network intrusion detection system for port scanning with efficient port scan detection rules using snort. Int. J. Futur. Gener. Commun. Netw.9(6), 339–350 (2016).
L. Wang, J. Li, U. A. Bhatti, Y. Liu, in International Conference on Artificial Intelligence and Security. Anomaly detection in wireless sensor networks based on knn (SpringerNew York, 2019), pp. 632–643.
M. R. Khosravi, X. Xu, B. Shen, X. Yin, H. Wu, L. Qi, S. Wan, Edge server quantification and placement for offloading social media services in industrial cognitive iov. IEEE Trans. Ind. Inform.PP:, 1–1 (2020).
B. Wang, S. Ying, G. Cheng, R. Wang, Z. Yang, B. Dong, Log-based anomaly detection with the improved k-nearest neighbor. Int. J. Softw. Eng. Knowl. Eng.30(02), 239–262 (2020).
W. Yang, G. -W. Shen, W. Wang, L. -Y. Gong, M. Yu, G. -Z. Dong, Anomaly detection in microblogging via co-clustering. J. Comput. Sci. Technol.30(5), 1097–1108 (2015).
Z. Gan, X. Zhou, in 2018 10th International Conference on Intelligent Human-Machine Systems and Cybernetics (IHMSC), 1. Abnormal network traffic detection based on improved lof algorithm (IEEEHangzhou, 2018), pp. 142–145.
Y. Ou, B. Deng, X. Liu, K. Zhou, in 2019 IEEE Sustainable Power and Energy Conference (iSPEC). Local outlier factor based false data detection in power systems (IEEEBeijing, 2019), pp. 2003–2007.
K. Babaei, Z. Chen, T. Maul, Detecting point outliers using prune-based outlier factor (plof). arXiv preprint arXiv:1911.01654. abs/1911.01654: (2019).
M. Wazid, A. K. Das, An efficient hybrid anomaly detection scheme using k-means clustering for wireless sensor networks. Wirel. Pers. Commun.90(4), 1971–2000 (2016).
R. Ghezelbash, A. Maghsoudi, E. J. M. Carranza, Optimization of geochemical anomaly detection using a novel genetic k-means clustering (GKMC) algorithm. Comput. Geosci.134:, 104335 (2020).
A. Schmutz, J. Jacques, C. Bouveyron, L. Bozzi, L. Cheze, P. Martin, Detection of energy waste in French households thanks to a co-clustering model for multivariate functional data (2019).
S. Krishnaveni, P. Vigneshwar, S. Kishore, B. Jothi, S. Sivamohan, Anomaly-based intrusion detection system using support vector machine (Springer, Lucca, 2020).
P. Xiang, H. Zhou, H. Li, S. Song, W. Tan, J. Song, L. Gu, Hyperspectral anomaly detection by local joint subspace process and support vector machine. Int. J. Remote. Sens.41(10), 3798–3819 (2020).
X. Zhai, K. Liu, W. Nash, D. Castineira, et al, in International Petroleum Technology Conference. Smart autopilot drone system for surface surveillance and anomaly detection via customizable deep neural network, (2020). International Petroleum Technology Conference.
C. Greer, D. A. Wollman, D. E. Prochaska, P. A. Boynton, J. A. Mazer, C. T. Nguyen, G. J. FitzPatrick, T. L. Nelson, G. H. Koepke, A. R. Hefner Jr, et al., NIST Framework and Roadmap for Smart Grid Interoperability Standards, Release 3.0 (National Institute of Standards and Technology, 2014). https://doi.org/10.6028/nist.sp.1108r3.
S. S. S. R. Depuru, L. Wang, V. Devabhaktuni, Electricity theft: overview, issues, prevention and a smart meter based approach to control theft. Energy Policy. 39(2), 1007–1015 (2011).
Y. Chen, N. Zhang, Y. Zhang, X. Chen, W. Wu, X. S. Shen, Energy efficient dynamic offloading in mobile edge computing for internet of things. IEEE Trans. Cloud Comput., 1–1 (2019).
J. Nagi, K. S. Yap, S. K. Tiong, S. K. Ahmed, M. Mohamad, Nontechnical loss detection for metered customers in power utility using support vector machines. IEEE Trans. Power Deliv.25(2), 1162–1171 (2009).
R. Moghaddass, J. Wang, A hierarchical framework for smart grid anomaly detection using large-scale smart meter data. IEEE Trans. Smart Grid. 9(6), 5820–5830 (2017).
S. -C. Yip, W. -N. Tan, C. Tan, M. -T. Gan, K. Wong, An anomaly detection framework for identifying energy theft and defective meters in smart grids. Int. J. Electr. Power Energy Syst.101:, 189–203 (2018).
J. Tao, G. Michailidis, A statistical framework for detecting electricity theft activities in smart grid distribution networks. IEEE J. Sel. Areas Commun. 38(1), 205–216 (2019).
H. Qiu, Y. Tu, Y. Zhang, in 2018 Tenth International Conference on Advanced Computational Intelligence (ICACI). Anomaly detection for power consumption patterns in electricity early warning system (IEEEXiamen, 2018), pp. 867–873.
S. McLaughlin, B. Holbert, A. Fawaz, R. Berthier, S. Zonouz, A multi-sensor energy theft detection framework for advanced metering infrastructures. IEEE J. Sel. Areas Commun.31(7), 1319–1330 (2013).
D. Abbasinezhad-Mood, A. Ostad-Sharif, M. Nikooghadam, Novel anonymous key establishment protocol for isolated smart meters. IEEE Trans. Ind. Electron.67(4), 2844–2851 (2019).
A. Ashok, M. Govindarasu, V. Ajjarapu, Online detection of stealthy false data injection attacks in power system state estimation. IEEE Trans. Smart Grid. 9(3), 1636–1646 (2016).
J. Yeo, G. Papanicolaou, Random matrix approach to estimation of high-dimensional factor models. arXiv preprint arXiv:1611.05571 (2016).
M. Rahmani, G. K. Atia, High dimensional low rank plus sparse matrix decomposition. IEEE Trans. Sig. Process. 65(8), 2004–2019 (2017).
M. S. Advani, A. M. Saxe, High-dimensional dynamics of generalization error in neural networks. arXiv preprint arXiv:1710.03667 (2017).
Z. Fan, I. M. Johnstone, Y. Sun, Spiked covariances and principal components analysis in high-dimensional random effects models. arXiv preprint arXiv:1806.09529 (2018).
X. Xu, X. Liu, Z. Xu, F. Dai, X. Zhang, L. Qi, Trust-oriented iot service placement for smart cities in edge computing. IEEE Internet of Things J.7(5), 4084–4091 (2019).
S. Rajasegarar, C. Leckie, M. Palaniswami, J. C. Bezdek, in 2006 10th IEEE Singapore International Conference on Communication Systems. Distributed anomaly detection in wireless sensor networks (IEEESingapore, 2006), pp. 1–5.
J. -S. Chou, A. S. Telaga, Real-time detection of anomalous power consumption. Renew. Sust. Energ. Rev.33:, 400–411 (2014).
H. Liu, H. Kou, C. Yan, L. Qi, Keywords-driven and popularity-aware paper recommendation based on undirected paper citation graph. Complexity. 2020:, 1–15 (2020).
D. B. Arayaa, K. Grolingera, H. F. ElYamanya, M. A. Capretza, G. Bitsuamlakb, An ensemble learning framework for anomaly detection in building energy consumption. Energy Build.144:, 191–206 (2017). https://doi.org/10.1016/j.enbuild.2017.02.058.
X. Xu, D. Zhu, X. Yang, S. Wang, L. Qi, W. Dou, Concurrent Practical Byzantine Fault Tolerance for Integration of Blockchain and Supply Chain (Association for Computing Machinery (ACM), 2020). https://doi.org/10.1145/3395331.
S. Belinschi, M. A. Nowak, R. Speicher, W. Tarnowski, Squared eigenvalue condition numbers and eigenvector correlations from the single ring theorem. J. Phys. A Math. Theor.50(10), 105204 (2017).
G. Trigeorgis, K. Bousmalis, S. Zafeiriou, B. W. Schuller, A deep matrix factorization method for learning attribute representations. IEEE Trans. Pattern. Anal. Mach. Intell.39(3), 417–429 (2016).
J. -S. Chou, A. S. Telaga, W. K. Chong, G. E. Gibson Jr, Early-warning application for real-time detection of energy consumption anomalies in buildings. J. Clean. Prod.149:, 711–722 (2017).
J. García, E. Zamora, H. Sossa, in Mexican International Conference on Artificial Intelligence. Supervised and unsupervised neural networks: experimental study for anomaly detection in electrical consumption (SpringerGuadalajara, 2018), pp. 98–109.
X. Liu, N. Iftikhar, P. S. Nielsen, A. Heller, in International Conference on Big Data Analytics and Knowledge Discovery. Online anomaly energy consumption detection using lambda architecture (SpringerPorto, 2016), pp. 193–209.
S. -H. Ahn, X. Wang, Real-time prediction and anomaly detection of electrical load in a residential community. Appl. Energy. 259:, 114145 (2020).
N. L. Tasfi, W. A. Higashino, K. Grolinger, M. A. Capretz, in 2017 IEEE International Conference on Internet of Things (iThings) and IEEE Green Computing and Communications (GreenCom) and IEEE Cyber, Physical and Social Computing (CPSCom) and IEEE Smart Data (SmartData). Deep neural networks with confidence sampling for electrical anomaly detection (IEEEExeter, 2017), pp. 1038–1045.
H. Rashid, V. Stankovic, L. Stankovic, P. Singh, in ICASSP 2019-2019 IEEE International Conference on Acoustics, Speech and Signal Processing (ICASSP). Evaluation of non-intrusive load monitoring algorithms for appliance-level anomaly detection (IEEEBrighton, 2019), pp. 8325–8329.
S. Morris, S. W. Yen, M. A. Ezra, T. J. Huat, Effect of smart meter data collection frequency in an early detection of shorter-duration voltage anomalies in smart grids. Int. J. Electr. Power Energy Syst.109:, 1–8 (2019).
S. Basumallik, R. Ma, S. Eftekharnejad, Packet-data anomaly detection in pmu-based state estimator using convolutional neural network. Int. J. Electr. Power Energy Syst.107:, 690–702 (2019).
W. Cui, H. Wang, in 2017 IEEE 2nd International Conference on Big Data Analysis (ICBDA). Anomaly detection and visualization of school electricity consumption data (IEEEBeijing, 2017), pp. 606–611.
F. Eldali, T. Kirk, D. Pinney, in 2017 IEEE Power & Energy Society Innovative Smart Grid Technologies Conference (ISGT). Application of ami data to anomaly detection and dynamic power flow analysis (IEEEArlington, 2017), pp. 1–4.
A. da Silva, I. Guarany, B. Arruda, E. C. Gurjão, R. Freire, in 2019 IEEE International Symposium on Circuits and Systems (ISCAS). A method for anomaly prediction in power consumption using long short-term memory and negative selection (IEEESapporo, 2019), pp. 1–5.
H. Kou, H. Liu, C. Yan, L. Qi, Link prediction in paper citation network to construct paper correlation graph. EURASIP J. Wirel. Commun. Netw.2019(1), 1–12 (2019).
Y. Yuan, K. Jia, in 2015 International Conference on Intelligent Information Hiding and Multimedia Signal Processing (IIH-MSP). A distributed anomaly detection method of operation energy consumption using smart meter data (IEEEAdelaide, 2015), pp. 310–313.
P. Lai, Q. He, M. Abdelrazek, F. Chen, J. Hosking, J. Grundy, Y. Yang, in International Conference on Service-Oriented Computing. Optimal edge user allocation in edge computing with variable sized vector bin packing (SpringerHangzhou, 2018), pp. 230–245.
M. -M. Buzau, J. Tejedor-Aguilera, P. Cruz-Romero, A. Gomez-Exposito, Hybrid deep neural networks for detection of non-technical losses in electricity smart meters. IEEE Trans. Power Syst.35(2), 1254–1263 (2019).
S. Zhu, Y. Wang, L. Qiu, Z. Shao, in 2011 IEEE Power Engineering and Automation Conference, vol. 1. The effects analysis of measurement anomaly in electricity settlement of provincial generation power market (IEEEWuhan, 2011), pp. 406–408.
M. Xiang, H. Rao, T. Tan, Z. Wang, Y. Ma, Abnormal behaviour analysis algorithm for electricity consumption based on density clustering. J. Eng.2019(10), 7250–7255 (2019).
X. Liang, B. Zhao, Q. Ma, B. Sun, B. Cui, in International Conference on Advanced Information Networking and Applications. Terminal access data anomaly detection based on random forest for power user electric energy data acquisition system (SpringerKunibiki Messe, 2019), pp. 166–175.
Y. Zhou, L. Qi, W. Dou, J. Yu, C. Hu, A context-aware service evaluation approach over big data for cloud applications. IEEE Trans. Cloud Comput.PP:, 1–1 (2015).
B. Yildiz, J. I. Bilbao, J. Dore, A. B. Sproul, Recent advances in the analysis of residential electricity consumption and applications of smart meter data. Appl. Energy. 208:, 402–427 (2017).
Y. Wang, Q. Chen, T. Hong, C. Kang, Review of smart meter data analytics: applications, methodologies, and challenges. IEEE Trans. Smart Grid. 10(3), 3125–3148 (2018).
K. Tu, D. Vernatha, Application of building information modeling in energy management of individual departments occupying university facilities. World Acad. Sci. Eng Technol. Int. J. Archit. Environ. Eng.10(2), 225–231 (2016).
X. Xia, F. Chen, Q. He, J. Grundy, M. Abdelrazek, H. Jin, Cost-effective app data distribution in edge computing. IEEE Trans. Parallel Distrib. Syst. (2020).
Q. He, G. Cui, X. Zhang, F. Chen, S. Deng, H. Jin, Y. Li, Y. Yang, A game-theoretical approach for user allocation in edge computing environment. IEEE Trans. Parallel Distrib. Syst.31(3), 515–529 (2019).
X. Xu, X. Zhang, M. Khan, W. Dou, S. Xue, S. Yu, A balanced virtual machine scheduling method for energy-performance trade-offs in cyber-physical cloud systems. Futur. Gener. Comput. Syst.105:, 789–799 (2020). https://doi.org/10.1016/j.future.2017.08.057.
L. Qi, X. Zhang, S. Li, S. Wan, Y. Wen, W. Gong, Spatial-temporal data-driven service recommendation with privacy-preservation. Inf. Sci.515:, 91–102 (2020).
L. Sun, K. Zhou, S. Yang, Regional difference of household electricity consumption: an empirical study of Jiangsu, China. J. Clean. Prod.171:, 1415–1428 (2018).
C. A. Craig, S. Feng, Exploring utility organization electricity generation, residential electricity consumption, and energy efficiency: a climatic approach. Appl. Energy. 185:, 779–790 (2017).
P. Li, J. Li, Z. Huang, C. -Z. Gao, W. -B. Chen, K. Chen, Privacy-preserving outsourced classification in cloud computing. Clust. Comput.21(1), 277–286 (2018).
X. Xu, X. Liu, Z. Xu, C. Wang, S. Wan, X. Yang, Joint optimization of resource utilization and load balance with privacy preservation for edge services in 5g networks. Mob. Netw. Appl., 1–12 (2019). Netherland.
Acknowledgements
This research is supported by the National Natural Science Foundation of China under grant no. KFKT2020B06.
Author information
Authors and Affiliations
Contributions
Longji Feng, Shu Xu, Linghao Zhang, Jing Wu, Jidong Zhang, Zhenyu Wang, and Chengbo Chu conceived and designed the study. Haoyang Shi wrote the paper. All authors reviewed and edited the manuscript. All authors read and approved the final manuscript.
Corresponding author
Ethics declarations
Competing interests
The authors declare that they have no competing interests.
Additional information
Publisher’s Note
Springer Nature remains neutral with regard to jurisdictional claims in published maps and institutional affiliations.
Rights and permissions
Open Access This article is licensed under a Creative Commons Attribution 4.0 International License, which permits use, sharing, adaptation, distribution and reproduction in any medium or format, as long as you give appropriate credit to the original author(s) and the source, provide a link to the Creative Commons licence, and indicate if changes were made. The images or other third party material in this article are included in the article’s Creative Commons licence, unless indicated otherwise in a credit line to the material. If material is not included in the article’s Creative Commons licence and your intended use is not permitted by statutory regulation or exceeds the permitted use, you will need to obtain permission directly from the copyright holder. To view a copy of this licence, visit http://creativecommons.org/licenses/by/4.0/.
About this article

Cite this article
Feng, L., Xu, S., Zhang, L. et al. Anomaly detection for electricity consumption in cloud computing: framework, methods, applications, and challenges. J Wireless Com Network 2020, 194 (2020). https://doi.org/10.1186/s13638-020-01807-0
Received:
Accepted:
Published:
DOI: https://doi.org/10.1186/s13638-020-01807-0