
Correction to: BMC Ecol Evol (2021) 21:156 https://doi.org/10.1186/s12862-021-01881-y
Following the publication of the original article [1], we were notified that Figs. 1, 3, 4 were incomplete.
-
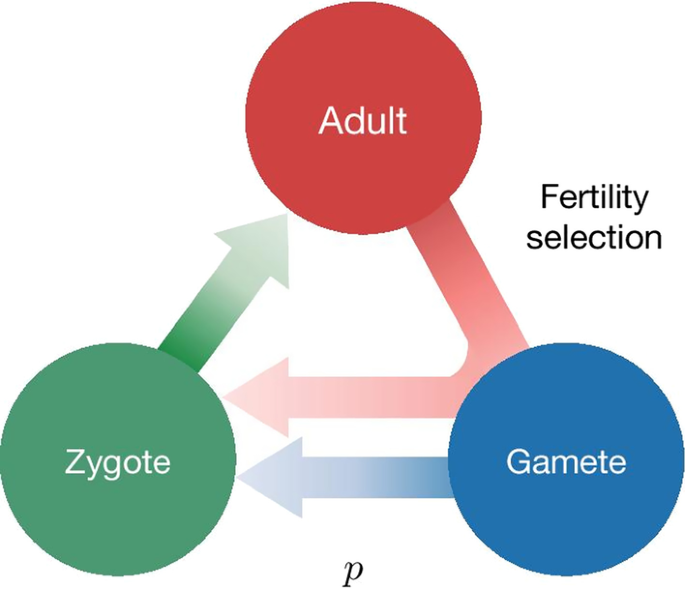
Originally published figures:


-
Corrected figures (Figs. 1, 3, 4):
Fig. 1 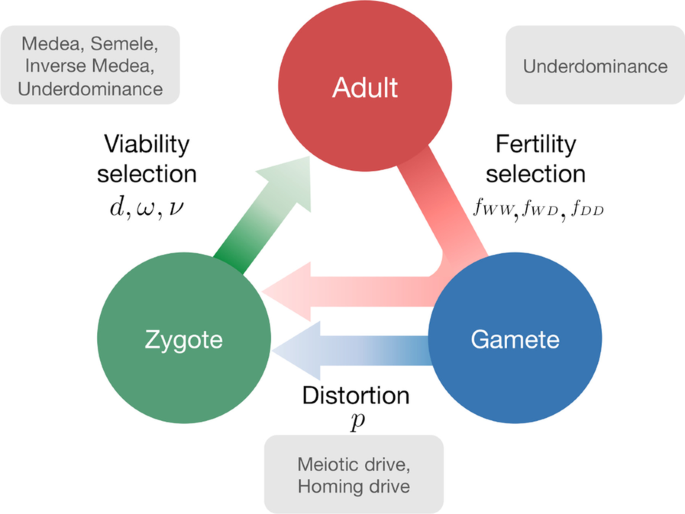
Lifecycle of an individual organism for a generic gene drive model. Assuming that individuals reproduce sexually and that the lifecycle has three stages, Adult, Gamete and Zygote. Adults produce gametes which combine to form zygotes. Zygotes grow up to become adults. Three factors can act during the life stages of an organism: distortion, viability selection and fertility selection (represented as arrows). Each can influence the probability of inheritance of a gene in the population and can be potentially manipulated to engineer gene drive constructs. Parameters, described in the text, are associated with each of the three arrows. Examples of named drive systems that can be generated are provided associated with the respective arrow
Fig. 3 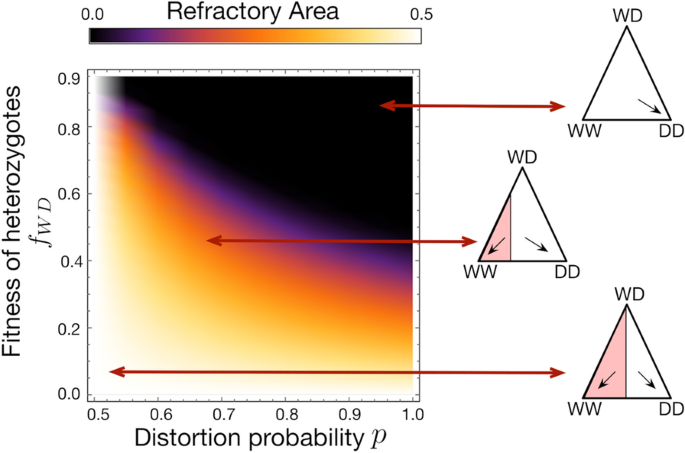
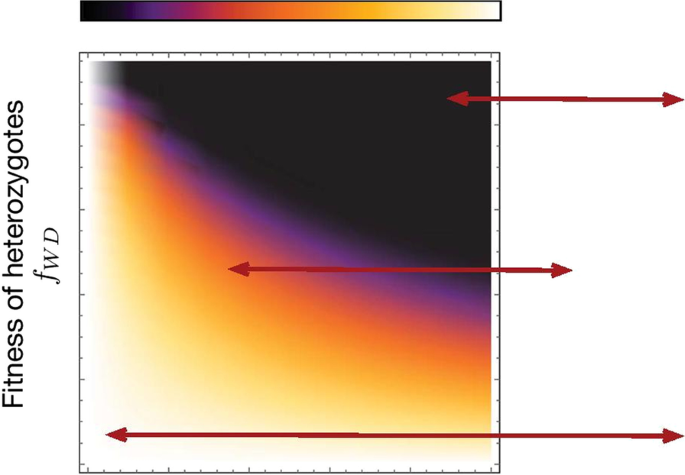
Heat-map showing the refractory zone with variation in distortion probability p and fertility fitness of heterozygotes fWD. Illustration of refractory zone for specific values of p and fWD of the heat-map. Trajectories of a de Finetti diagram when 2pfWD > fWW, drive individuals invade the wild population. Refractory zone is zero and is shown by black colour in the heatmap. p = 0.5 corresponds to’no distortion’ case. The values of other parameter is fixed to fWW = 1, fDD = 1
Fig. 4 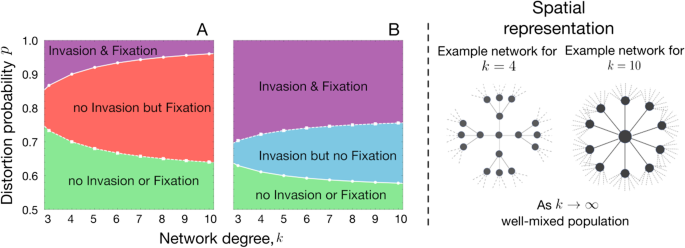
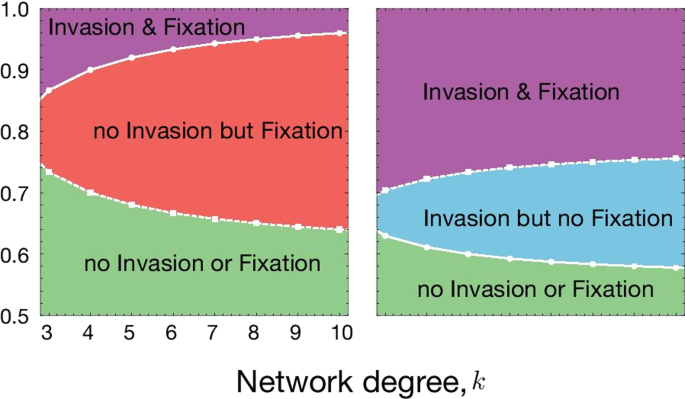
Spatial structure affects the condition for the invasion from rare and fixation of the driven gene. A Variation in invasion (full line with circles) and fixation (dashed line with squares) conditions with respect to network degree (k) and distortion parameter (p) for fWD = 0.5 and B fWD = 0.9. The values of other parameters are fixed to fWW = 1, fDD = 0.4. Population dynamics changes when the population becomes more structured on the Bethe lattice parameterized by k. Lower k means more structured population and higher k represents less structure (closer to well-mixed case). The change in population dynamics properties can be seen by the change in invasion/fixation condition and combinations of them, such as no invasion from rare but fixation, if sufficient drive individuals are released/migrate


The original article has been corrected.
Reference
Verma P, Guy Reeves R, Gokhale CS. A common gene drive language eases regulatory process and eco-evolutionary extensions. BMC Ecol Evol. 2021;21:156. https://doi.org/10.1186/s12862-021-01881-y.
Author information
Authors and Affiliations
Corresponding author
Additional information
Publisher's Note
Springer Nature remains neutral with regard to jurisdictional claims in published maps and institutional affiliations.
Rights and permissions
Open Access This article is licensed under a Creative Commons Attribution 4.0 International License, which permits use, sharing, adaptation, distribution and reproduction in any medium or format, as long as you give appropriate credit to the original author(s) and the source, provide a link to the Creative Commons licence, and indicate if changes were made. The images or other third party material in this article are included in the article's Creative Commons licence, unless indicated otherwise in a credit line to the material. If material is not included in the article's Creative Commons licence and your intended use is not permitted by statutory regulation or exceeds the permitted use, you will need to obtain permission directly from the copyright holder. To view a copy of this licence, visit http://creativecommons.org/licenses/by/4.0/. The Creative Commons Public Domain Dedication waiver (http://creativecommons.org/publicdomain/zero/1.0/) applies to the data made available in this article, unless otherwise stated in a credit line to the data.
About this article

Cite this article
Verma, P., Reeves, R.G. & Gokhale, C.S. Correction to: A common gene drive language eases regulatory process and eco-evolutionary extensions. BMC Ecol Evo 21, 195 (2021). https://doi.org/10.1186/s12862-021-01909-3
Published:
DOI: https://doi.org/10.1186/s12862-021-01909-3