
Abstract
Background and Objectives
Since there is no clear evidence in the literature to show how non-modified single-stranded DNA (ssDNA) drugs are metabolized in humans, we assessed the metabolism of BC 007, an ssDNA therapeutic, under development as a neutralizer of autoantibodies against G-protein-coupled receptors. In-vitro, investigating its stability in monkey plasma and serum, a successive 3′-exonuclease degradation resulting in several n–x degradation products has been previously reported. Here, we investigated the metabolism of BC 007 in humans after intravenous application to autoantibody-positive healthy subjects, in line with Phase I safety testing.
Methods
1H-NMR was applied for n–x degradation product search and beta-aminoisobutyric acid (bAIBA) measurement in urine; ultra-performance liquid chromatography–mass spectrometry was also used for the latter. Colorimetric assays were used for quantification of uric acid in serum and urine.
Results
Fast degradation prohibited the detection of the intermediate n–x degradation products in urine using 1H-NMR. Instead, NMR revealed a further downstream degradation product, bAIBA, which was also detected in serum shortly after initial application. The purine degradation product, uric acid, confirmed this finding of fast metabolism.
Conclusion
Fast and full degradation of BC 007, shown by nucleic bases degradation products, is one of the first reports about the fate of a ssDNA product in humans.
Avoid common mistakes on your manuscript.
This is the first investigation to show the very fast degradation of a thymidine- and guanosine-containing oligonucleotide drug, BC 007, in humans, down to the nucleic bases semi-final and final degradation products, beta-aminoisobutyric acid (bAIBA) and uric acid. |
The estimation of bAIBA in urine is a valuable parameter to follow the metabolism and excretion of BC 007, particularly since the less broken-down exonuclease products of BC 007 could not have been detected in urine. |
1 Introduction
The oligonucleotide sequence of BC 007 (formerly GS-522) was originally selected as a potential short-lasting thrombin inhibitor with a rapid onset of action for transient anticoagulation during coronary bypass graft surgery; however, it failed because of the lack of a persistent effect resulting in a sub-optimal dosing profile.
However, as the substance can neutralize pathogenic autoantibodies [1], it is now back to the center of interest and clinical evaluation. Therefore, metabolization of the substance in humans has again become an urgent issue.
Connected with the original development, Shaw et al. (1995) investigated the degradation of BC 007 in monkey serum and plasma under in vitro conditions [2]. These authors developed an anion-exchange HPLC method for the detection of the full-length sequence and its 3′-degradation products.
BC 007, a single-stranded DNA (ssDNA) 15-mer consisting of nine guanosine (purine nucleoside) and six thymidine (pyrimidine nucleoside) nucleosides of the following sequence 5′-GGTTGGTGTGGTTGG-3′, was successively degraded in their in vitro experiments, also showing in addition to the main peak of full length sequence, n-1 to n-6 in decreasing amounts when incubated for 2 h in monkey plasma at 37 °C [2]. However, since the “half-lives observed for GS-522 (BC 007) in various plasmas are (were) all greater than the observed in vivo elimination half-life reported in monkeys” the authors assumed “that in vivo plasma metabolism plays a minor role in the overall in vivo elimination” anyway [2].
With this limited information in mind, a NMR method was developed that could simultaneously detect both the full-length sequence and n-1 to n-4 while giving different NMR signals when binding onto the complementary sequence of BC 007. This method was applied to investigate the urine of subjects who received BC 007, in line with Phase I safety and tolerability testing.
Additionally, semi-final and final degradation products of the pyrimidine and purine metabolism, beta-aminoisobutyric acid (bAIBA) and uric acid, respectively, were measured. The results, which enable clarification of BC 007 metabolism, are described here.
2 Materials and Methods
2.1 Materials
Samples were obtained from participants of the Phase I trial testing the safety and tolerability of BC 007 (NCT02955420), EudraCT-no. 2015-005236-18.
In a randomized, double-blind, placebo-controlled single ascending dose study, 3 cohorts (each consisting of 8 male healthy subjects aged 18–45 years) were dosed once with 15, 50, and 150 mg of BC 007 intravenously (i.v.) (over 20 min). An additional 8 elderly healthy subjects of both sexes (55–70 years) received 150 mg BC007 or placebo. Afterwards, in an open-labeled study, 7 cohorts of 6 elderly volunteers each with evidence for autoantibodies against G-protein-coupled receptors (55–75 years) were tested with a single dose of 50, 150, 300, 450, 750, 1350, and 1900 mg BC 007. Infusion duration increased from 20 min (50 and 150 mg) over 40 min (300, 450, and 750 mg) and 75 min (1350 mg) up to 105 min (1900 mg). Lower doses were partially applied with a combination of bolus and infusion, while the higher doses (1350 and 1900 mg) were applied as infusion only.
Each participant signed an informed consent form.
Subject safety was carefully monitored (electrocardiogram, blood pressure, clinical chemistry safety parameters, injection site reactions, physical examination, adverse events). Blood samples were taken from before the infusion began until 24 h after for clinical chemistry, coagulation, hematological and pharmacokinetic analysis. Urine was collected for analysis.
2.2 NMR Sample Preparation for BC 007 Full Length Detection and Search for n-1 to n-4 Degradation Products in Urine Samples
Six 50-mL urine samples from subjects in the Phase 1 study were concentrated to volumes of < 1 mL using Microsep Advance Centrifugal Devices (MWCO 10 K; Pall Corporation, MI, USA). All centrifugations were performed on a Hettich laboratory centrifuge (EBA20; Hettich Lab Technology, Tuttlingen, Germany) using an eight-place fixed angle rotor at room temperature. In preliminary experiments, it was found that BC 007 and the degradation products n-1 to n-4, although they are below the cutoff limit, do not pass through the filter material. The filters were washed three times with distilled water, were concentrated to a volume of < 1 mL, and the resulting supernatants were transferred into an Eppendorf tube containing 228 nmol complementary sequence of BC 007. One hundred μL of deuterium oxide (D2O) was added to the solution and diluted to 1 mL with distilled H2O. The 1H-NMR spectra were recorded analogously according to the method described below.
2.3 bAIBA Detection in Urine and Plasma
2.3.1 NMR for Detection of bAIBA in Urine Samples
A 600 MHz Bruker spectrometer (Bruker Biospin, Rheinstetten, Germany) was used for one-dimensional (1D) proton 1H-NMR data acquisition of urine samples. 1D spectra were acquired using excitation sculpting (Bruker Topspin 3.0 pulse sequence library ‘zgesgp’, [3]) for suppression of water resonance with a relaxation delay of 8 s and a 30° flip angle to guarantee near complete longitudinal relaxation at a reasonable measuring time, and with a spectral width of 24 ppm and 512 transients. Data processing included phase correction, which was performed manually for each spectrum, and baseline correction over the entire spectral range. The baseline was additionally corrected over the integrated regions of the methyl signal of bAIBA. All spectra were aligned and normalized to 3-(trimethylsilyl)-propionic acid-d4-sodium salt (TSP) reference signal. NMR resonances of the methyl signal of bAIBA were quantified using the peak deconvolution tool of Topspin 3.0. Manual peak picking and deconvolution were performed to delineate the signal integrations and calculate the bAIBA concentration based on the standard TSP signal. The methyl doublet of bAIBA at 1.2 ppm was apparently superimposed by two weak signals. The proportion of these signals in the total intensity of the bAIBA doublet was subtracted after deconvolution. The trimethyl group of TSP was not overlapped by signals from urine components.
Although the NMR method does not require calibration curves for signal quantification, a calibration curve was prepared from bAIBA-spiked urine samples of an untreated person. With this calibration curve, the processed and normalized bAIBA signals of the real samples were quantified in addition to quantification against TSP. Both methods resulted in good agreement.
2.3.2 Ultra-Performance Liquid Chromatography–Tandem Mass Spectrometry (UPLC-MS/MS) for Detection of bAIBA in Urine and Plasma Samples
bAIBA in urine and plasma using UPLC-MS/MS was measured by Medizinisches Versorgungszentrum Dr. Eberhard & Partner Dortmund (Dortmund, Germany). Briefly, prior to analysis, all plasma and urine samples, calibration standards and quality control samples were thawed and allowed to equilibrate at room temperature. Then, 50 µl of each were transferred into Eppendorf reaction vials. Internal standard (200 µl) (cell-free amino acid mixture–13C,15N; Sigma Aldrich, Germany; 500 µl in 200 ml methanol) was added to each vial which was then vortexed for 15 s. After a short incubation period at room temperature for 15 min, all vials were repeatedly vortexed for 15 s and centrifuged at 16,000 RCF for 5 min. For derivatization, 10 µl of supernatant was transferred into Eppendorf reaction vials and mixed with 70 µl of borate buffer and 20 µl derivatization reagent 6-aminoquinolyl-N-hydroxysuccinimidyl carbamate in acetonitrile (included in AccQ-Tag™ Ultra Derivatization Kit, Waters, Germany). All vials were incubated for 10 min at room temperature. Subsequently, all samples were again mixed with 70 µl borate buffer and transferred to sample cups. Chromatographic separation of the three isobars, alpha-, beta- and gamma-aminobutyric acid, was carried out on an ACQUITY UPLC® system with HSS T3 column (1.8 µm; 2.1 mm × 100 mm, Waters, Germany) using 0.1% formic acid in ULC water and 0.1% formic acid in acetonitrile as mobile phase. Quantification was performed using a Micromass Quattro Premier-XE (Waters, Germany) in ES + mode. MassLynx™ NT version 4.1 (Waters, Germany) was used to control all parameters of LC and MS/MS and for quantification.
Validation of the quantitative mass spectrometry includes sensitivity, linearity, precision, stability, matrix effects and accuracy. For sensitivity testing, five levels of bAIBA were analyzed for calculating the calibration curve (r2). Each sample was prepared twice. Concentrations were at 5/4/3/2/1/0 µM. For limit of detection (LOD) the signal-to-noise ratio should be > 3. Limit of quantification is the lowest concentration of analyte that can be quantified. The coefficient of variation (CV) should be < 20%, and the accuracy has to be within ± 20%. The signal-to-noise ratio is defined as > 5.
For calculating calibration linearity (r2), seven calibration levels were measured. Each calibration level was prepared twice. The calibration data were plotted on a calibration graph. Concentrations were on x-axis and signals were on y-axis. The correlation coefficient (r2) should be at least 0.997.
To estimate the intra-assay precision, 10 samples of two concentrations each (8.8 µM and 88 µM) were measured. Additionally, the day by day CV was determined; a CV under 10% was accepted.
Stability was tested over a range of 10 days. Samples were stored under three conditions, ambient temperature, 2–8 °C and frozen < − 20 °C. The accepted deviation was < 10%.
To exclude matrix effects, three samples were measured natively. Subsequently samples were diluted with physiological sodium chloride solution (w = 0.9%). The recovery rate was calculated as follows:
The laboratory participates twice a year in a ring trial, including 32 amino acids and biogenic amines. Unfortunately, bAIBA is not included. For this reason, we performed a comparative measurement with another laboratory.
The percentage of measured bAIBA (sum of bAIBA over the whole urine collection period of 24 h after application) compared to the maximal possible to find amount of bAIBA was computed from the mass spectrometry data as follows: 1 mol BC 007 results in 6 mol thymine nucleotides after complete cleavage. By now including the molecular weights of BC 007 of approximately 4800 g/mol and bAIBA of 103.12 g/mol and the applied amount of BC 007/subject in grams, the maximal detectable amount of bAIBA can be calculated as 0.058, 0.097, 0.174, and 0.245 g bAIBA at the applied doses of 0.45, 0.75, 1.35 and 1.9 g BC 007, respectively, if 100% of the applied BC 007 is metabolized to bAIBA. Then, the amount of bAIBA found (i.e., the sum of all collecting intervals minus the corresponding pre-dose values) was set in relation to the maximal detectable amount of bAIBA and was expressed as [%].
2.4 Uric Acid Detection in Urine and Serum
2.4.1 Uric Acid in Urine Samples
Uric acid in the urine samples was measured in duplicate using the test kit Fluitest® UA (Uric Acid 5 + 1) from Analyticon ® Biotechnologies AG (Lichtenfels, Germany) which was adapted for analysis on a 96-well plate. It is a kinetic colorimetric assay, based on uricase-mediated decomposition of uric acid to allantoin, carbon dioxide, and hydrogen peroxide. The latter forms a quinone diimine dye in the presence of 4-aminoantipyrine, DHBSA, and peroxidase, which is measurable at 546 nm. The shift in color is directly proportional to the uric acid concentration. A urine control set from Analyticon® Biotechnologies AG (Lichtenfels, Germany) with two different uric acid levels (level 1: 413–703 µmol/L and level 2: 722–1229 µmol/L) was used as quality control during measurement to ensure the validity of each assay. The assay reportable range was between 11.9 and 1487 µmol/L. Samples with uric acid concentrations > 1487 µmol/L were diluted 1 to 2 and 1 to 4 in distilled water (Water HPLC gradient grade, Carl Roth GmbH).
Since the measurements were run from previously frozen samples, the influence of freezing/thawing on the recovery of uric acid in control urine (Analyticon® Biotechnologies AG) was tested previously, excluding major disturbances. Five freeze/thaw cycles were tested at two concentration levels (control level 1: 413–703 µmol/L and control level 2: 722–1229 µmol/L) with recovery of 98% after the 5th freeze/thaw cycle compared to the fresh urine control sample.
2.4.2 Uric acid in Serum Samples
Uric acid in serum was measured by Synlab Pharma Institute (a division of Synlab Umweltinstitut GmbH), on behalf of PAREXEL International GmbH, Berlin, Germany, using a colorimetric assay (Beckman Coulter assay OSR6 series) of the following principle: “Uric acid is converted by uricase to allantoin and hydrogen peroxide. The formed hydrogen peroxide reacts with N,N-bis(4-sulfobutyl)-3,5-dimethylaniline, disodium salt (MADB) and 4-aminophenazone in the presence of peroxidase to produce a chromophore, which is read biochromatically at 660/800 nm. The amount of dye formed is proportional to the uric acid concentration in the sample”. The reference range was 208.3–428.4 µmol/L for male subjects and 154.7–357.0 µmol/L for female subjects.
Uric acid was measured in serum samples collected during the treatment period at 0 min (pre-dose), 20 min, 4 h, and 24 h after bolus and infusion or infusion only of 450 mg (application duration 40 min) and 750 mg (application duration 40 min) BC 007 or 0 min, 50 min, 80 min, 4 h, and 24 h after infusion of 1350 mg BC 007 given over 75 min. After the infusion of 1900 mg BC 007 over 105 min, uric acid was measured in serum samples during the treatment period at 0 min (pre-dose), 50 min, 110 min, 4 h and 24 h.
2.5 Statistics
For statistical evaluation, a 1-sided paired Students t test was applied (Excel Office 365). Statistical significance was given and indicated as α = 0.05–0.01 (*), α = 0.01–0.001 (**), α ≤ 0.001 (***).
3 Results
3.1 NMR for Detection of Full-Length BC 007 and Degradation Products in Urine Samples
A 600 MHz NMR method for the simultaneous detection of full length BC 007 and successive degradation products up to n-4 was developed, using a BC 007 complementary sequence (5′-CCAACCACACCAACC-3′) which was able to bind and hybridize full length and n-1, n-2, n-3, and n-4 simultaneously, resulting in different specific NMR spectra able to discriminate single different hybridization products when spiked in urine (Fig. 1).

Nuclear magnetic resonance (NMR) spectra of hybridization products of complementary BC 007 with BC 007 full length (a) and n-1 to n-4 degradation products (b–e) at 288 Kelvin, all spiked in human urine
Further degradation products (n-5, n-6…) led to non-uniform hybridization products, resulting in strong line broadening of the corresponding NMR signals, making an evaluation impossible.
As shown in Fig. 1, spectra of the four double strands between BC 007 to BC 007n-4 and the complementary sequence of BC 007, allow the identification of five possible degradation products.
It can also be seen from Fig. 1 that the first and the last pair of the double strand do not form stable H-bonds and, for this reason, no NMR signals can be observed for these imino protons. For the double strand of BC 007 with its complementary sequence, this yields six thymine imino protons and seven guanine imino protons in the spectrum. Analogously, for the double strand of BC 007n-4 and the BC 007 complementary sequence, 4T and 5G imino signals are observed.
However, the LOD with 4 µM was relatively high (spiked urine samples). When testing urine samples from subjects who received infusions of 750 mg or 1350 mg BC 007 over 40 min or 75 min, full length BC 007 was barely detectable using this method and, surprisingly, no degradation products (n–x) were observed.
3.2 bAIBA Determination in Urine Samples Using NMR
Looking at the NMR spectra for further breakdown products, only catalytic metabolites of the pyrimidines (thymidine), ending in bAIBA and its further breakdown products such as methylmalonic acid semialdehyde, would theoretically be detectable using this NMR technology (Fig. 2). It should be noted, however, that methylmalonic acid semialdehyde represents an unstable substance, which is, therefore, not commercially available for comparison purposes. Because of its instability, no conclusions about its formation can be drawn from the obtained spectra.

Nuclear magnetic resonance (NMR) spectra of beta-amino butyric acid (bAIBA) in deuterium oxide (D2O) (a), a urine sample spiked with 10 mg bAIBA/50 mL urine (b), and a real urine sample from the clinical study (c)
In the urine samples collected at 0–2, 2–4, 4–8, 8–12, and 12–24 h after infusion of 1350 mg BC 007 over 75 min, bAIBA was measured (Fig. 3) and quantified against the internal standard TSP (Fig. 4a). There are particularly striking differences in bAIBA content at the different sampling intervals, the highest being 2–4 h after the end of application.

Nuclear magnetic resonance (NMR) spectra of urine samples collected at 0–2 h (2 h), 2–4 h (4 h), 4–8 h (8 h), 8–12 h (12 h), and 12–24 h (24 h) after infusion of 1350 mg BC 007. 3-(Trimethylsilyl)-propionic acid-d4-sodium salt (TSP) served as internal standard

Total beta-aminoisobutyric acid (bAIBA) amount in urine samples in (mg) of single subjects (triangle-1, diamond-2, filled triangle-3, filled diamond-4, circle-5, filled circle-6) collected at 0–2 h, 2–4 h, 4–8 h, 8–12 h, and 12–24 h (respective dot at corresponding time axis) after infusion of 1350 mg BC 007 (over 75 min, infusion only) measured via nuclear magnetic resonance (NMR) (a) or ultra-performance liquid chromatography–tandem mass spectrometry (UPLC-MS/MS) (b). It has to be noted that the values were calculated from the total amount of detected bAIBA and not from the difference from the baseline value, which resulted in an overestimation, including the endogenously formed bAIBA
The further downstream metabolite, methylmalonic acid semialdehyde, was not detected (Fig. 3).
3.3 bAIBA Determination in Urine Samples Using UPLC-MS/MS
For verification of the NMR findings of the urine bAIBA concentration, a routine UPLC-MS/MS method was used (Fig. 4b), showing only small deviations from the NMR data (Fig. 4a). This is a way of confirming results of the even non-validated NMR method. Applying this routine UPLC-MS/MS method, the bAIBA concentration of the different dosing cohorts (450, 750, 1350 and 1900 mg) was tested as depicted in Fig. 5. Here, the differences to the baseline (pre-dose) levels are shown. It became obvious that with all dosing cohorts, the maximum of the urine bAIBA concentration was reached at the sampling interval of 0–4 or 2–4 h, when taken at 1350 and 1900 mg BC 007 cohorts, which declined to pre-dose levels around 8–12 h after application.

Difference in beta-aminoisobutyric acid (bAIBA) urine concentration from the baseline value [ng/mL] measured via ultra-performance liquid chromatography–tandem mass spectrometry (UPLC-MS/MS). Samples were collected at different time intervals as indicated in the figure. Dosing was 450 mg (over 40 min, bolus and infusion or infusion only) (a), 750 mg (over 40 min, bolus and infusion or infusion only) (b), 1350 mg (over 75 min, infusion only) (c) and 1900 mg (over 105 min, infusion only) (d). Statistical significance was α = 0.05–0.01 (*), α = 0.01–0.001 (**), α ≤ 0.001 (***), 1-sided paired Students t test, the values at each time point were compared to the baseline (pre-dose) level
When looking at the bAIBA levels not only from the sole bAIBA perspective, but also including its relationship to the level of creatinine in urine [mmol bAIBA/mol creatinine], which is the basis on which this parameter is routinely assessed, at the highest dose of 1900 mg the highest measured value of 458 mmol/mol creatinine (2–4 h after application) exceeded the normal upper value of 57.7 mmol/mol by about 8 times. At 8–12 h after application, the value fell back below its upper normal value (45 mmol/mol creatinine). The added-up amounts of bAIBA of the single collecting intervals minus the pre-dose levels were set in relation to the maximal, possibly to find amounts of bAIBA of the single dosing groups. It revealed that − 1% ± 18% and 5% ± 6% were found at lower dosing cohorts of 450 mg and 750 mg, respectively, while this percentage increased to 10% ± 11% and 23% ± 6%, at the higher dosing cohorts of 1350 mg and 1900 mg, respectively.
3.4 bAIBA Determination in Plasma Samples Using UPLC-MS/MS
bAIBA plasma concentration revealed a rapid increase starting at 3 min after the initial application (start of bolus/infusion) of BC 007, which increased to its maximum shortly after the infusion ended and kept its maximum for about 20 min at 450 mg BC 007 and 80 min at 750 mg BC 007, before being followed by a slow decline back to baseline levels (Fig. 6a, b). A similar but more pronounced kinetic was seen at doses of 1350 and 1900 mg BC 007 (Fig. 6c, d). The ratio of the resulting concentration maxima of the formed bAIBA (773 ± 156 ng/mL to 1184 ± 52 ng/mL to 2107 ± 367 ng/mL) was approximately equal to the ratios of the employed concentrations of BC 007 (450 to 750 to 1350 mg, respectively) up to the concentration of 1350 mg. Concentration maxima ratios expressed in numbers are 1:1.53:2.73 compared to dose ratios of 1:1.67:3. Beginning with a dose of 1350 mg, saturation of the decomposing enzymes was reached. The higher dose of 1900 mg had a dose ratio of 4.2 compared to the 450 mg dose (1:4.2), while the concentration maximum of bAIBA remained at 2458 ± 482 ng/mL (130 min) which corresponded to a ratio of 1:3.18 compared to the 450 mg group and remained, therefore, closer to the one of its preceding dose of 750 mg. The corresponding baseline (pre-dose) levels for the different dosing cohorts amounted to 297 ± 67 ng/mL (450 mg cohort), 308 ± 33 ng/mL (750 mg cohort), 423 ± 65 ng/mL (1350 mg cohort), and 361 ± 92 ng/mL (1900 mg cohort). The dose-corresponding BC 007 infusion rates were 7.5 and 11.25 mg/min (450 mg with or without bolus), 15.0 and 18.75 mg/min (750 mg with or without bolus), and 18 mg/min (1350 mg and 1900 mg without bolus).

Beta-aminoisobutyric acid (bAIBA) plasma concentration in (ng/mL) measured via ultra-performance liquid chromatography–tandem mass spectrometry (UPLC-MS/MS). Plasma samples collected at different time intervals as indicated in the figures. BC 007 dosing was 450 mg (over 40 min, bolus and infusion or infusion only) (a), 750 mg (over 40 min, bolus and infusion or infusion only) (b), 1350 mg (over 75 min, infusion only) (c), and 1900 mg (over 105 min, infusion only) (d). Statistical significance of the data at single time-points compared to 0 min was α = 0.05–0.01 (*), α = 0.01–0.001 (**), α ≤ 0.001 (***), 1-sided Students paired t test, and is depicted in the table accompanying the figure
In general, up to a dose of 750 mg BC 007, all of the bAIBA plasma concentrations were below or around the reported normal upper value of 1031 ng/mL (10 µM [4]). The highest measured single value of 3042 ng/mL (29.5 µmol/L) at the dose of 1900 mg BC 007 (at 115–140 min) exceeded this range by a factor of 3.
3.5 Uric Acid Determination in Serum Samples Using a Colorimetric Assay
Figure 7 shows the increase in uric acid from the corresponding pre-dose levels. It became obvious that a significant increase in the level of uric acid was measurable, starting at a dose of 450 mg BC 007 (Fig. 7b).

Baseline corrected uric acid (UA) serum concentration in samples collected at different time intervals as indicated in the figure. Dosing was 450 mg (over 40 min, bolus and infusion or infusion only) (a), 750 mg (over 40 min, bolus and infusion or infusion only) (b), 1350 mg (over 75 min, infusion only) (c), and 1900 mg (over 105 min, infusion only) (d) and an overview over all dosing regimes as well as including a follow-up check-up at 168 h after application (e). Statistical significance of the data at single time-points compared to 0 min was α = 0.05–0.01 (*), α = 0.01–0.001 (**), α ≤ 0.001 (***), 1-sided Students paired t test. At the dose of 750 mg BC 007, significance occurred only if one value at 0 min (pre-dose), exceeding the normal range, was taken out
Furthermore, similar to plasma bAIBA, a fast increase in uric acid was detected shortly after starting BC 007 application, which reached its maximum at approximately 4 h after the initial application, or at 1.33 and 1.83 h as seen with 1350 and 1900 mg BC 007, respectively, since the earlier sampling time-points were only introduced here. With respect to the absolute values, the highest measured value of 484 ± 76 µmol/L at approximately 1.83 h after the initial application at the highest dose of 1900 mg BC 007 slightly exceeded the normal upper range of 357 µmol/L for females (18–99 years, range 154.7–357 µmol/L) and 428 µmol/L for males (18–99 years, range 208–428 µmol/L). However, in this cohort, the mean of the pre-dose uric acid concentration already amounted to 364 ± 77 µmol/L. Furthermore, at the last treatment sampling time-point (24 h) the absolute value was already down to its pre-dose level, showing 364 ± 77 µmol/L.
3.6 Uric Acid Quantification in Urine Samples Using a Colorimetric Assay
In urine, the uric acid concentration was measured using the ‘ready to use’ colorimetric kit as outlined in “Materials and methods”.
The data revealed an early increase in urine uric acid; however, this was not significant because of the deviation within the single cohorts (Fig. 8).
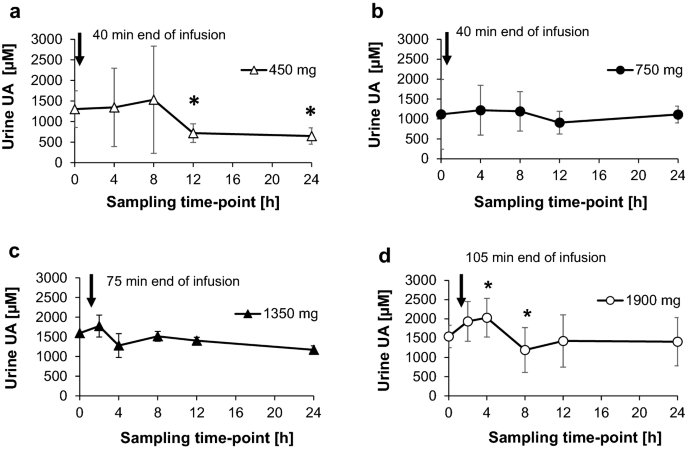
Uric acid (UA) urine concentration (µM). Samples were collected at different time intervals as indicated in the figure. Dosing was 450 mg (over 40 min, bolus and infusion or infusion only) (a), 750 mg (over 40 min, bolus and infusion or infusion only) (b), 1350 mg (over 75 min, infusion only) (c), and 1900 mg (over 105 min, infusion only) (d). Statistical significance was α = 0.05–0.01 (*), α = 0.01–0.001 (**), α ≤ 0.001 (***), 1-sided Students paired t test, the values at each time point were compared to the baseline (pre-dose) level
In each case, the increased uric acid level returned to the corresponding pre-dose level at 8 h after BC 007 application or even slightly below, as in the case of the 450 mg cohort (Fig. 8a).
With regard to the absolute amounts of the 24-h urine specimens, the highest amount of 615 ± 78 mg/24 h at the highest dose of 1900 mg BC 007 did not exceed the normal upper range of 1000 mg/24 h.
4 Discussion
Compared to the efforts invested in the development of DNA therapeutics [5, 6], little has been reported about the exact metabolism and excretion when such DNA therapeutic agents are applied in humans. There are also few reports in the literature.
Some of the rare sources, especially of the non-modified small chain oligonucleotides, identified the kidneys as the main route of excretion, at least in animals, as shown by Ali et al. for the 21-mer EPI-2010 in rabbits [7]. A catabolism to nucleotides was also stated by the Oligonucleotide Safety Working Group (OSWG) in 2012 [8]. For a DNA-based drug, defibrotide, which is a polydisperse collection of the sodium salt of predominantly single-stranded oligodeoxyribonucleotides obtained from porcine intestinal mucosa and prepared by controled depolymerization of DNA [9], the Assessment report of the EMEA (EMEA/H/C/002393, 25 July 2013) stated the finding of the in vivo metabolism in rabbits assessed by plasma analysis following defibrotide administration by intravenous infusion for 2 h, four times over a period of 24 h at 320 mg/kg/day. The in vivo study demonstrated the occurrence of nucleotides and nucleosides with free bases, resulting from the expected enzymatic degradation of the ssDNA. According to this assessment report, elimination in rats is mainly via urine and was very rapid, and the majority of the administered radioactive defibrotide was excreted by 24 h post-dosing [9]; together these stress the tendency of fast and complete in vivo degradation and excretion in animals.
Here, we reported investigations about the degradation and excretion of the 15-mer DNA product BC 007 in human plasma and urine. Even though the original intention was to detect degradation products of n-1 to n-4 of BC 007 in the urine of treated subjects, according to the in vitro and ex vivo findings of Shaw et al. [2], bAIBA was also anticipated to be suitable to follow the fate of BC 007 in humans. bAIBA is a degradation product not only of valine (S-enantiomer) [10], but also of thymidine (R-enantiomer) in particular [11, 12]. Moreover, Truhaut et al. [11] and Mazurik et al. [12] have already published studies investigating urinary ß-amino isobutyric acid in the mouse, elimination after intravenous administration of DNA, and the excretion of thymidine and beta-aminoisobutyric acid (bAIBA) in rats as a function of the administered dose of thymidine and DNA as early as 1965 and 1968, respectively. The n–x degradation products of BC 007 were, however, not detected in urine which was due to the combination of low specimen concentration and limit of quantification using the NMR hybridization method. Nevertheless, the further downstream degradation product, bAIBA, was detectable. The fast increase in the bAIBA concentration seen in urine was also confirmed when looking at its serum levels. Together these both stress the very fast and very complete decay of BC 007 in humans. This also explains why no n–x degradation products could be found.
bAIBA is, therefore, a perfect parameter to follow the degradation of pyrimidine-containing nucleotide products in humans.
With respect to its physiological occurrence, it can be stated that in some laboratory manuals, bAIBA shows reference values in serum of up to 10 µM throughout all age classes [4]. In urine, however, bAIBA showed low reference levels [13], and is reported by some sources to almost be undetectable since it is further catabolized by R(-)-b-aminoisobutyrate aminotransferase (also named alanine-glyoxylate aminotransferase 2 (AGXT2)) to methylmalonic acid semialdehyde and propionyl-CoA.
Interestingly, about 2–20% of Caucasians and up to 50% of the Asian population are reported to have a deficiency in this aminotansferase [14, 15], which results in an increased bAIBA level in urine without any pathological effects. Increased bAIBA levels in urine have also been reported in pathological situations when large amounts of DNA are degraded, such as malignancies [15, 16], body irradiation [17], and short-term starvation [18].
A recent study by Kittel et al. [19], applying HPLC–MS/MS analytics for bAIBA detection, determined normal mean values in plasma of about 0.98 µM (0.79–1.22 µM) in AGXT2 wild-type subjects (the majority of their investigated pool) and values of up to 2.72 µM (the highest value of a single case) in the minority of investigated subjects, being homozygous for a specific single nucleotide polymorphism of AGXT2 (SNP rs 37369). In urine, these authors reported a mean of 42.5 µM (4.4 mg/L) bAIBA, when re-calculating from their mean bAIBA value given as [µmol/g creatinine] and the mean creatinine value. It increased up to means of 117 µM (12.05 mg/L) bAIBA and even 1243 µM (128 mg/L) bAIBA, when looking at the same, but rare, single nucleotide polymorphism. For comparison, all the pre-dose levels from this study taken together amounted to a value of 12.8 ± 8.3 mg/L.
Despite the differences found in the published physiological ranges of bAIBA (probably due to different measuring techniques), it becomes clear that the human body obviously shows a high margin for an increase in bAIBA without any pathological effects [20].
Looking at the differences in the amount of bAIBA found in urine between the single subjects of a cohort in this study, as exemplarily shown for the 1350 mg cohort in Fig. 4b, it was thought that in subjects showing the lowest amounts a possible further catabolism into methylmalonic acid semialdehyde and propionyl-CoA might have occurred [10]. However, no methylmalonic acid semialdehyde was detected, which may exclude a further breakdown within this 24-h observation time frame; however, final conclusions based on this metabolite should not be drawn. Furthermore, the racemization of (R)-methylmalonic semialdehyde via conversion to its (S) enantiomer was outlined by Roberts et al. [21], altogether making quantification extremely complicated. On the other hand, propionyl-CoA occurrence, as a second further breakdown product of bAIBA, has multiple origins that exclude its exploitation for the clarification of BC 007 metabolism.
Quantification of the metabolites, as a kind of recovery analysis of the applied amount of drug, becomes even more complicated, since at almost all stages of DNA degradation, the metabolites are also starting substances or building blocks, as in the case of nucleotides, starting the DNA synthesis salvation pathway [22]. Furthermore, besides the recycling of nucleotides, further downstream metabolites are also recycled, delivering components, for example, for the energy household (GTP) or second messengers such as cGMP. This is all common knowledge and already an obligatory part of educational text books about the topic [23]. Just by using this non-modified ssDNA, BC 007 might also serve as a valuable raw material in salvage pathways. Only the excess of immediately re-useable components will be excreted. This is reflected in the parallel increase of bAIBA recovery in urine with increasing applied doses, and has been previously investigated and reported [11]. This will explain while Reyderman and Stavchansky [24] observed a relatively long elimination half-life in some organs while investigating the pharmacokinetics and biodistribution of a nucleotide-based thrombin inhibitor in rats, using a radioactively labeled sequence.
In our in vivo study in humans, full-length BC 007 in urine was almost negligible and BC 007 n-1 to n-4 were not detectable. Whether the obviously not easily detectable intermediate break-down products are the reason, why there is hardly any literature on the metabolism of oligonucleotide drugs in humans, is pure speculation. The analytics of bAIBA and uric acid are perfectly able to circumvent any shortage in this respect; bAIBA might serve as the perfect biomarker, able to follow the fate of thymidine-containing DNA therapeutics in humans.
This metabolite could show that the conclusion drawn by Shaw et al. [2] from their plasma/serum in vitro-limited metabolism data that in vivo plasma metabolism plays a minor role in the overall in vivo elimination must be reviewed critically. In-vivo, metabolism is fast and more complete in humans, down to final degradation products and contributes to the overall elimination, which showed a half-life of about 4 min at the lower doses up to 750 mg BC 007 [1].
5 Conclusions
The 15-mer ssDNA drug, BC 007, was rapidly catabolized into the semi-final and final degradation products of its nucleic bases thymidine and guanosine, bAIBA and uric acid, respectively, which were detectable in blood and urine.
The estimation of bAIBA, especially in urine, is a valuable parameter to follow the metabolism and excretion of the drug, which should also hold true for other thymidine-containing DNA-based drugs. Increased bAIBA levels do not bear any pathological consequences as already seen by physiologically increased levels and the excellent result of the safety and tolerability assessment of BC 007 (phase I) [1].
bAIBA levels declined back to the pre-dose level at 8–12 h after application. Measurement of uric acid in serum confirmed the fast degradation of BC 007. The levels of uric acid in urine and in serum that were reached after application of 1300 mg or even 1900 mg BC 007 never or only slightly exceeded physiological concentrations, respectively.
Knowledge of the metabolism of DNA therapeutics is an encouraging prerequisite for exploiting the potential of these drugs in the treatment of various diseases.
References
Mueller J, Haberland A, Becker N-P, Wenzel K, Wallukat G, Goettel P, et al. The DNA-based therapeutic agent bc 007 completely neutralizes agonistic autoantibodies directed against β1-adrenoceptors: results of a phase 1 trial. J Am Coll Cardiol. 2018;71:A645.
Shaw JP, Fishback JA, Cundy KC, Lee WA. A novel oligodeoxynucleotide inhibitor of thrombin I In vitro metabolic stability in plasma and serum. Pharm Res. 1995;12:1937–42.
Hwang TL, Shaka AJ. Water suppression that works. Excitation sculpting using arbitrary wave-forms and pulsed-field gradients [Internet]. J Mag Reson. Ser. A. 1995. https://ac.els-cdn.com/S1064185885710479/1-s2.0-S1064185885710479-main.pdf?_tid=spdf-8173958a-b5a5-4ca1-b01e-31a2506cc3a0&acdnat=1519745841_0f53ed3785ccd92c18e9cff873485a52. Accessed 27 Feb 2018.
Laborlexikon: altersabhängige Normwerte für Aminosäuren im Serum ≫ Facharztwissen für alle! ≪ [Internet]. [cited 2018 Mar 29]. http://www.laborlexikon.de/Lexikon/Tabellen/03-Aminosaeuren_im_Serum.htm.
Lundin KE, Gissberg O, Smith CIE. Oligonucleotide therapies: the past and the present. Hum Gene Ther. 2015;26:475–85.
Stein CA, Castanotto D. FDA-approved oligonucleotide therapies in 2017. Mol Ther J Am Soc Gene Ther. 2017;25:1069–75.
Ali S, Leonard SA, Kukoly CA, Metzger WJ, Wooles WR, McGinty JF, et al. Absorption, distribution, metabolism, and excretion of a respirable antisense oligonucleotide for asthma. Am J Respir Crit Care Med. 2001;163:989–93.
Schubert D, Levin AA, Kornbrust D, Berman CL, Cavagnaro J, Henry S, et al. The oligonucleotide safety working group (OSWG). Nucleic Acid Ther. 2012;22:211–2.
WC500153152.pdf [Internet]. http://www.ema.europa.eu/docs/en_GB/document_library/EPAR_-_Public_assessment_report/human/002393/WC500153152.pdf. Accessed 7 Feb 2018.
Podebrad F, Heil M, Beck T, Mosandl A, Sewell AC, Böhles H. Stereodifferentiation of 3-hydroxyisobutyric- and 3-aminoisobutyric acid in human urine by enantioselective multidimensional capillary gas chromatography-mass spectrometry. Clin Chim Acta Int J Clin Chem. 2000;292:93–105.
Truhaut R, Delacoux E, Paoletti C. Urinary beta-amino isobutyric acid in the mouse: elimination after intravenous administration of deoxyribonucleic acid. Nature. 1965;205:806–7.
Mazurik VK, Bryksina LE, Podgorodnichenko VK. A study of the excretion of thymidine and beta-aminoisobutyric acid (BAIBA) in rats as a function of the administered dose of thymidine and DNA. Radiobiologiia. 1968;8:17–22.
Nielsen HR. Variability in urinary-aminoisobutyric acid and creatinine in a human control group. Dan Med Bull. 1972;19:144–7.
Evered DF, Barley JF. Infrequency of urinary excretion of beta-aminoisobutyric acid by healthy humans. Clin Chim Acta Int J Clin Chem. 1978;84:339–46.
van Gennip AH, van Bree-Blom EJ, Abeling NG, van Erven AJ, Voûte PA. beta-Aminoisobutyric acid as a marker of thymine catabolism in malignancy. Clin Chim Acta Int J Clin Chem. 1987;165:365–77.
Abe M, Takahashi M, Nishidai T, Suyama S, Oshima S. The significance of urinary beta-aminoisobutyric acid in cancer patients. Int J Radiat Biol Relat Stud Phys Chem Med. 1973;24:73–9.
Smith H, Bates TH, Smith CI. Excretion of beta-amino-isobutyric acid as an index of radiation exposure. Int J Radiat Biol Relat Stud Phys Chem Med. 1964;8:263–9.
Sandler M, Pare CM. Starvation amino-aciduria. Lancet. 1954;266:494–5.
Kittel A, Müller F, König J, Mieth M, Sticht H, Zolk O, et al. Alanine-glyoxylate aminotransferase 2 (AGXT2) polymorphisms have considerable impact on methylarginine and β-aminoisobutyrate metabolism in healthy volunteers. PLoS One. 2014;9:e88544.
OMIM Entry-# 210100—beta-aminoisobutyric aciduria; BAIBA [Internet]. https://www.omim.org/entry/210100. Accessed 12 July 2018.
Roberts LD, Boström P, O’Sullivan JF, Schinzel RT, Lewis GD, Dejam A, et al. β-Aminoisobutyric acid induces browning of white fat and hepatic β-oxidation and is inversely correlated with cardiometabolic risk factors. Cell Metab. 2014;19:96–108.
Fasullo M, Endres L. Nucleotide salvage deficiencies, DNA damage and neurodegeneration. Int J Mol Sci. 2015;16:9431–49.
Nucleotide: Abbau und Wiederverwertung [Internet]. Medici. https://viamedici.thieme.de/lernmodule/biochemie/nucleotide+abbau+und+wiederverwertung. Accessed 18 Apr 2018.
Reyderman L, Stavchansky S. Pharmacokinetics and biodistribution of a nucleotide-based thrombin inhibitor in rats. Pharm Res. 1998;15:904–10.
Acknowledgements
The manuscript was proofread by Proof-Reading-Service (PRS).
Data availability
All data generated or analysed during this study are included in this published article.
Author information
Authors and Affiliations
Corresponding author
Ethics declarations
Funding
Part of this work was supported by a grant of AiF support GmbH, ZIM (grant no. ZF4447101AJ7).
Conflict of interest
Hanna Davideit, Susanne Becker, Johannes Müller, Niels-Peter Becker, Peter Göttel, Ayşe Abay, and Annekathrin Haberland are employed by Berlin Cures. Johannes Müller, Peter Göttel, and Annekathrin Haberland are shareholders of the Berlin Cures Holding AG, the parent company of the Berliner branch Berlin Cures GmbH. These authors have no other relevant affiliations or financial involvement with any organisation or entity with a financial interest in or financial conflict with the subject or materials discussed in the manuscript apart from those which are disclosed. Angela Sinn, Matthias Grossmann, Markus Mallek, and Hardy Weisshoff have no conflict of interest.
Ethical standards
All procedures in this study were in accordance with the 1964 Helsinki declaration (and its amendments). EudraCT-no. 2015-005236-18 (ethics committee approval).
Informed consent
All subjects signed an informed consent form.
Rights and permissions
OpenAccess This article is distributed under the terms of the Creative Commons Attribution-NonCommercial 4.0 International License (http://creativecommons.org/licenses/by-nc/4.0/), which permits any noncommercial use, distribution, and reproduction in any medium, provided you give appropriate credit to the original author(s) and the source, provide a link to the Creative Commons license, and indicate if changes were made.
About this article

Cite this article
Davideit, H., Becker, S., Müller, J. et al. In-Vivo Degradation of DNA-Based Therapeutic BC 007 in Humans. Eur J Drug Metab Pharmacokinet 44, 567–578 (2019). https://doi.org/10.1007/s13318-019-00541-3
Published:
Issue Date:
DOI: https://doi.org/10.1007/s13318-019-00541-3