
Abstract
The Ciénaga Grande de Santa Marta (CGSM), Colombia is possibly the wetland that has experienced the largest mangrove mortality on record due to modification of hydrologic connectivity and consequent hypersaline conditions. We used hydroclimatic, salinity and mangrove basal area data collected in five stations from 1993 to 2015 to study the relation between ongoing mangrove recovery, changes in salinity in the wetland and hydroclimatic changes in precipitation, potential evapotranspiration and freshwater inputs. We found that until 2015, the mangrove ecosystems in CGSM are in general terms in a path of recovery due to the combined effect of favorable hydroclimatic conditions and management operations to increase freshwater inputs into the wetland. We observed in three stations that the annual growth of mangrove basal area increased as pore water salinity decreased. Regarding surface water salinity, El Niño/Southern Oscillation explained most of the inter-annual variability in the wet season by regulating freshwater and in the dry season by regulating potential evaporation from the wetland. However, persistent channel reopening appeared to be the cause for the largest salinity decreases, whereas lack of persistent dredging slowed recovery in other areas. The monitoring of the mangrove-salinity-hydroclimate system must continue in order to increase its understanding and to avoid more recurring episodes of mangrove mortality.
Introduction
Mangrove forests are coastal ecosystems that provide at least US $1.6 billion/yr. in ecosystem services and support global coastal livelihoods (Polidoro et al. 2010; Thorslund et al. 2017). Covering approximately 180,000 km2 worldwide, these ecosystems are among the most productive, reaching daily mean productions of 2.5 gC/m2 (Spalding 1997; Jennerjahn and Ittekkot 2002). Local to global configurations of regulators such as salinity or sulfides, resources such as nutrients, light, water, and also hydroclimatic variability, act as stressors that result in diverse mangrove zonation patterns over a wide variety of environmental settings (Smith 1992; Twilley and Rivera-Monroy 2005). Natural or anthropogenic changes to these configurations may become drivers of stress (Foti et al. 2013), affecting mangrove development, increasing susceptibility to diseases and pests, and inducing massive mangrove mortality across the spectrum of events in which a large numbers of trees of all sizes and species die (Jimenez et al. 1985). Wetlands experiencing massive mangrove mortality involving hypersalinity conditions have been reported in Colombia (Cardona and Botero 1998), Venezuela (Barreto 2008), Puerto Rico (Cintron et al. 1978), Trinidad and Tobago (Jimenez et al. 1985), Guadeloupe (Jimenez et al. 1985), Western Australia (Gordon 1988), Micronesia (Drexler and Ewel 2001), Nigeria (Fagbami et al. 1988), Indonesia (Triwilaida Intari 1990), Florida, U.S.A. (Cintron et al. 1978) and Senegal (Diop et al. 1997).
Natural drivers of stress in coastal wetlands include lightning, herbivory, frost, tropical storms, changes in sea level, and long-term climate variability (Osland et al. 2013). Of these drivers, changes in sea level have generated recently great concern due to unprecedented climate change. Much less investigated is the role of other macroclimatic drivers on coastal wetlands such as droughts (Jimenez et al. 1985; Blanco et al. 2006; Osland et al. 2016). In turn, anthropogenic drivers include pollution, channelization, dam construction, dredging, and construction of dikes and roads which chronically affect the hydrologic and edaphic conditions of mangroves (Kamali and Hashim 2011; Wemple et al. 2017). Growing human populations are increasingly disturbing mangrove ecosystems with greater impact than natural disturbances (Twilley and Chen 1998; Allen et al. 2001; Martinuzzi et al. 2009) and approximately one-third of mangrove forests have been lost over the past 50 years (Valiela et al. 2001; Alongi 2002). For instance, modifications of hydrological regimes are a main reason for mangrove mortality worldwide (e.g. Cintron et al. 1978; Cardona and Botero 1998; Barreto 2008; Sakho et al. 2011).
Climatic variability and hydrological modifications affecting the water balance of coastal wetlands result in salinity changes (Blanco et al. 2006; Foti et al. 2013; Röderstein et al. 2014). In turn, salinity changes are common stress drivers for mangrove populations (Perdomo et al. 1998). The seaward-landward mangrove species distribution follows zonation patterns that are related to tolerance to flooding, hydropoeriod and pore water salinity (Foti et al. 2012). Although mangroves grow better in presence of brackish or saltwater, they do not necessarily require it for growth; optimal growth rates occur with salinities in the range of 5 to 75 PSU (Krauss et al. 2008). Above or below the optimal salinity range of each species, plant gas exchange and growth are reduced (Ball and Farquhar 1984; Tuffers et al. 2001; Krauss and Allen 2003). Increasing mangrove tolerance to salinity is at the expense of their growth and competition capabilities under low salinity conditions and an important factor to their survival (Ball and Pidsley 1995). Hence, constant exposure to high salinity levels or even fluctuations may affect early seedling establishment, growth, eco-physiological proficiency (Lugo and Snedaker 1974; Cintron et al. 1978; Krauss et al. 2008) and lead to plant biochemical function impairment, cell damage and plant death (Flowers and Yeo 1986).
There is little research about how hydroclimatic changes affect mangrove recovery or development after massive mortality episodes (Paling et al. 2003). Hydroclimatic and mangrove data limitations have restricted long-term studies on the climate-salinity-mangrove system and the identification of causal relationships. Identifying, separating and quantifying the effects of both natural and anthropogenic stress drivers on mangrove mortality, growth and recovery is fundamental for the protection of mangrove ecosystems (Ellison and Farnsworth 1996; Barreto 2008).
We here quantify the long-term interactions among climate, salinity, and mangrove health status to disentangle the relative roles of climate and hydrologic rehabilitation on mangrove recovery after one of the largest and most destructive mortality episodes to date in the Ciénaga Grande de Santa Marta (CGSM), Colombia (Fig. 1). We here aim to answer the following research questions:
-
1.
Can we attribute mangrove recovery to changes in salinity in the CGSM?
-
2.
Which are the main hydroclimatic parameters driving salinity change and seasonal fluctuations in the last 25 years in CGSM?
-
3.
Have dredging operations aimed to reopen the channels and increase freshwater input into CGSM succeeded in reducing salinity?
Fig. 1 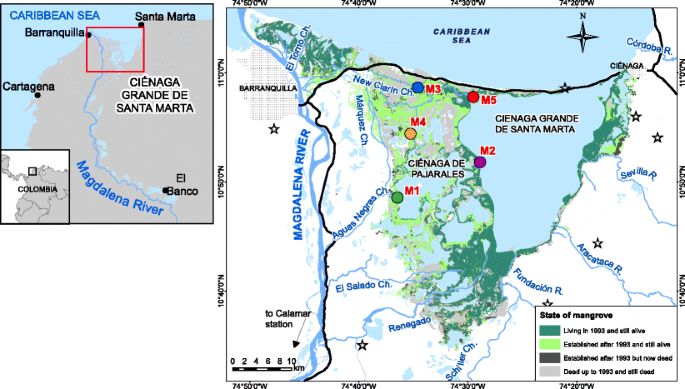
Mangrove coverage in CGSM in 1993 and its change during the period 1993–2015. Roads altering the hydrology of the wetland constructed before 1970 are shown in black and freshwater inputs in blue. Colored points represent the five stations where mangrove development and physiology have been monitored since 1993. Black-bordered stars show the climatic stations were precipitation data was collected

To answer these questions, we combined 23 years of data in five stations on mangrove basal area growth and salinity‐ collected by the Marine and Coastal Research Institute of Colombia (INVEMAR)— with hydroclimatic data for river discharge, temperature and precipitation for the period 1993–2015 from the Colombian hydro-meterological institute IDEAM. We first introduce the main characteristics and the environmental problematic of the CGSM in the “Site and Problem Description” section of the methods, followed by a description of the collected mangrove, salinity and hydroclimatic data used in this study in the “Data Collection” section. In the “Data Analysis” section we explain the methods in which we use such data to answer each of the four main research questions mentioned above and in the “Results” section the Results related to each research question. We finally discuss the implications of our results for the hydroclimate-salinity-mangrove system and the corresponding consequences of the mangrove rehabilitation and maintenance programs to date and set the major Conclusions of the study.
Materials and Methods
Site and Problem Description
The CGSM mangrove ecosystems have experienced severe mortality episodes starting in the 1950s reducing their coverage from more than 500 km2 in 1956 to less than half, 226 km2, in 1996 (INVEMAR 2016; Fig. 1). Not only is CGSM among the most productive wetlands in terms of water column primary productivity (Cloern and Jassby 2008), but it has also been referred to as part of the most irreplaceable ecosystem on earth for threatened species (Saout et al. 2013). This wetland complex is one of the largest coastal lagoon–delta ecosystems in the Caribbean with an approximate extension of 1280 km2. Massive mangrove mortality here has been related to a combination of drought conditions, blockage of the freshwater inputs into CGSM and strong modification of the natural hydrological connectivity of the brackish waters with rivers and sea, due to the construction of two roads (Röderstein et al. 2014).
The first causeway constructed in the 1950s to connect the major cities of Barranquilla and Ciénaga on opposite sides of the lagoon blocked the hydrologic flow between sea and CGSM, whereas the second, constructed in the 1970s, along the eastern bank of the Magdalena River and connecting several riverine towns to Barranquilla, blocked freshwater input from the river into CGSM (Fig. 1). The lack of initial adequate drainage systems in both roads led to the hydrological isolation of CGSM from both the open sea and the Magdalena River. Furthermore, heavy loads of suspended sediment from the Magdalena River, which drains almost half of the Colombian territory, have clogged and reduced flow in almost all natural and manmade channels connecting the river with CGSM and supplying freshwater. It appears that the impaired hydrologic exchanges combined with warmer periods increase surface and pore water salinity resulting in hypersaline conditions that cause extensive ecosystem degradation and inhibit mangrove growth and recovery (Turner and Lewis 1997; Perdomo et al. 1998; Cardona and Botero 1998). To restore the hydrologic connectivity between CGSM and its original freshwater sources, various restoration projects aiming to dredge occluded channels were initiated. The effectiveness of such programs is still in doubt, since it has been difficult to demonstrate if dredging and not hydroclimatic change is the reason of increasing freshwater inputs and reducing salinity (Blanco et al. 2006; Rivera-Monroy et al. 2011).
As of 2015, mangrove coverage had bounced back to approximately 400 km2, but this level has been more or less stagnant since 2011. Mangrove coverage is dynamic –increasing in some previously damaged areas, but not in others, begging the question as to how resilient the wetland ecosystem recovery is and whether climatic trends can explain the recovery patterns. Understanding and differentiating the climatic and anthropogenic drivers of salinity change is crucial for development of effective mangrove rehabilitation and recovery plans.
Data Collection
Mangrove Basal Area
We collected available annual data on mangrove basal area (BA) from five stations monitored by INVEMAR since 1993 (Stations M1, M2, M3, M4 and M5; Fig. 1 and Table A1 of Supplementary materials). These measuring stations were originally established in areas with different disturbance levels of mangrove mortality based on forest structure and water and soil salinities at each location. Stations M1 and M4 were chosen in areas with no living mangrove basal area in 1993, M2 and M3 exhibited severe degradation with low living mangrove basal area, and M5 was regarded as a control due to its developed and unaffected mangrove structure. INVEMAR has measured annually at each station (when possible) 15 permanent growth plots of 10 m by 10 m separated by 10-m intervals and equally distributed on three transects (100 m each) that are perpendicular to the main water body. Mangrove trees in every plot have been numbered, species-categorized, tagged and their diameter at breast height (D; cm) measured periodically at 1.3 m above the surface, following the guidelines of Cintron and Novelli (1984). Based on this data, we calculated in each station total BA in m2/ha.yr for each of the mangrove species in all stations, comprising Avicennia germinans, Laguncularia racemosa and Rhizophora mangle.
Pore and Superficial Water Salinity
Since 1995, INVEMAR has measured in the five mangrove-monitoring stations pore water salinity at 0.5 m deep (Sp) every 3 months, along the central transect at 10 m intervals, and in 10 locations with a portable multiparameter measuring water conductivity to express salinity in Practical Salinity Units (PSU). A device consisting of a perforated-outer and inner PVC pipe allowed penetration of the soil and collection of water at a specific depth between both tubes. When the equipment could not read high pore water salinities, the water samples were extracted from the PVC tube, diluted in-situ in a ratio of 1 to 1 with distilled water for measurement, and then adjusted accordingly. Surface water salinity (Ss) was also measured in-situ on a monthly basis near these five stations since 1993. We aggregated historical values of Sp and Ss to the annual scale and of Ss also at seasonal scales, with the dry season going from December to April and the wet season from May to November (Perdomo et al. 1998; Rivera-Monroy et al. 2011). We also calculated the maximum pore and surface water salinity recorded in each station each year; Sp-max and Ss-max.
Hydroclimatic Variables
We obtained monthly data on the Southern Oscillation Index anomaly (SOI) from the Centre for Weather and Climate Predictions of the National Oceanic and Atmospheric Administration (NOAA). Monthly precipitation (P) for the region was calculated from the seven meteorological stations (Fig. 1) of the Colombian climatological network of Instituto de Hidrología, Meteorología y Estudios Ambientales (IDEAM) that presented a complete and continuous monthly time series during the period 1993–2015. We applied the area-weighted Thiessen polygon method over the extent of CGSM to estimate a spatial weighted monthly P value for the wetland. As with salinity, we aggregated P to the annual and seasonal scales for this analysis.
There is currently no hydrological station nor any estimate available on freshwater discharge entering CGSM from the Magdalena River on the west through the different dredged and natural channels. Hence, we used discharge data, QMag, from IDEAM’s Calamar discharge station (drainage area of 257,428 km2) as a proxy for such inputs, even though the station is located on the Magdalena River and approximately 100 km upstream of the confluence of the river into the Caribbean Sea (Fig. 1). However, the maximum annual freshwater input to CGSM is estimated to be 164 m3/s, only around 2% of the mean annual QMag (6971 m3/s), with most of the freshwater in the Magdalena River continuing its course on the main river into the Caribbean Ocean and bypassing CGSM. We performed the same analysis for the Fundación River, the main eastern tributary of CGSM with a basin drainage area of 1097 km2, and calculated annual and seasonal discharge based on discharge data before its confluence into CGSM (QFun). Discharge data from the other main rivers draining CGSM from the east (i.e., Sevilla and Aracataca Rivers; Fig. 1) was incomplete and discarded for this analysis. Monthly potential evaporation (PET) was obtained by the method of Thornthwaite (1948) which expresses PET in terms of mean monthly temperature. We obtained temperature data from two climatological stations measuring climatic parameters in the area of CGSM and operated by IDEAM. As with P, we aggregated QMag and PET monthly values to seasonal (dry-wet) and annual scales during the period 1993–2015.
Data Analysis
Research Question 1: Can we Attribute Mangrove Recovery to Changes in Salinity in the CGSM?
To investigate the dependence of mangrove growth on salinity, we first investigated the possible relationship between mean annual Sp during the period 1993–2015 and mean annual BA in the five stations. We additionally assessed if variations in Sp or Sp-max determined the rate of mangrove recovery (growth). For this, we explored in each station the existence of any linear regression between the mean or maximum pore water salinity measured during a given year (j); i.e., Spj or Sp-maxj, and the change in BA occurring during that specific year interval (BAint), where BAint = BAj + 1 - BAj-1. We also calculated the coefficient of determination (R2) and the statistical significance of the linear regression (p < 0.05; F-test) in each station.
We also checked whether the linear models between BAint and Sp properly represented the data and if they followed the typical assumptions of general linear models. For this, we used the linear function “lm” in R software to check if: 1) the residuals had non-linear patterns, 2) if they were normally distributed, 3) if they assumed equal variance or homoscedasticity and 4) if any outlier was too influential in the linear regression analysis to affect it when removed. This analysis is found in the Supplementary Information (Figs. A1–A5).
Furthermore, we analyzed the temporal change of this climate-salinity-mangrove interaction by dividing the period of available data for all variables 1993–2015 into two periods (PD); 1993–1998 and 1999–2015. In this study, this period selection differentiated mangrove, salinity and hydroclimate before/during the reopening by dredging of the channels, which occurred between 1993 and 1998 (Table 1) with high salinity and small mangrove basal area conditions, and after this initial opening, when salinity decreased and mangrove basal area increased. We calculated for a salinity or mangrove variable (x) a period-average value as follows
where xi is the annual mean variable value in year i within period PD and M is the total
number of years i with complete data in period PD. The temporal change from period 1 to period 2 (Δx) in each variable was calculated as
The period averages of Eq. 2 (xPD1 and xPD2) were calculated for all salinity variables (Sp, Sp-max, Ss, Ss-max) and the species and total mangrove basal area BA to obtain the corresponding changes between periods (ΔSp, ΔSp-max, ΔSs, ΔSs-max, ΔΒΑ). The period averages of BA only included years with available salinity data for cross comparison purposes. We also performed a two-sided unpaired Wilcox rank sum test to assess the significance of these changes considering significance at the 95% significance level, i.e., p < 0.05, by using the function “wilcox.test” of the Package stats in the R software. The null hypothesis used for this test is that there is no location shift in the distributions of available annual values xi of both periods 1993–1998 and 1999–2015. The method just described has been used in previous studies to study hydroclimatic change between long-term periods of time (Jaramillo and Destouni 2014; Jaramillo and Destouni 2015).
Research Question 2: Which Are the Main Hydroclimatic Parameters Driving Salinity Change?
We also used Eqs. 1 and 2 to determine similar period averages and temporal change in the hydroclimatic variables SOI, P, QMag, QFun, PET and aridity index PET/P (i.e., ΔSOI, ΔP, ΔQMag, ΔQFun, ΔPET and ΔPET/P). We then compared these hydroclimatic changes with those of salinity to explore any relation between them.
Furthermore, in order to determine the main hydroclimatic driver/s (SOI, P, QMag, QFun, PET and aridity index PET/P) driving seasonal salinity in CGSM, we constructed a Pearson correlation matrix for all hydroclimatic variables and Ss in each of the five stations in both dry and wet seasons. In this way, we studied the driving effects of these variables on salinity, any causal relations between climatic parameters and relations between stations in terms of Ss. All Pearson coefficients (R) were tested for significance (p < 0.05) based on the Pearson’s product moment correlation coefficient. Since hydroclimatic variables may have high correlations and regression coefficients between themselves (e.g., precipitation over the wetland and runoff in the Magdalena River), the identification of the main hydroclimatic variable driving salinity may prove difficult leading to unreliable and unstable estimates of regression coefficients. As such, we also assessed collinearity between the hydroclimatic variables by calculating a variance-inflation factor (VIF) with the “vif” function of the car package available in the R software. A VIF of 1 implies that there is no correlation among the hydroclimatic variable and the remaining hydroclimatic variables, a VIF larger than 4 means that collinearity may be inflating the variance of the linear regression coefficient, and a VIF that exceeds 10 suggests a serious multicolinearity.
Research Question 3: Have Dredging Operations Succeeded in Reducing Salinity?
Annual data on dredged volumes of sediment per channel were obtained from Corpamag, the environmental authority in charge of the implementation of the rehabilitation and maintenance programs (Table 1). We studied the time series of annual volume dredged (V), QMag, Sp and Sp-max in the two stations that are located in or at the outlet of the two main channels feeding CGSM: M1 located at the outlet of Aguas Negras Channel into the Pajarales complex of CGSM and M3 in the middle of the New Clarin Channel in the Northern CGSM (Fig. 1). Both channels were reopened/dredged during the period 1993–1998 (rehabilitation) but only the Aguas Negras channel was dredged during the period 2006-early 2015 (maintenance).
Results
Research Question 1: Can we Attribute Mangrove Recovery to Changes in Salinity?
We first studied the effect of salinity on mangrove growth and recovery by analyzing the annual growth rate in mangrove basal, BAint along with pore water salinity (Fig. 2a). During the entire period 1993–2015, we found that in stations M2, M3 and M5 as mean annual pore water salinity Sp increased BAint decreased. This is sustained by the significant (p < 0.05; F-test) R2 values of the relation between BAint and Sp in these three stations. The inverse nature of these relationships also shows that the largest BAint occurs when annual Sp is low. It also shows how negative BAint due to mangrove mortality generally occur in years with the highest pore water salinity. In contrast, in station M1 a positive relationship (p < 0.05; F-test) between Sp and BAint emerged.

(a) Linear relationship between mean annual pore water salinity (Sp; PSU) and annual growth in basal area (BA; m2/ha) during that year (BAint = BAj + 1 - BAj-1) for all years during the entire study period 1993–2015. The linear relationship of station M4 is not shown since it was not significant (p > 0,05, F-test). Mean Sp and mean annual BA during (b) the first period 1993–1998 and (c) the second period 1999–2015, in the five monitoring stations. Pie charts represent the percentage of BA belonging to each mangrove species: Avicennia germinans-Ag (light color), Laguncularia racemose-Lr (filled) and Rhizophora mangle-Rm (crosshatched). Colors represent stations M1 to M5 as in Fig. 1. For the first period (b), although BA was zero in station M4, Sp data is not available
The models of stations M1, M2, M3 and M5 complied with the necessary assumptions of typical linear models (Figs. A1–A5 of the Supplementary Information). However, the linear model for stations M2 had a moderate influential outlier judging by the Cook distances larger than 0.5. Nevertheless, the R2 of this linear relationship barely changed and continued being statistically significant (p < 0.05; F-test) even after removing the outliers them from the model. We also studied potential relationships between BAint and maximum pore water salinity Sp-max but found no significant relationships, showing that even though Sp-max may determine mangrove mortality, mangrove growth is possibly more dependent on Sp.
During the first period 1993–1998 (Fig. 2b), stations M2, M3 and M5 had a mean Sp that is similar to that of seawater (35 PSU). In comparison, the station farthest from direct contact with seawater (M1) had a higher mean Sp of 63 PSU. Although Station M4 had no reported Sp for this period, it should have been high since there was no living mangrove (BA = 0). The spatial distribution of salinity exemplifies the hydrological complexity of the CGSM, where distance from coastline and/or freshwater sources does not determine the pore water salinity. Regarding species composition, while Avicennia germinans accounted for more than 70% of BA in all stations, Laguncularia racemosa accounted for an important percentage of species composition along the New Clarin Channel (M3 and M5) and Rhizophora mangle bordering the main lagoon of CGSM (M2 and M5).
During the period 1999–2015, stations M1, M2 and M5 exhibited a recovery trend of combined improved BA and stable or decreasing Sp and M4 of only BA (Sp data for the first period is not available) (Fig. 2b). In particular, station M1 experienced the largest decrease in Sp and the largest increase in BA, reaching almost that of the reference station M5. Furthermore, Laguncularia racemose appeared in stations M2 and increased the share of total BA in stations M1 and M3, while species composition remained stable in reference station M5. Laguncularia racemose had also the largest contribution to total basal area in station M4, despite the high salinity.
Quantification of change from the period 1993–1998 to the period 1999–2015 shows that all stations except M3 experienced significant (p < 0.05; Wilcox) reductions in Sp and surface water salinity Ss (Fig. 3a). Station M1 had both the largest increase in BA by more than 19 m2/ha, and the largest decreases in Sp, Sp-max, and Ss. Although the smallest decreases in Sp and Ss occurred in stations M3 and M4, BA in these stations increased more than in reference station M5, due to the higher growth rate during recovery. In general, a proportional dependency of mangrove basal area change and salinity change is not evident from comparison of the five stations, nor is a proportionality between changes of Sp, Ss, Sp-max and Ss-max among stations. In particular, station M3 exhibited the second highest increase in basal area even though it has not experienced the salinity reductions of M1 or M2.

(a) Changes from the period 1993–1998 to the period 1999–2015 in mean annual mangrove basal area (BA: m2/ha), pore water salinity (ΔSp; PSU), superficial salinity (ΔSs; PSU) and maximum annual pore (ΔSp-max; PSU) and superficial water salinity (ΔSs-max; PSU), in the five stations (M1-M5) where mangrove development is monitored. (b) Changes between the same periods of precipitation (ΔP; mm/yr), annual discharge of the Magdalena River (ΔQMag; mm/yr), and the Fundación River (ΔQFUN; mm/yr), potential evapotranspiration (ΔPET; mm/yr), Southern Oscillation Index (ΔSOI) and aridity index (Δ(PET/P)). Asterisks represent statistical significant changes (p < 0.05; Wilcox)
Research Question 2: Which Are the Main Hydroclimatic Parameters Driving Salinity Change?
The mean change in salinity of the five stations from the period 1993–1998 to the period 1999–2015 amounted to a decrease of 18 and 9 PSU in Sp and Ss, respectively (Fig. 3a). These decreases were caused by dilution of the dissolved salts from an increase in P over the wetland and an increase in runoff in the main two tributaries of the wetland; QMag and QFun. The decreases in salinity were also accompanied by decreases in energy available for evapotranspiration that may favor dilution of salts such as a decrease in PET, PET/P, and SOI. However, since none of these hydroclimatic changes were sufficiently large to be statistically significant (p > 0.05; Wilcox; Fig. 3b), salinity changes cannot be attributed to any particular hydroclimatic variable from this change perspective.
A further study of hydroclimatic and salinity changes per station and season (i.e., dry and wet) gave more detailed information on the main drivers of salinity in the CGSM. Variability of Ss was more comparable among stations during the dry season than during the wet season (Fig. 4). The strongest similarities of Ss among stations occurred between stations M2 and M5 (R = 0.95 and 0.96 for dry and wet seasons, respectively), which are both located on the coast of the main lagoon. In their analysis during the 10-year period 1993–2002, Blanco et al. (2006) suggested that changes in Ss were driven by the intensity of El Niño/Southern Oscillation (ENSO) in terms of the annual Southern Oscillation Index (SOI) anomaly. However, the analysis performed here for the longer 23-year period of 1993–2015 shows that SOI drives Ss especially during the dry season, when all stations present significant (p < 0.05; Pearson) correlations between SOI and Ss (Fig. 4a), whereas during the wet season QMag is the best predictor of Ss (with significant negative correlations in four of the five stations) (Fig. 4b). Interestingly, in stations M1 and M3 the correlations between salinity and hydroclimatic variables are the lowest, possibly pointing to other drivers of salinity in these stations.

Graphical display of the Pearson correlation matrix of annual values of hydroclimatic and salinity parameters for the (a) dry and (b) wet season; parameters include the Southern Oscillation Index (SOI), Discharge of the Magdalena River (QMag) and Fundación River (QFun), Potential evaporation (PET), local precipitation (P) and superficial salinity (SS) at stations M1, M2, M3, M4 and M5. Color indicates positive (blue) and negative (red) correlation coefficients (R) that are significant (p < 0.05; Pearson). Grey squares show non-significant R-values (p > 0.05). Numbers within each square correspond to R-values
Furthermore, increasing QFun also decreases Ss (dilution effect) in both seasons, with significant negative correlation in the stations bordering the main lagoon and thus closer to the confluence of these rivers (M2 and M5). Moreover, PET is positively correlated with Ss mostly during the dry season (p < 0.05; Pearson), highlighting the role of evaporation as regulator of salinity. The hydroclimatic effects of QFun and PET on salinity during the dry season may be somehow distinct, since their Variance Inflation Factor VIF values, used to measure autocorrelations among hydroclimatic drivers, are moderate (VIF < 3). On the contrary, the higher VIF values during the wet season (VIF ≥ 4) suggest larger collinearity between QMag, QFun, and P and as such a combined effect of these variables of salinity (Table 2).
Research Question 3: Have Dredging Operations Succeeded in Reducing Salinity?
Since 1994, more than 5.95 × 10⁶ m3 of bed material were excavated to restore original freshwater inputs into CGSM. The dredging operations were mostly concentrated in the channels Aguas Negras (45%), Renegado (27%), New Clarin (19%), El Torno-Almendros (4%), Schiller (3%) and Marquez (2%) (Fig. 1 and Table 1). In two of these channels, the Aguas Negras and New Clarín, INVEMAR has measured downstream BA, Sp and Ss after mangrove mortality (stations M1 and M3, respectively), facilitating an assessment of the effectiveness of such operations (Fig. 5). In the Aguas Negras, dredging operations continued during the period 1999–2015 as part of a maintenance plan due to the heavy siltation of the channels. In comparison, authorities had not dredged the New Clarin during the period 1999-early 2015, but dredging efforts re-started in 2015 due to recent increments in salinity.

Inter-annual measured hydrological parameters in stations M1 (a) and M3 (b). Annual mean and maximum pore water salinity per station (Sp and Sp-max; PSU), annual discharge of the Magdalena River at Calamar station (QMag; mm/yr). Horizontal red lines show years when channels were dredged. The first station is located at the outlet of Aguas Negras Channel, the second in the New Clarin Channel
The Aguas Negras channel at M1 experienced immediate reductions of Ss since the reopening in 1998 increased freshwater inputs to CGSM during the La Nina event in the same year (Blanco et al. 2006). The Sp and Sp-max concentrations in this channel decreased in 1999 by 72 and 95 PSU, respectively, when compared to the peak of 1994 (Fig. 5a), and levels have since then remained below 40 and 80 PSU, respectively. Furthermore, despite the strong El Nino episode that started in 2014, recent salinity concentrations in 2015 have been far under the concentration peaks recorded in 1994, 1997, 1998, 2002 and 2003.
In the New Clarin channel, after the reopening of the channel, in 1996, Sp and Sp-max continued increasing up to 1998, reaching a maximum of 49 and 103 PSU (Fig. 5b). This suggests that the dredging operations were not sufficient to improve water flow in this channel. The further salinity reductions in Sp and Sp-max in 1999–2002 rather appear to be a result of high freshwater inputs in that corresponding El Nino event. Furthermore, since then and until 2015, the successive La Niña periods have not reduced pore water salinity; Sp and Sp-max have rather increased to historical levels beyond 59 and 95 PSU, respectively, due to the lack of channel maintenance.
Discussion
Mangrove Recovery and Salinity
After the mangrove mortality episodes prior to 1994, there appears to be a dependency of mangrove development on salinity levels in stations M2, M3 and M5, despite the fact that many stressors coexist. Although siltation, anoxic conditions, high nutrient loads and heavy metals may be stressors for mangrove ecosystems in CGSM (Perdomo et al. 1998; Carola 2000), not only massive mangrove mortality, but also the recovery and development up to 2015 appear to be driven by changes in salinity in these stations (Fig. 2a). Even though basal area is just one of many mangrove traits that may diagnose mangrove development and restoration, the results here exhibit a consistent relation with salinity in CGSM in agreement with previous studies (Medina and Francisco 1997; Cardona and Botero 1998). In three of five stations, we observed the expected negative significant (p < 0.05; F-test) relationship between basal area growth and pore water salinity based on all collected data. These relationships were linear, at least within the range of salinities occurring up to date. Similar relationships have been observed for salinity and other mangrove morphological traits such as tree height in similar mangrove ecosystems (Cintron et al. 1978). The unexpected positive linear relationship between pore water salinity and mangrove growth found at the outlet of the heavily dredged Aguas Negras channel (station M1) could be related to the combination of reductions in salinity with changes in other regulators such as nutrient availability. The positive linear relationship occurs mainly due to the high (the highest) growth rates occurring during a El Niño dry event of 2002–2003 under high salinities, however, the highest historical concentrations of ammonia (N-NH4) also occurred during this period (Cardona and Botero 1998; INVEMAR 2016).
Until 2015, the mangrove ecosystems in CGSM are in general terms in a path of recovery after the massive mortality episodes occurring between 1960 and 1994. From the period 1993–1998 to 1999–2015, basal area increased in all the monitored stations and both pore water and surface water salinity decreased significantly in all but one station (Fig. 3a). All stations are converging towards the salinity and basal area levels of station M5, located at the outlet of New Clarin Channel, which suffered the least from the mangrove mortality episodes and maintained a fairly developed mangrove structure throughout the study period (Rodríguez-Rodríguez 2015) (Fig. 2b). Due to the already developed structure of the mangroves existing before 1993, change in both basal area and pore water salinity in M5 should be the lowest of all stations (Fig. 4a). However, two stations experienced even less reductions in salinity than in this reference station, stations M3 and M4. Particular concern has grown with the deteriorating water quality in the areas of these stations. Maximum and mean pore water salinities have steadily increased again after 2002 to the point that in the latest years they have passed the tolerance thresholds of R. mangle (65 PSU; Cintron et al. 1978) and L. racemose (80 PSU; INVEMAR 2016). Since L. racemose accounts for 20 and 62% of all basal area in stations M3 and M4, respectively, and R. mangle 15% of station M4, the probability of experiencing more mangrove mortality episodes remains high (Rodríguez-Rodríguez 2015).
The hydrology and spatial salinity gradients of CGSM are complex and clearly do not resemble the gradients of a typical estuary under natural conditions – at least along these heavily managed channels. For instance, salt concentrations at the outlet of the New Clarin Channel in the main lagoon of CGSM (M5) have been lower than in the upstream reaches of this channel (M3) during 17 of the 21 years with simultaneous salinity measurements. The New Clarin channel is then showing conditions of an inverse estuary (Sylla et al. 1995), which would suggest that the low salinities of station M5 could be due to constant flushing by tidal and hydrological processes of the main lagoon of CGSM. These processes transport sea water from the only outlet, generating a counterclockwise flow in the main lagoon (Wiedemann 1973). In contrast, freshwater input from the Magdalena River appears to be less important in this station (Rivera-Monroy et al. 2011). It is only during extreme La Nina wet event years such as 1999–2001 and 2008 that the salinity gradient of this channel behaves as a common estuary, with salinity increasing in the downstream direction. These data point to a lack of functionality of the channel possibly due to lack of hydrologic connectivity and heavy siltation (Jaramillo et al. 2017).
Consequences of the Rehabilitation and Maintenance Programs
Dredging operations were conducted to increase freshwater inputs to CGSM and reduce salinity by dilution. However, even though the Aguas Negras and the New Clarin channels were reopened in the period 1995–1998, salinity responded differently to dredging. The comparison of the changes in salinity of stations M1 at the outlet of the Aguas Negras channel in CGSM (heavily dredged during both the rehabilitation and maintenance projects) and M3 at the New Clarin Channel (mildly dredged during the rehabilitation project and not dredged again until late 2015) gives evidence of the importance of intense and continuous dredging to control and reduce salinity in CGSM. Despite the fact that both stations receive freshwater from the same source, the Magdalena River, and that both stations registered massive mortality with living mangrove basal area close to zero in 1993, the increase in basal area at station M1 is larger than that of station M3 (Figs. 2 and 5). Hence, change in SOI or increase in Magdalena River cannot explain the difference in terms of salinity and basal area between these stations.
Although expensive, the reopening and constant channel maintenance of the Aguas Negras channel is compulsory to guarantee the influx of freshwater to CGSM and hence keep pore water salinities below the mangrove tolerance limits. However, due to the heavy sediment loads that CGSM is constantly receiving from the Magdalena River and the modified hydrology of the wetland, and as proven by the case of station M3 in the New Clarin Channel, initial reopening alone may not be sufficient to keep low salinities. The lack of knowledge on the hydrology of CGSM hampers the possibility of finding new ways to improve water quality and enhance mangrove growth and ecosystem functioning. The recent rising of salinity concentrations once again should motivate environmental authorities and other actors to devote funds and personnel to research of ecohydrological processes in this wetland. As such, future restoration programs in similar coastal wetlands need a deeper understanding of their hydrology as pointed out by Van Meter and Basu (2015), specifically regarding freshwater sources and local hydrologic connectivity (Cohen et al. 2016). The necessity of this understanding is even ratified by recent studies of hydrologic connectivity in the CGSM (Jaramillo et al. 2017), to avoid future mortality episodes.
Conclusions
We here reported on more than 23 years of post-mortality mangrove recovery in the 1280-km2 Ciénaga Grande de Santa Marta (CGSM), Colombia. CGSM is one of the world’s most productive tropical wetlands and the one that has possibly experienced the largest mangrove mortality on record. We used hydroclimatic, pore and surface water salinity and mangrove basal area data collected from 1993 to 2015 to study the cause and effect of salinity changes on mangrove recovery in five stations. Annual mangrove basal area growth was found to decrease with increasing pore water salinity in three of the five monitoring stations, indicating that decreased salinity improves mangrove recovery. Until 2015, the mangrove ecosystems in CGSM are in general terms in a path of recovery after the massive mortality episodes occurring between 1960 and 1994. From the period 1993–1998 to 1999–2015, basal area increased in all the monitored stations and both pore water and surface water salinity decreased significantly in all but one station. In the wet season, El Niño/Southern Oscillation explained most of the inter-annual variability of surface water salinity by regulating freshwater input through the two main tributary rivers and local precipitation. In the dry season, El Niño/Southern Oscillation appears to control salinity by regulating potential evaporation in the wetland as seen by the relation between potential evapotranspiration and salinity in most stations. However, hydroclimatic variables alone could not explain observed salinity decrease in two stations. Up to date, local authorities have dredged more than 5.9 × 10⁶ m3 of sediment to increase freshwater input into CGSM. Persistent channel reopening appeared to be the cause for the largest salinity decreases and mangrove recovery, whereas lack of persistent dredging slowed recovery in other areas. As such, the recovery of mangrove populations in the CGSM is due to a combined effect of favorable hydroclimatic conditions and effectivity of the dredging operations to increase freshwater inputs into the wetland.
References
Allen JA, Ewel KC, Jack J (2001) Patterns of natural and anthropogenic disturbance of the mangroves on the Pacific Island of Kosrae. Wetlands Ecology and Management 9:291–301. https://doi.org/10.1023/A:1011125310794
Alongi D (2002) Present state and future of the world’s mangrove forests. Environmental Conservation 29:331–349
Ball MC, Farquhar GD (1984) Photosynthetic and Stomatal responses of two mangrove species, Aegiceras corniculatum and Avicennia marina, to long term salinity and humidity conditions. Plant Physiology 74:1–6. https://doi.org/10.1104/pp.74.1.1
Ball MC, Pidsley SM (1995) Growth responses to salinity in relation to distribution of two mangrove species, Sonneratia alba and S. Lanceolata, in northern Australia. Functional Ecology 9:77–85. https://doi.org/10.2307/2390093
Barreto MB (2008) Diagnostics about the state of mangroves in Venezuela: case studies from the National Park Morrocoy and wildlife refuge Cuare. In: Lieth PH, Sucre DMG, Herzog B (eds) Mangroves and halophytes: restoration and utilisation. Springer, Netherlands, pp 51–64
Blanco J, Viloria E, Narvaez J (2006) ENSO and salinity changes in the Cienaga Grande de Santa Marta coastal lagoon system, Colombian Caribbean. Estuarine, Coastal and Shelf Science 66:157–167. https://doi.org/10.1016/j.ecss.2005.08.001
Cardona P, Botero L (1998) Soil characteristics and vegetation structure in a heavily deteriorated mangrove forest in the Caribbean coast of Colombia. Biotropica 30:24–34. https://doi.org/10.1111/j.1744-7429.1998.tb00366.x
Carola E (2000) Reasons for reforestation success and failure with three mangrove species in Colombia. Forest Ecology and Management 131:201–214. https://doi.org/10.1016/S0378-1127(99)00214-5
Cintron G, Novelli YS (1984) Methods for studying mangrove structure. 91–113
Cintron G, Lugo AE, Pool DJ, Morris G (1978) Mangroves of arid environments in Puerto Rico and Adjacent Islands. Biotropica 10:110–121. https://doi.org/10.2307/2388013
Cloern JE, Jassby AD (2008) Complex seasonal patterns of primary producers at the land–sea interface. Ecology Letters 11:1294–1303. https://doi.org/10.1111/j.1461-0248.2008.01244.x
Cohen MJ, Creed IF, Alexander L, Basu NB, Calhoun AJK, Craft C, D’Amico E, DeKeyser E, Fowler L, Golden HE, Jawitz JW, Kalla P, Kirkman LK, Lane CR, Lang M, Leibowitz SG, Lewis DB, Marton J, McLaughlin DL, Mushet DM, Raanan-Kiperwas H, Rains MC, Smith L, Walls SC (2016) Do geographically isolated wetlands influence landscape functions? Proceedings of the National Academy of Sciences 113:1978–1986. https://doi.org/10.1073/pnas.1512650113
Diop ES, Soumare A, Diallo N, Guisse A (1997) Recent changes of the mangroves of the Saloum River estuary, Senegal. Mangroves and Salt Marshes 1:163–172. https://doi.org/10.1023/A:1009900724172
Drexler JZ, Ewel KC (2001) Effect of the 1997–1998 ENSO-related drought on hydrology and salinity in a micronesian wetland complex. Estuaries 24:347–356. https://doi.org/10.2307/1353237
Ellison AM, Farnsworth EJ (1996) Anthropogenic disturbance of Caribbean mangrove ecosystems: past impacts, present trends, and future predictions. Biotropica 28:549–565. https://doi.org/10.2307/2389096
Fagbami AA, Udo EJ, Odu CTI (1988) Vegetation damage in an oil field in the Niger Delta of Nigeria. Journal of Tropical Ecology 4:61–75
Flowers TJ, Yeo AR (1986) Ion relations of plants under drought and salinity. Functional Plant Biology 13:75–91
Foti R, del Jesus M, Rinaldo A, Rodriguez-Iturbe I (2012) Hydroperiod regime controls the organization of plant species in wetlands. Proceedings of the National Academy of Sciences 109:19596–19600. https://doi.org/10.1073/pnas.1218056109
Foti R, del Jesus M, Rinaldo A, Rodriguez-Iturbe I (2013) Signs of critical transition in the Everglades wetlands in response to climate and anthropogenic changes. Proceedings of the National Academy of Sciences of the United States of America 110:6296–6300. https://doi.org/10.1073/pnas.1302558110
Gordon DM (1988) Disturbance to mangroves in tropical-arid Western Australia: hypersalinity and restriced tidal exchange as factors leading to mortality. Journal of Arid Environments 15:117–146
INVEMAR (2016) Monitoreo de las condiciones ambientales y los cambios estructurales y funcionales de las comunidades vegetales y de los recursos pesqeuros durante la rehabilitación de la Ciénaga Grande de Santa Marta. Informe Técnico Volumen 14
Jaramillo F, Destouni G (2014) Developing water change spectra and distinguishing change drivers worldwide. Geophysical Research Letters 41:8377–8386. https://doi.org/10.1002/2014GL061848
Jaramillo F, Destouni G (2015) Local flow regulation and irrigation raise global human water consumption and footprint. Science 350:1248–1251. https://doi.org/10.1126/science.aad1010
Jaramillo F, Brown I, Castellazzi P, Espinosa L, Guittard A, Hong SH, Rivera-Monroy VH, Wdowinski S (2017) Assessment of hydrologic connectivity in an ungauged wetland with InSAR observations. Environmental Research Letters 13. https://doi.org/10.1088/1748-9326/aa9d23
Jennerjahn TC, Ittekkot V (2002) Relevance of mangroves for the production and deposition of organic matter along tropical continental margins. Naturwissenschaften 89:23–30. https://doi.org/10.1007/s00114-001-0283-x
Jimenez JA, Lugo AE, Cintron G (1985) Tree mortality in mangrove forests. Biotropica 17:177–185. https://doi.org/10.2307/2388214
Kamali B, Hashim R (2011) Mangrove restoration without planting. Ecological Engineering 37:387–391. https://doi.org/10.1016/j.ecoleng.2010.11.025
Krauss KW, Allen JA (2003) Influences of salinity and shade on seedling photosynthesis and growth of two mangrove species, Rhizophora mangle and Bruguiera sexangula, introduced to Hawaii. Aquatic Botany 77:311–324. https://doi.org/10.1016/j.aquabot.2003.08.004
Krauss KW, Lovelock CE, McKee KL et al (2008) Environmental drivers in mangrove establishment and early development: a review. Aquatic Botany 89:105–127. https://doi.org/10.1016/j.aquabot.2007.12.014
Lugo AE, Snedaker SC (1974) The ecology of mangroves. Annual Review of Ecology and Systematics 5:39–64
Martínez G. AR (2005) Ciénaga Grande de Santa Marta - un modelo de gestión interinstitucional para su recuperación. CORPAMAG
Martinuzzi S, Gould WA, Lugo AE, Medina E (2009) Conversion and recovery of Puerto Rican mangroves: 200 years of change. Forest Ecology and Management 257:75–84. https://doi.org/10.1016/j.foreco.2008.08.037
Medina E, Francisco M (1997) Osmolality and δ13C of leaf tissues of mangrove species from environments of contrasting rainfall and salinity. Estuarine, Coastal and Shelf Science 45:337–344. https://doi.org/10.1006/ecss.1996.0188
Osland MJ, Enwright N, Day RH, Doyle TW (2013) Winter climate change and coastal wetland foundation species: salt marshes vs. mangrove forests in the southeastern United States. Global Change Biology 19:1482–1494. https://doi.org/10.1111/gcb.12126
Osland MJ, Enwright NM, Day RH, Gabler CA, Stagg CL, Grace JB (2016) Beyond just sea-level rise: considering macroclimatic drivers within coastal wetland vulnerability assessments to climate change. Global Change Biology 22:1–11. https://doi.org/10.1111/gcb.13084
Paling EI, Humphreys G, McCardle I (2003) The effect of a harbour development on mangroves in northwestern Australia. Wetlands Ecology and Management 11:281–290. https://doi.org/10.1023/B:WETL.0000005538.74513.de
Perdomo L, Ensminger I, Espinosa L et al (1998) The mangrove ecosystem of the Cienaga Grande de Santa Marta (Colombia): observations on regeneration and trace metals in sediment. Marine Pollution Bulletin 37:393–403
Polidoro BA, Carpenter KE, Collins L, Duke NC, Ellison AM, Ellison JC, Farnsworth EJ, Fernando ES, Kathiresan K, Koedam NE, Livingstone SR, Miyagi T, Moore GE, Ngoc Nam V, Ong JE, Primavera JH, Salmo SG, Sanciangco JC, Sukardjo S, Wang Y, Yong JWH (2010) The loss of species: mangrove extinction risk and geographic areas of global concern. PLoS One 5:e10095. https://doi.org/10.1371/journal.pone.0010095
Rivera-Monroy VH, Twilley RR, Ernesto Mancera-Pineda J et al (2011) Salinity and chlorophyll a as performance measures to rehabilitate a mangrove-dominated deltaic coastal region: the Cienaga Grande de Santa Marta-Pajarales lagoon complex, Colombia RID G-7329-2011. Estuaries and Coasts 34:1–19. https://doi.org/10.1007/s12237-010-9353-7
Röderstein M, Perdomo L, Villamil C, Hauffe T, Schnetter ML (2014) Long-term vegetation changes in a tropical coastal lagoon system after interventions in the hydrological conditions. Aquatic Botany 113:19–31. https://doi.org/10.1016/j.aquabot.2013.10.008
Rodríguez-Rodríguez JA (2015) Trayectorias de rehabilitación del bosque de manglar de la Ciénaga Grande de Santa Marta, luego de su reconexión con el río Magdalena
Sakho I, Mesnage V, Deloffre J, Lafite R, Niang I, Faye G (2011) The influence of natural and anthropogenic factors on mangrove dynamics over 60 years: the Somone estuary, Senegal. Estuarine, Coastal and Shelf Science 94:93–101. https://doi.org/10.1016/j.ecss.2011.05.032
Saout SL, Hoffmann M, Shi Y et al (2013) Protected areas and effective biodiversity conservation. Science 342:803–805. https://doi.org/10.1126/science.1239268
Smith TJ (1992) Forest structure. In: Robertson AI, Alongi DM (eds) Tropical mangrove ecosystems. American Geophysical Union, pp 101–136
Spalding M (1997) World mangrove atlas. International Society for Mangrove Ecosystems
Sylla M, Stein A, van Breemen N, Fresco LO (1995) Spatial variability of soil salinity at different scales in the mangrove rice agro-ecosystem in West Africa. Agriculture, Ecosystems and Environment 54:1–15. https://doi.org/10.1016/0167-8809(95)00594-I
Thornthwaite CW (1948) An approach toward a rational classification of climate. American Geographical Society
Thorslund J, Jarsjo J, Jaramillo F, Jawitz JW, Manzoni S, Basu NB, Chalov SR, Cohen MJ, Creed IF, Goldenberg R, Hylin A, Kalantari Z, Koussis AD, Lyon SW, Mazi K, Mard J, Persson K, Pietro J, Prieto C, Quin A, van Meter K, Destouni G (2017) Wetlands as large-scale nature-based solutions: status and challenges for research, engineering and management. Ecological Engineering 108:489–497. https://doi.org/10.1016/j.ecoleng.2017.07.012
Triwilaida Intari SE (1990) Factors affecting the death of mangrove trees in the Pedada strait, Indragiri Hilir, Riau, with reference to the site condition. For. Res. Bull
Tuffers A, Naidoo G, von Willert DJ (2001) Low salinities adversely affect photosynthetic performance of the mangrove, Avicennia marina. Wetlands Ecology and Management 9:235–242. https://doi.org/10.1023/A:1011164924907
Turner RE, Lewis RR (1997) Hydrologic restoration of coastal wetlands. Wetlands Ecology and Management 4:65–72. https://doi.org/10.1007/BF01876229
Twilley RR, Chen R (1998) A water budget and hydrology model of a basin mangrove forest in Rookery Bay, Florida. Marine and Freshwater Research 49:309–323. https://doi.org/10.1071/MF97220
Twilley RR, Rivera-Monroy VH (2005) Developing performance measures of mangrove wetlands using simulation models of hydrology, nutrient biogeochemistry, and community dynamics. Journal of Coastal Research:79–93
Valiela I, Bowen JL, York JK (2001) Mangrove forests: one of the World’s threatened major tropical environments at least 35% of the area of mangrove forests has been lost in the past two decades, losses that exceed those for tropical rain forests and coral reefs, two other well-known threatened environments. Bioscience 51:807–815. https://doi.org/10.1641/0006-3568(2001)051[0807:MFOOTW]2.0.CO;2
Van Meter KJ, Basu NB (2015) Signatures of human impact: size distributions and spatial organization of wetlands in the prairie pothole landscape. Ecological Applications 25:451–465. https://doi.org/10.1890/14-0662.1
Wemple BC, Browning T, Ziegler AD, Celi J, Chun KPS, Jaramillo F, Leite NK, Ramchunder SJ, Negishi JN, Palomeque X, Sawyer D (2017) Ecohydrological disturbances associated with roads: current knowledge, research needs, and management concerns with reference to the tropics. Ecohydrology n/a-n/a. https://doi.org/10.1002/eco.1881
Wiedemann HU (1973) Reconnaissance of the Ciénaga Grande de Santa Marta, Colombia: Physical Parameters and Geological History. Reconocimiento de la Ciénaga Grande de Santa Marta, Colombia: parámetros físicos e historia geológica
Acknowledgements
The Swedish Research Council (VR, project 2009-3221) and the Swedish Research Council for Environment, Agricultural Sciences and Spatial Planning FORMAS (942-2015-740) have funded this study. All mangrove, dredging, pore and superficial water salinity were collected with long-term funding from the local environmental authorities Corpamag, INVEMAR and the Colombian Ministry of Environment-Ministerio de Ambiente y Desarrollo Sostenible (MADS). Without the data provided by all these institutions and the advice of all researchers and stakeholders collaborating in the monitoring of the Ciénaga Grande de Santa Marta, this paper would not have been possible. Special thanks to the Swedish Academy of Sciences.
Author information
Authors and Affiliations
Corresponding author
Electronic Supplementary Material
ESM 1
(DOCX 572 kb)
Rights and permissions
Open Access This article is distributed under the terms of the Creative Commons Attribution 4.0 International License (http://creativecommons.org/licenses/by/4.0/), which permits unrestricted use, distribution, and reproduction in any medium, provided you give appropriate credit to the original author(s) and the source, provide a link to the Creative Commons license, and indicate if changes were made.
About this article

Cite this article
Jaramillo, F., Licero, L., Åhlen, I. et al. Effects of Hydroclimatic Change and Rehabilitation Activities on Salinity and Mangroves in the Ciénaga Grande de Santa Marta, Colombia. Wetlands 38, 755–767 (2018). https://doi.org/10.1007/s13157-018-1024-7
Received:
Accepted:
Published:
Issue Date:
DOI: https://doi.org/10.1007/s13157-018-1024-7