
Abstract
Biomass-based combined heat and power (CHP) generation with different carbon capture approaches is investigated in this study. Only direct carbon dioxide (CO2) emissions are considered. The selected processes are (i) a circulating fluidized bed boiler for wood chips connected to an extraction/condensation steam cycle CHP plant without carbon capture; (ii) plant (i), but with post-combustion CO2 capture; (iii) chemical looping combustion (CLC) of solid biomass connected to the steam cycle CHP plant; (iv) rotary kiln slow pyrolysis of biomass for biochar soil storage and direct combustion of volatiles supplying the steam cycle CHP plant with the CO2 from volatiles combustion escaping to the atmosphere; (v) case (iv) with additional post-combustion CO2 capture; and (vi) case (iv) with CLC of volatiles. Reasonable assumptions based on literature data are taken for the performance effects of the CO2 capture systems and the six process options are compared. CO2 compression to pipeline pressure is considered. The results show that both bioenergy with carbon capture and storage (BECCS) and biochar qualify as negative emission technologies (NETs) and that there is an energy-based performance advantage of BECCS over biochar because of the unreleased fuel energy in the biochar case. Additional aspects of biomass fuels (ash content and ash melting behavior) and sustainable soil management (nutrient cycles) for biomass production should be quantitatively considered in more detailed future assessments, as there may be certain biomass fuels, and environmental and economic settings where biochar application to soils is indicated rather than the full conversion of the biomass to energy and CO2.
1 Introduction
Permanent storage of carbon from a biomass origin promises to be cost-efficient compared to technical air capture when negative emission scenarios are to be implemented (Brandani 2012). If biomass is the carbon source, the main capture and concentration task for carbon dioxide (CO2) from the atmosphere is accomplished by natural photosynthesis. Along with increasing awareness about the need for negative emission technologies (NETs) in order to reach the goals of the United Nations Framework Convention on Climate Change, 21st Conference of the Parties (COP’21) in Paris, the different options have been listed (Minx et al. 2017) and qualitatively assessed (UNEP 2017), (Table 1).
At least two of these options compete for biomass as the input material, namely bioenergy with CO2 capture and storage (BECCS) as opposed to biomass pyrolysis with soil biochar storage (biochar). Despite the many qualitative issues one may raise in favor or against one or the other deployment route, the present contribution seeks to identify relevant parameters for the quantitative assessment of this question and to compare BECCS with biochar. Since the carbon-budget-effects of biomass provision strongly depend on land-use-change issues, a European scenario respecting sustainable forest management principles is considered. This means that any biomass that is harvested provides space for new plants to grow or that agricultural residues are valorized. High net emission reduction effects can only be expected if low-value biomass from sustainable sources is exploited, ideally agricultural and forestry residues with an otherwise short life cycle. The main research question for the present conference contribution can be formulated as follows.
Given the fact that we have limited amounts of biomass from sustainable sources, what is the best use of biomass with respect to net greenhouse gas (GHG) emission effects?
The aim is to express net GHG emission effects per energy-unit biomass fuel input as well as the energy output penalty paid for the removed CO2. For means of simplicity and to limit the focus of this study, combined heat and power (CHP) production is the assumed common goal of the processes compared. The investigated technological approaches have been reasonably selected. Another question that directly follows from the assessment is:
Are there other important criteria apart from net GHG emission effects to be considered for deciding which approach to follow?
The answer to this second question lies beyond the outcome of the present exercise. However, ideas for what to look at are presented in the discussion. Some specific background information is summarized in the following.
2 Background on biomass-based negative emission technologies
2.1 Biomass procurement effort and emissions
Direct CO2 emissions occur locally when carbon-based fuels are used, but indirect GHG emissions are also caused during fuel procurement (cultivation, extraction, processing, and transport). Figure 1 shows the indirect GHG emissions in terms of equivalent CO2 emissions attributed to the procurement of wood and wood pellets, compared to other fuels, for the case of Austria. The CO2 emitted during biomass combustion has already been absorbed during plant growth and, thus, the direct emission is close to zero. Direct GHG emissions from biomass combustion result from secondary combustion products such as nitrogen oxides. The indirect emission factor of wood pellets and wood chips is in the range of, or even below, that of natural gas.

Direct and indirect CO2 equivalent emissions of different fuels for the case of Austria based on data reported by the Environment Agency Austria (2017)
For the present work, only direct and downstream CO2 emissions from the biomass were considered. This can be partly justified by comparison with common practice in fossil fuel-based energy systems, where only chimney emissions are credited in many cases. Moreover, for the considered type of biomass, i.e., agricultural by-products (straw) and low-value forestry biomass (wood chips and pellets), the procurement effort and related GHG emissions per energy unit are largely comparable with those of natural gas. To simplify things, the influence of procurement-related emissions will not be considered in this study. Biomass sources with heavy land-use change issues or intensive cultivation techniques are excluded. A more comprehensive life cycle assessment would be required to credit the real overall negative emission effects of the technologies discussed here. This would also need to include the equipment-related emissions, is highly uncertain for a future economy, and is beyond the scope of this study, which only seeks to give an initial overview of direct emission effects.
2.2 Bioenergy with carbon capture and storage
Carbon capture and storage (CCS) has been intensively studied for more than 20 years, especially for application to fossil fuel conversion processes. Naturally, these technologies can also be applied in combination with biomass fuels, leading to NETs. Innovative CO2 capture technologies, as well as the downstream part of the CCS chain including transport and storage, are being developed. For the implementation of BECCS at large scale, two capture scenarios were considered in combination with biomass conversion in the present work:
Post-combustion CO2 capture (PCC)
Chemical looping combustion (CLC)
Chemical absorption into aqueous solutions of monoethanolamine (MEA) was chosen as a state-of-the-art solution because it is a technically mature end-of-pipe application for CO2 capture from combustion exhaust gases. Feasibility has been shown at demonstration scale for natural gas, coal, and biomass-fired power stations (Boot-Handford et al. 2014).
CLC, on the other hand, was chosen as a second approach that represents emerging CO2 capture systems (Abanades et al. 2015). CLC is an innovative process for the conversion of carbon-rich fuels at high temperature with a low efficiency penalty. Combustion air and fuel are never mixed in CLC. Instead, a solid oxygen carrier material transports oxygen from an air reactor to a fuel reactor. The entropy-related gas separation work requirement common to most other CO2 capture approaches is avoided. CLC plants have been operated successfully at pilot scale for fossil fuels (Boot-Handford et al. 2014; Adánez et al. 2018) and with syngas from biomass gasification (Penthor et al. 2014). CLC of solid biomass fuel has been successfully shown at lab scale (Mendiara et al. 2018). Within the present study, a biomass-fueled steam cycle CLC power plant will be considered for production of electricity and heat with inherent CO2 capture.
The relative impact of CO2 capture penalties for biomass-based CHP systems will be studied. Energy penalties will be caused by the different steps of a CCS chain (CO2 capture, removal of impurities like N2 or O2, compression, and transport). Biomass CHP generation is expected to be conducted in small- to medium-scale facilities (10–100 MWth). Here, the electric efficiency of a base case scenario (without CO2 capture) is also lower than that of large-scale power stations operating on fossil fuels (500–2000 MWth).
2.3 Biomass pyrolysis and soil biochar storage (biochar)
Biochar is a product of thermo-chemical conversion of biomass feedstock leading to higher carbon content compared to the original biomass. Different conversion technologies are discussed for biochar production, such as steam explosion, hydrothermal carbonization, torrefaction, and pyrolysis (Lehmann and Joseph 2015; Kambo and Dutta 2015). The sequestration of black carbon from biomass origin was proposed as an alternative to bioenergy by Fowles (2007). An important question is the durability of solid carbon in soil environments. The idea is that thermal treatment transforms the biomass into a form which is no longer subject to biological decay. Spokas (2010) relates the durability of biochar in soil to the O/C ratio in the char, concluding that the half-life of chars with a molar O/C ratio of 0.2 or below is in the order of 1000 years. While hydrochars and chars obtained at mild conditions in torrefaction typically show O/C ratios higher than 0.2, pyrolysis chars reach O/C ratios of 0.1 and below (Haubold-Rosar et al. 2016), thus promising relative longevity with respect to biological decomposition and supporting the consideration of pyrolysis char as an immediate carbon sink.
Slow pyrolysis in indirectly heated rotary kilns is an industrially proven technology. A pyrolysis plant for waste was successfully operated in Germany for more than 30 years (Meier et al. 2014) and reliable conversion performance data for straw pyrolysis from a 3 MW test campaign in Austria are available (Halwachs et al. 2011; Kern et al. 2012). The char yield from lignocellulosic biomass was reported to around 50% of the biomass carbon content. As an important aspect, the operating temperature of the pyrolysis process is 500–600 °C, which means that ash melting can be safely avoided for any kind of biomass feedstock. Provided that effective particulate removal is accomplished at the outlet of the pyrolysis reactor, the volatile products are free of any problematic ash components that go with the biochar stream. This means, in turn, that inorganic plant nutrients such as potassium and phosphorus are contained in the char product. The volatiles are available for high-temperature conversion or could be quenched to separate pyrolysis oil, water, and permanent gases. While the latter was considered for the case of cotton stalks as biomass input in an earlier study (Pröll et al. 2017), we assume the direct high-temperature conversion of volatiles for CHP generation in the present work.
3 Approach and case descriptions
3.1 General aspects
Six use-cases for biomass were compared in this study with the focus on negative emission generation:
- 1.
Biomass-based combined heat and power (CHP) generation in an extraction/condensation steam cycle (bioenergy)
- 2.
Bioenergy with post-combustion CO2 capture and compression (BECCS-MEA)
- 3.
Bioenergy with chemical looping combustion of solid biomass and CO2 compression (BECCS-CLC)
- 4.
Biomass pyrolysis with low-tech soil biochar storage and use of the volatile fraction for bioenergy without CO2 capture (biochar)
- 5.
Biochar with additional post-combustion CO2 capture from volatiles combustion including CO2 compression (biochar-MEA)
- 6.
Biochar with chemical looping combustion of volatiles and CO2 compression (biochar-CLC)
Cases 2–6 bear the potential to be net carbon sinks. Assumptions have been made with the aim of providing a reasonable and realistic comparison. These assumptions are reported in the following sections.
3.2 Fuel composition
Even without CO2 capture or biochar sequestration, bioenergy solutions affect the GHG balance if they substitute for fossil fuel-based energy. In order to quantify these effects, a fossil fuel benchmark is defined. The fossil fuel for assessment of emissions avoided by substitution is natural gas (NG). Thus, the least CO2-intensive fossil fuel has been chosen. If systems compare well with NG, the situation will improve further if compared to oil- or coal-based generation. NG is modeled as pure methane (CH4), which improves clarity and is again a best-case assumption in terms of CO2 footprint per energy unit in the fossil fuel system since any content of higher hydrocarbons will increase the carbon footprint. The NG data are reported in Table 2.
The biomass assumed in the present evaluation reflects a typical lignocellulosic matrix with a wood-like ash content (Table 3). It is important to note that higher ash content may be an issue in the considered BECCS cases while there are no implications expected in the biochar case and in the biochar+CCS cases as ash mostly stays with the char (Kern et al. 2012).
3.3 Natural gas power and heat provision
Three cases can be distinguished if power and/or heat are generated from fuels: electric power only, CHP, and heat only. The assumptions and specific efficiency figures for the natural gas-based reference case are summarized in Table 4.
The efficiency in the electricity-only case reflects that of a state-of-the-art large-scale gas turbine combined cycle (GT-CC) power plant. The CHP case fits two real-world settings: a gas turbine plus heat recovery boiler for medium temperature heat production at industrial scale or, at small scale, a gas engine with heat production at 75–100 °C from the engine and exhaust gas cooling. The heat-only case reflects a boiler efficiency based on the assumption that the return flow temperature of the heat carrier from the heat consumers is above 60°C (no flue gas condenser applicable). The CO2 emissions in Table 4 refer to a unit of generated electricity or heat and follow directly from the specific footprint in Table 2 and the efficiencies in Table 4. In the CHP case, the CO2 emission is assumed to be distributed equally over electricity and heat.
3.4 Bioenergy combined heat and power plant (BE CHP base case)
The amount of substituted fossil fuel directly depends on the conversion efficiency of the bioenergy system. In the present study, the bioenergy solution is based on a state-of-the-art steam cycle CHP plant operated in extraction/condensation mode for flexible heat provision. The 66 MWth biomass power plant in Simmering Vienna/Austria is considered as the base case for bioenergy-based CHP in this study. The plant is a circulating fluidized bed (CFB) boiler operated at high availability since 2006. A block diagram is shown in Fig. 2 and the main performance figures are reported in Table 5 (Wien Energie 2018). It is assumed in the following that the internal heat and electricity requirements of the BE CHP base case are covered within the boundary shown. Thus, the electric and heat outputs refer to the net useable output streams.
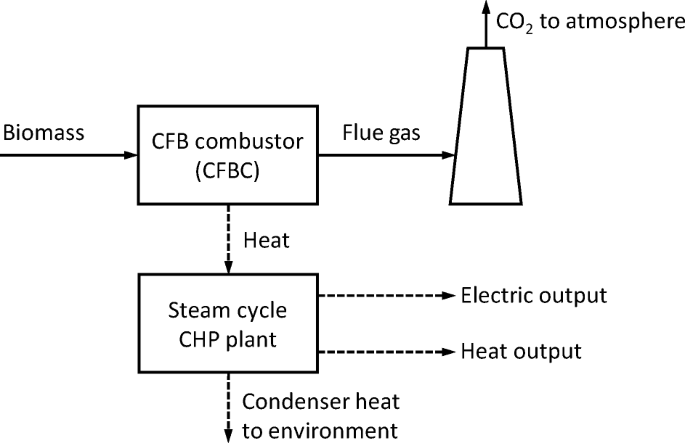
Block flow diagram of the base case for CHP generation from biomass (BE CHP). Solid lines indicate mass flows and broken lines indicate energy flows
For variable heat extraction situations, it is assumed that the power and heat output changes proportionally to the heat extraction rate according to Fig. 3. The scheme is also applied in the BECCS and biochar with CCS cases, where the heat demand of the capture system is assumed to be provided from extracted steam and the gross electric output is reduced according to Fig. 3 even for the “electricity-only” cases because of the extracted heat for CO2 capture.

Evolution of efficiency figures in the 66 MWth CHP plant with varied heat extraction rate
3.5 Bioenergy with carbon capture and storage
Two different CO2 capture approaches were investigated in this study. First, post-combustion capture using gas-liquid absorption and regeneration with an aqueous MEA solution as the solvent (BECCS-MEA). This can be considered a commercially available benchmark technology, even though recent energy-efficiency improvements have been reported. The process layout is sketched in Fig. 4. The main energy penalty in gas-liquid absorption arises from the heat requirement of the solvent reboiler in the bottom of the desorber column.

Block flow diagram of the bioenergy with post-combustion CO2 capture case (BECCS-MEA)
Most studies assume a CO2 capture rate of 90% for post-combustion capture technologies. According to Boot-Handford et al. (2014), the specific heat demand for a 90% CO2 capture rate is estimated at 3.0 MJ/kgCO2. Additionally, a specific electric energy demand of 66 kJel/kgCO2 is expected for a flue gas fan with 75% isentropic efficiency to overcome an absorber pressure drop of 10 kPa (assuming prior cooling of the exhaust gas to 40 °C) and a specific electric energy demand of about 20 kJel/kgCO2 for the solvent circulation pump based on values reported by Boot-Handford et al. (2014). All these specific numbers refer to the mass of captured CO2 provided at atmospheric pressure. The compression to pipeline pressure will be considered separately.
Second, chemical looping combustion (CLC) with direct biomass fuel-feeding to the fuel reactor (Adánez et al. 2018) was considered as an emerging technology for BECCS (BECCS-CLC). This process option is illustrated in Fig. 5. The advantages of CLC are its potential to capture 100% of the CO2 and a lower expected energy penalty for CO2 capture compared to any other capture approach. The residual capture penalty in CLC is related to the low-level process steam demand for loop seal fluidization and some additional blowers. The expected process steam demand for loop seal fluidization, based on an assessment of the CLC of natural gas for steam generation by Zerobin et al. (2016), is assumed to be 5.3% of the fuel power input. The additional electric demand in CLC was earlier assessed as about 1% of the fuel power input compared to a natural gas-fired boiler (Zerobin et al. 2016). For the present setting, where a CFB boiler for solid biomass is the benchmark, the additional electric demand for blowers and pumps is assumed to be 0.5% of the fuel power input.

Block flow diagram of the bioenergy chemical looping combustion of solid biomass case (BECCS-CLC)
For both BECCS cases, the biomass CHP setup according to Table 5 is taken as a basis with respect to plant size and boiler parameters. This means that the reboiler heat duty and the additional steam for loop seal fluidization, respectively, are provided from extracted steam. This will reduce the gross electric plant output in the maximum electric output case according to Fig. 3. In the case of CHP operation, only the heat output is affected by the heat demand for CO2 capture, while the gross electric output is similar to the bioenergy case without capture. The net electric output, however, is reduced in any BECCS case by the additional electric demand of capture-system-related pumps and blowers as mentioned above.
Additional electric energy is also required in all BECCS scenarios for CO2 compression and pipeline transport. The compression energy demand reported in the literature ranges from 0.25 MJ/kgCO2 (with a 25 °C intercooler temperature) (Skaugen et al. 2016) to 0.4 MJ/kgCO2 (with a 40 °C intercooler temperature) (Boot-Handford et al. 2014). The transport energy demand is estimated at 100–200 J/(kgCO2.km) based on data reported by Skaugen et al. (2016) and assuming reasonably chosen pipeline dimensions. This means that transport over 200 km requires 40 kJ/kgCO2 at the upper end, which is in the order of 10% of the compression energy demand. Given the uncertainty of the compression energy demand figure, the transport demand was neglected in the following and an overall electric demand of 0.4 MJ/kgCO2 was assumed for compression and transport of CO2 in the present study.
3.6 Biomass pyrolysis and biochar storage in soil (biochar)
Indirectly heated rotary kiln pyrolysis was used as the technology for the biochar production from lignocellulosic biomass case. The technology is industrially proven (Meier et al. 2014) and has more recently been investigated in detail in Austria (Halwachs et al. 2011; Kern et al. 2012). In the simple setup shown in Fig. 6, the volatile pyrolysis products (oil vapors and gas) are directly combusted without prior condensation of oil or water. The combustion heat is only partly required for heating the pyrolysis kiln and it is important to notice that the heat recycle to the kiln is partially recovered from the pyrolysis product streams, thus increasing the heat output of the volatiles furnace. The net furnace heat is available for combined heat and power production. The performance assumptions for the biochar case were based on the work of Kern (2010) for operating at a 550 °C pyrolysis temperature with wheat straw as fuel, and can be summarized as follows:
46.8% of the carbon from biomass ended up in the pyrolysis char.
Only a minor fraction of the volatiles was needed to heat the pyrolysis kiln.
The fuel energy content in the exportable volatiles was 49% of the primary fuel power input.
The biomass ash stayed with the pyrolysis char.

Block flow diagram of the biomass pyrolysis with biochar soil storage case (biochar)
For the volatile fraction, we assumed that a simple boiler was operated to supply a steam cycle CHP plant with the same efficiency characteristics as in the bioenergy case described in Section 3.4. The fact that not all the fuel energy is released in the biochar case leads to significantly reduced energy output efficiencies compared to the bioenergy and BECCS cases. The CO2 capture rate in the biochar case is about 47%, with the rest of the CO2 being emitted from volatiles combustion. However, no penalties for CO2 concentration, compression, and transport occurred in the biochar without CCS case.
3.7 Biochar integrated with CCS (biochar-CCS)
In this last technology scenario, rotary kiln pyrolysis is combined with CCS in the volatiles combustion branch in order to approach 100% CO2 capture rate. Post-combustion capture using MEA and CLC are again considered as alternative approaches to avoid the CO2 emissions from volatiles combustion. We refer to these cases as biochar-MEA (Fig. 7) and biochar-CLC (Fig. 8). The efficiency figures are simply assumed to be similar to the assumptions for BECCS-MEA and BECCS-CLC. This should give a general overview of the potential and limitations of combined setups. Aspects of the reduced scale of the CO2 capture system for volatiles conversion compared to the BECCS cases and of technological differences between volatiles conversion and direct conversion of the solid biomass will be discussed on a qualitative basis.

Block flow diagram of the biomass pyrolysis with biochar soil storage case including additional post-combustion CO2 capture from the volatiles combustion exhaust gas (biochar-MEA)

Block flow diagram of the biomass pyrolysis with biochar soil storage case including chemical looping combustion of volatiles for additional CO2 capture (biochar-CLC)
4 Results and discussion
4.1 General aspects
The biomass input flow rate of the biomass CHP plant described in the bioenergy case (Section 3.4) was taken as the basis for comparison. Thus, for all process options, a primary fuel power input of 66 MWth (basis LHV) was assumed.
The comparison is organized in the following levels:
CHP performance without compression of the captured CO2
CHP performance including CO2 compression
Energy requirement for negative emissions
Comparison to output-equivalent natural gas CHP generation
The results are summarized for all six options in Table 6.
4.2 CHP performance without compression of the captured CO2
In the BECCS-MEA case, a significant capture penalty arose from reboiler heat demand and from additional electric consumption by the capture plant, leading to a reduction of the maximum electric output by 17.3% (6.4%-pts.) compared to the BE CHP base case. In the case of CHP operation, the electric output reduction was only 3.0% (0.8%-pts.) compared to the BE CHP base case; the useable heat output, however, was reduced in this case by 52.6% (27.9%-pts.) and the total fuel utilization rate by 36.1% (28.7%-pts.) compared to the BE CHP base case.
The BECCS-CLC case also required heat (steam for loop seal fluidization) and some additional electricity compared to the standard CFB boiler. The penalties, though, were smaller than for the BECCS-MEA case and all of the biomass carbon was expected to be captured as CO2. The maximum electric output in the BECCS-CLC case was 4.0% (1.5%-pts.) lower, the electric output in maximum heat output CHP operation was reduced by 1.9% (0.5%-pts.), the useable heat output by 10.0% (5.3%-pts.), and the total fuel utilization rate by 7.3% (5.8%-pts.) compared to the BE CHP base case.
In the biochar case, only a fraction of the fuel energy is released. While 46.8% of the carbon from the biomass was “captured” in the char stream, 49% of the biomass fuel energy was available as heat to supply the CHP island. Consequently, significantly lower electric and heat outputs were achieved in all the biochar cases. The usable energy output was 50.9% lower compared to the BE CHP base case, meaning a penalty of 18.9%-pts. for the maximum electric output, 13.5%-pts. for the electric output in CHP operation with maximum heat extraction, 27.0%-pts. for the useable heat output, and 40.5%-pts. for the total fuel utilization rate compared to the BE CHP base case.
If the biochar approach was combined with post-combustion CO2 capture in the biochar-MEA process option, a high overall CO2 capture rate of 94.7% was achieved with 90% CO2 capture rate from volatiles combustion. The additional heat and electricity requirement of the CO2 capture plant combined with the partial heat release from the primary fuel resulted in a reduction of the maximum electricity output by 60.1% (22.3%-pts.), of the electricity output in the maximum heat output case by 52.5% (13.9%-pts.), the maximum heat output by 79.1% (41.9%-pts.) and the total fuel power utilization rate by 70.2% (55.8%-pts.).
If the biochar approach was combined with chemical looping combustion of volatiles (biochar-CLC), all carbon can be captured in principle. The overall process showed a reduced maximum electricity output by 53.1% (19.7%-pts.) compared to the BE CHP base case. In CHP operation with maximum heat output, the electricity output was lower by 52.1% (13.8%-pts.), the useable heat output by 56.2% (29.8%-pts.), and the total fuel power utilization rate by 54.7% (43.5%-pts.).
4.3 CHP performance including CO2 compression
A specific electric power demand of 0.4 MJ/kgCO2 is generally assumed for compression to pipeline pressure (> 12 MPa), as described in the last paragraph of Section 3.5. This led, according to Table 6, to an additional electric output penalty of 3.7%-pts. in the BECCS-MEA case and of 4.2%-pts. in the BECCS-CLC case. The effort was higher in the CLC case because of the higher CO2 capture rate. No CO2 compression was performed in the biochar case and the compression penalty in the biochar-MEA (2.0%-pts.) and biochar-CLC (2.2%-pts.) case was lower because of the reduced quantity of gaseous CO2. Relative to the produced electricity, the compression penalties in the biochar cases were largely similar to the BECCS cases. The CHP plant performance of the five technologies reaching negative emissions is shown for the cases of maximum electric output and maximum heat output (= maximum fuel utilization rate) in Fig. 9.

Combined heat and power plant performance with negative emission technologies
4.4 Energy requirement for negative emissions
Figure 10 shows the biomass energy input per mass of CO2 removed and the fuel utilization penalty for the negative emission concept according to Table 6. The biomass input per kilogram of CO2 removed from the atmosphere was around 10 MJLHV/kgCO2 for all process options except the biochar case, where roughly double the amount of biomass was required per kilogram CO2 because of the reduced CO2 capture rate. If the focus is on maximum CO2 storage from a certain amount of available biomass, all the process options with CO2 capture and compression performed equally well. The options differed, however, in terms of their energy output. The fuel utilization penalty for the negative emission concept reported in Table 6 refers to maximum heat output CHP operation and includes the compression of CO2 to pipeline pressure.

Energy effort to reach negative CO2 emissions with the investigated negative emission technologies
Again, the biochar case without CO2 capture showed the highest output penalty per kilogram of CO2 removed from the atmosphere. This is because of both the low capture rate and the reduced energy release from the fuel. The BECCS-CLC case performs best with only 1.0 MJ/kgCO2 output penalty.
4.5 Comparison to output-equivalent natural gas CHP generation
The last exercise presented here compares the investigated biomass-based cases to CHP generation from natural gas assuming 40% electric efficiency and 45% heat efficiency according to Table 4, see Fig. 11. The BE CHP benchmark process without any CO2 capture avoided 51.3 kg fossil CO2 emission per GJ biomass fuel energy according to this simple calculation (considering only stack CO2 and neglecting indirect GHG emissions). The options with additional CO2 removal from the atmosphere performed better here, avoiding 110–150 kg CO2 emission to the atmosphere per GJLHV biomass. The biochar without CO2 capture from volatiles combustion case avoided 73.5 kgCO2/GJLHV compared to a natural gas CHP plant, which was slightly more than the BE CHP base case.

CO2 emission avoidance compared to natural gas-fired combined heat and power (CHP) unit
4.6 Qualitative discussion
The results show that bioenergy plants based on sustainably grown biomass can avoid a certain amount of CO2 emissions through substitution for fossil fuels, depending mainly on the efficiency of the process compared to fossil fuel-based alternatives. If bioenergy is combined with CCS, net carbon sinks can be obtained. Here, emerging CLC technology promises significantly lower energy penalties compared to post-combustion CO2 capture using gas-liquid absorption. In the biomass pyrolysis and biochar soil storage case, the energy output from the fuel is reduced by roughly 50%, implying a doubled fuel demand with only about 50% of the carbon captured as solid biochar. The latter figure can be improved by applying CO2 capture technologies to the volatile conversion step. If only the CO2 emission balance is considered, the conclusion is, for limited biomass resources, that BECCS is superior to biochar+CCS because of the higher energy output. There are, however, several aspects not considered in this comparison that may motivate the implementation of biochar with and without additional CO2 capture as NETs. Some of these aspects are listed below.
4.6.1 Suitability of biomass feedstock for BECCS
For clean wood and wood-derived fuels with low ash content, but also for high ash-content biomass with a favorable ash composition such as sewage sludge, high-temperature conversion for CHP is proven and possible. Direct CLC is most likely feasible for wood-based fuels, whereas increased ash content is a challenge independent of the ash composition with CLC. Other biomass feedstocks such as agricultural by-products (straw, stalks, etc.) show an ash content typically above 5 wt% and low ash melting temperatures in the range of 700–900 °C. The application of such fuels in the proposed BECCS cases is highly problematic. While straw combustion is industrially performed in special furnaces with liquid ash removal, application of such fuels in fluidized bed furnaces or CLC systems is clearly counter-indicated from a technological perspective. Pyrolysis pretreatment can be a solution here and the volatile fraction can be used in high-temperature conversion processes since the ash stays with the biochar (Kern et al. 2012).
4.6.2 Sustainable biomass production with respect to nutrient cycles
If fuels with low ash melting characteristics are combusted, ash melting occurs and nutrients like potassium and phosphorus are lost with the slag. Application of biochar returns nutrients to the soil in a plant-available form. Thus, for biomass feedstock with relevant plant nutrient content, the biochar option may contribute to sustainable soil management. In the case of exhausted soils, biochar application could help build up soils for improved biomass yield, thus contributing to CO2 removal from the atmosphere.
4.6.3 Carbon leakage from storage sites vs. biochar half-life in soil
The durability of the storage option is relevant for the final judgment on the climate change mitigation effect of NETs. In both cases, i.e., BECCS and biochar, the durability of the storage option is subject to uncertainties. A sensitivity study assessment of reported values and the application to the investigated NET scenarios should be done in the future.
4.6.4 Time to implementation and technological challenges
BECCS-MEA and biochar without additional CO2 capture can be straightforwardly applied if economic incentives are given. The same applies, in principle, to biochar-MEA. BECCS-CLC, which promises higher overall efficiency compared to BECCS-MEA, still requires development. The current status here is satisfactory fuel conversion performance in laboratory units at the scale of 50–100 kWth. Biochar-CLC is expected to be somewhat less challenging compared to BECCS-CLC. The advantage here is that a gaseous fuel is used in the CLC process, avoiding potential carbon loss to the air reactor and ash-contamination of the oxygen carrier, two major challenges in CLC of solid fuels.
5 Conclusions and outlook
There is a clear energy-based performance advantage of BECCS over biochar for CHP generation because of the unreleased fuel energy in the biochar case. In terms of the amount of CO2 that can be removed from the carbon cycle per unit biomass input, BECCS and biochar with additional CO2 capture scenarios perform comparably. Only the biochar without additional CO2 capture scenario captures significantly less (only about 50%) of the biomass carbon content. These additional aspects should be considered in more detailed future assessments, as there may be certain biomass fuels and environmental settings where biochar production and application to soils should be preferred over BECCS. The recycling of biochar (and non-contaminated ash) can help to sustainably maintain soil fertility for biomass production, especially in the field of highly nutrient-containing by-products from agriculture and forestry. As a recommendation for global climate change mitigation strategies, both BECCS and biochar may contribute as NETs and the decision on which technological path to follow will depend on the type of available biomass, energy markets, and ecosystem demands.
References
Abanades JC, Arias B, Lyngfelt A, Mattisson T, Wiley DE, Li H, Ho MT, Mangano E, Brandani S (2015) Emerging CO2 capture systems. Int J Greenh Gas Control 40:126–166
Adánez J, Abad A, Mendiara T, Gayán P, de Diego LF, García-Labiano F (2018) Chemical looping combustion of solid fuels. Prog Energy Combust Sci 65:6–66
Boot-Handford ME, Abanades JC, Anthony EJ, Blunt MJ, Brandani S, Mac Dowell N, Fernández JR, Ferrari MC, Gross R, Hallett JP, Hazeldine RS, Heptonstall P, Lyngfelt A, Makuch Z, Mangano E, Porter RTJ, Pourkashanian M, Rochelle GT, Shah N, Yao JG, Fennell PS (2014) Carbon capture and storage update. Energy Environ Sci 7:130–189
Brandani S (2012) Carbon dioxide capture from air: a simple analysis. Energy Environ 23:19–28
Environment Agency Austria (2017) Calculation of greenhouse-gas-emissions of different energy carriers (in German). http://www5.umweltbundesamt.at/emas/co2mon/co2mon.html. Accessed on Jan 11, 2019
Fowles M (2007) Black carbon sequestration as an alternative to bioenergy. Biomass Bioenergy 31:426–432
Halwachs M, Kampichler G, Kern S, Pröll T, Hofbauer H (2011) Rotary kiln pyrolysis - a comprehensive approach of operating a 3 MW pilot plant over a period of two years. In: Bridgwater AV (editor) Proceedings of the BIOTEN conference on biomass, bioenergy and biofuels 2010. CPL Press, Newbury, UK, ISBN 1872691544
Haubold-Rosar M et al. (2016) Chancen und Risiken des Einsatzes von Biokohle und anderer veränderter Biomasse als Bodenhilfsstoffe oder für die C-Sequestrierung in Böden. Umweltbundesamt, 2016, (in German). http://www.umweltbundesamt.de/sites/default/files/medien/378/publikationen/texte_04_2016_chancen_und_risiken_des_einsatzes_von_biokohle.pdf. Accessed on Jan 11, 2019
Kambo HS, Dutta A (2015) A comparative review of biochar and hydrochar in terms of production, physico-chemical properties and applications. Renew Sust Energ Rev 45:359–378
Kern S (2010) Niedertemperatur Drehrohrpyrolyse als Vorschaltprozess für die Co-Verbrennung von unkonventionellen Brennstoffen in thermischen Anlagen. Master Thesis. TU Wien, Vienna (in English)
Kern S, Halwachs M, Kampichler G, Pfeifer C, Pröll T, Hofbauer H (2012) Rotary kiln pyrolysis of straw and fermentation residues in a 3 MW pilot plant - influence of pyrolysis temperature on pyrolysis product performance. J Anal Appl Pyrolysis 97:1–10
Lehmann J, Joseph S (2015) Biochar for environmental management. Science, technology and implementation, 2nd edn. Routledge, London ISBN 0415704154
Meier M, Schmid K, Heger S (2014) Pyrolyseverfahren in Burgau - eine Betrachtung aus Sicht der Überwachungsbehörde. In: Thomé-Kozmiensky KJ, Beckmann M (eds) Energ Abfall 11:780–95, TK Verlag, Nietwerder (in German)
Mendiara T, Pérez-Astray A, Izquierdo MT, Abad A, de Diego LF, García-Labiano F, Gayán P, Adánez J (2018) Chemical looping combustion of different types of biomass in a 0.5kWth unit. Fuel 211:868–875
Minx JC, Lamb WF, Callaghan MW, Bornmann L, Fuss S (2017) Fast growing research on negative emissions. Environ Res Lett 12:035007
Penthor S, Mayer K, Kern S, Kitzler H, Wöss D, Pröll T, Hofbauer H (2014) Chemical-looping combustion of raw syngas from biomass steam gasification - coupled operation of two dual fluidized bed pilot plants. Fuel 127:178–185
Pröll T, Al Afif R, Schaffer S, Pfeifer C (2017) Reduced local emissions and long-term carbon storage through pyrolysis of agricultural waste and application of pyrolysis char for soil improvement. Energy Procedia 114:6057–6066
Skaugen G, Roussanaly S, Jakobsen J, Brunsvold A (2016) Techno-economic evaluation of the effects of impurities on conditioning and transport of CO2 by pipeline. Int J Greenh Gas Control 54:627–639
Spokas KA (2010) Review of the stability of biochar in soils: predictability of O:C molar ratios. Carbon Manag 1:289–303
UNEP (2017) The Emissions Gap Report 2017. United Nations Environment Programme (UNEP), Nairobi. http://www.unenvironment.org/resources/emissions-gap-report. Accessed on Jan 11, 2019
Wien Energie (2018) Biomassekraftwerk Simmering - Technische Daten (in German). https://www.wienenergie.at/eportal3/ep/channelView.do/channelId/-48494. Accessed on Jan 11, 2019
Zerobin F, Bertsch O, Penthor S, Pröll T (2016) Concept study for competitive power generation from chemical looping combustion of natural gas. Energy Technol 4:1299–1304
Funding
Open access funding provided by University of Natural Resources and Life Sciences Vienna (BOKU).
Author information
Authors and Affiliations
Corresponding author
Additional information
Publisher’s note
Springer Nature remains neutral with regard to jurisdictional claims in published maps and institutional affiliations.
Rights and permissions
Open Access This article is distributed under the terms of the Creative Commons Attribution 4.0 International License (http://creativecommons.org/licenses/by/4.0/), which permits unrestricted use, distribution, and reproduction in any medium, provided you give appropriate credit to the original author(s) and the source, provide a link to the Creative Commons license, and indicate if changes were made.
About this article

Cite this article
Pröll, T., Zerobin, F. Biomass-based negative emission technology options with combined heat and power generation. Mitig Adapt Strateg Glob Change 24, 1307–1324 (2019). https://doi.org/10.1007/s11027-019-9841-4
Received:
Accepted:
Published:
Issue Date:
DOI: https://doi.org/10.1007/s11027-019-9841-4