Abstract
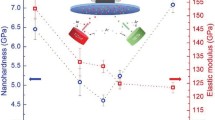
At the interface of thin film development and powder metallurgy technologies, this study aims to characterise the mechanical properties, lattice constants and phase formation of Ti-Nb alloys (8–30 at.%) produced by different manufacturing methods, including conventional powder metallurgy (PM), mechanical alloying (MA) and high power impulse magnetron sputtering (HiPIMS). A central aspect of this research was to investigate the different energy states achievable by each synthesis method. The findings revealed that as the Nb content increased, both the hardness and Young’s modulus of the PM samples decreased (from 4 to 1.5 and 125 to 85 GPa, respectively). For the MA alloys, the hardness and Young’s modulus varied between 3.2 and 3.9 and 100 to 116 GPa, respectively, with the lowest values recorded for 20% Nb (3.2 and 96 GPa). The Young’s modulus of the HiPIMS thin film samples did not follow a specific trend and varied between 110 and 138 GPa. However, an increase in hardness (from 3.6 to 4.8 GPa) coincided with an increase in the β2 phase contribution for films with the same chemical composition (23 at.% of Nb). This study highlights the potential of using HiPIMS gradient films for high throughput analysis for PM and MA techniques. This discovery is important as it provides a way to reduce the development time for complex alloy systems in biomaterials as well as other areas of materials engineering.
Graphical abstract
Introduction
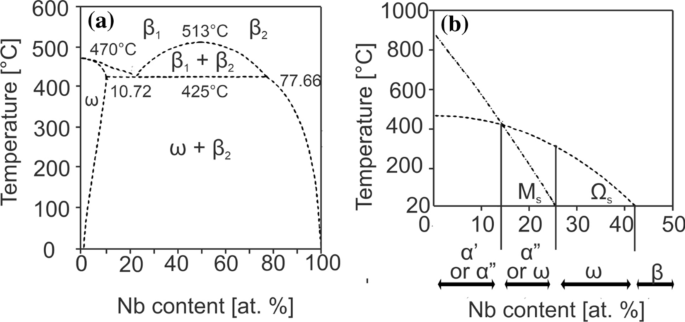
Titanium and its alloys are commonly used for medical applications, mainly as hard tissue implants. Their properties include high biocompatibility, corrosion resistance in body fluids, osseointegration, low Young’s modulus compared to other metallic biomaterials, and high relative strength [1,2,3,4]. Alloying Ti to increase the yield strength through the formation of dual-phases containing α and β structures led to the development of the Ti6Al4V (wt%) alloy [5]. However, despite obtaining improved mechanical properties, further research is required to overcome important issues related to Ti6Al4V. One major objective is to replace toxic Al and V by more biocompatible metals [6]. Another concern is the relatively high difference in Young’s modulus of the alloy (110 GPa) and bone (10–30 GPa), which is expected to generate stress shielding effects [7, 8]. One possibility of addressing these issues is using other β-stabilising elements, such as Nb, Zr, Mo and Ta, which tend to decrease the β transus temperature [9, 10]. Using Nb as a β -stabiliser is interesting, due to its significant impact on the α-β transformation temperature with only α and β being present in the stable phase diagram, while additionally allowing to decrease Ti’s Young’s modulus [11,12,13]. Furthermore, Ti-Nb alloys are non-cytotoxic and corrosion resistant in intravenous fluids [14, 15]. However, it should be noted that in the metastable phase diagram it is possible to observe other phases, such as Ti-based martensites, i.e. αʹ, αʹʹ or ω, which might be crucial in understanding the possibilities of forming many other phases using non-equilibrium manufacturing methods. Furthermore, the metastable Ti-Nb phase diagram exhibits the monotectoid transformation, which results in the formation of two body-centred cubic Ti-based solutions with different Nb contents, namely β1 and β2. This phenomenon is known as spinodal decomposition, where two phases with similar crystal structures but different compositions are formed due to different electron to atom ratios. The mechanical properties of alloys can be affected by the presence of this effect. The formation of β1 and β2 phases in alloys is critical to engineering material properties and can be controlled by manufacturing conditions and post-processing by annealing [16]. During the formation of Ti-Nb alloys, Ishiguro et al. [17] observed the presence of bcc-separated phases, specifically β1 and β2. This type of phase separation is also common in other stable phase diagrams, such as the Ti-Mo phase diagram [18]. Figure 1 presents the Ti-Nb phase diagram as a function of Nb contents and temperature [19, 20].
Other than conventional powder metallurgy (PM), mechanical alloying (MA) can be employed for non-equilibrium processing, which involves repeated cold welding, fracturing, and rewelding of the powder. This leads to the production of ultrafine-grained or nanocrystalline materials and enables producing non-conventional materials in the form of nanocomposites, with uniform ceramic phase dispersions in a metallic matrix. Furthermore, it allows to fabricate many non-equilibrium phases, e.g. supersaturated solutions, metastable and quasi-crystalline intermetallic phases or amorphous phases [21].
Zhuravleva et al. [22] and Kalita et al. [23] used a high-energy planetary ball mill to perform mechanical alloying for the fabrication of Ti-Nb alloys, specifically Ti26Nb (at.%) and TixNb (14 < x < 26 at.%, where TixNb refers to a Ti alloy containing x % of Nb). Both studies observed the formation of β-type Ti26Nb with crystallite sizes of approx. 12 nm. Bulk samples were obtained through spark plasma sintering with a compressive yield strength ranging from 650 to 950 MPa at 0.5% porosity. In a comparative study on the fabrication of Ti-Nb binary alloys for biomedical applications, Karre et al. [24] compared the consolidation of mixed Ti-xNb (x = 18.75, 25, and 31.25 at.%) powders using spark plasma sintering and conventional cold pressing and pressureless sintering. The resulting samples contained both β-phase and α″. The alloys produced in this study have a Young’s modulus of around 90 GPa and are non-toxic to osteoblast-like cells.
Wang et al. [25] conducted a comprehensive analysis of Ti35Nb (wt%) produced by selective laser melting, investigating their microstructure, mechanical properties and corrosion resistance. The study examined the material’s microstructure, mechanical properties, and corrosion resistance. The results confirmed that the material exhibits improved corrosion resistance compared to commercially pure titanium. This was demonstrated through open-circuit potential, potentiodynamic, and EIS Nyquist experiments, indicating its suitability for biomedical applications. Heat treatment can enhance the corrosion resistance of Ti35Nb alloys, leading to better homogenization of alloys made with mechanically mixed titanium and niobium powders. The authors also observed a positive effect when using gas atomized ingots as the powder feedstock [26]. Samples made with gas atomized pre-alloyed powders showed even greater homogeneity, increased ductility, and a lower modulus of approximately 72 GPa. Furthermore, alloys produced using this method did not contain any unmelted Nb particles. Unmelted Nb particles have been shown to significantly affect the mechanical properties of selectively laser-melted Ti-Nb alloys, particularly their Young’s modulus, contributing to an overall increase [27].
The main aim of this research is to gain a comprehensive understanding of the Ti-Nb phase diagram using different fabrication methods that operate under distinct thermodynamic non-equilibrium conditions. The Ti-Nb binary system was analysed using three manufacturing techniques: powder metallurgy, mechanical alloying, and high power impulse magnetron sputtering (HiPIMS). HiPIMS was used to create compositionally spread alloy films (CSAFs), with the purpose of screening materials and observe trends in material properties, such as crystal structure, hardness, and Young’s modulus, across different elemental compositions. The CSAFs supported the discovery and analysis of phase transformations in various materials and provided insights for bulk sample fabrication [28,29,30,31,32,33]. Previous research on Ti-Nb alloys, using direct-current magnetron sputtering (DCMS), showed that alloys containing 15–40% Nb achieved a single-phase β-structure [34]. The films produced exhibited varying grain structures depending on the material’s composition, including layer-island, columnar, or V-shaped structures. HiPIMS resulted in higher ion/neutral flux ratios impacting the substrate’s surface, leading to denser and more textured films with increased potential and kinetic energies compared to DCMS [35,36,37,38,39,40,41,42,43,44,45]. Investigations were conducted to elucidate the influence of energy considerations and alloying mechanisms on phase formation, lattice constant variations, and mechanical properties in these processes. This comprehensive understanding enables the development of predictive models for the behaviour of Ti-Nb alloys produced by MA, potentially paving the way for their application as a new generation of dental implant materials. Furthermore, this work provides valuable insights that can be applied to broader areas of materials engineering. It is particularly useful for studying complex systems, such as ternary and quaternary systems, which are difficult to explore using traditional bulk technologies. This research has the potential to advance materials science in various fields, such as aerospace, tooling, and functional materials, where it is crucial to evaluate the effects of different dopants on specific chemical and physical properties.
Set-up and sample production
Ti-Nb alloys were produced using three different techniques: conventional powder metallurgy and mechanical alloying (PM_TiXNb and MA_TiXNb, where X = 10, 20, 30) for fabricating bulk samples, and HiPIMS (TF_TiXNb) for obtaining gradient films. The Nb contents range of interest is between 10 and 30 at.%, as at these concentrations the transition of the Ti alloy to a pure cubic structure is expected. Only atomic percentage will be used in this work to indicate alloy composition, unless otherwise specified.
Sample preparation
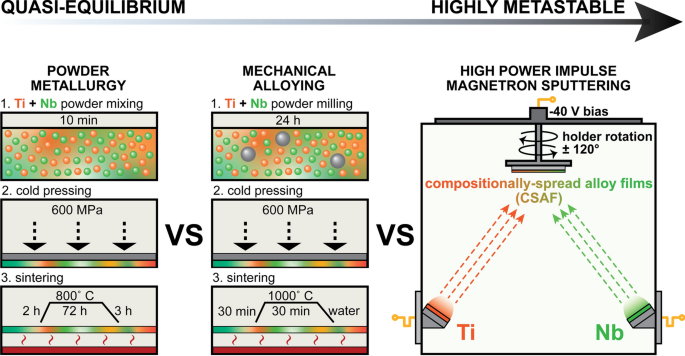
Bulk Ti-Nb alloys were produced using Ti (Alfa Aesar, 325 mesh, 99.9% purity, CAS:7440-32-6) and Nb (Sigma-Aldrich, 325 mesh, 99.8% purity, CAS:7446-03-1) powders. The morphology of the precursor powders can be found in our previous paper [46]. For PM, the powders were mixed for 10 min to homogenise their distribution and were then cold pressed at 600 MPa. During sintering, the temperature was gradually increased to 800 °C over a period of 2 h, maintained for 72 h and finally reduced to room temperature within 3 h. The process of sintering was performed under a protective Ar atmosphere in quartz tubes.
For MA, the powders were transferred to vials in a protective Ar atmosphere (O2 < 2 ppm and H2O < 1 ppm) inside a glove box (LabMaster 130, MBraun) and subjected to milling for 24 h using a SPEX 8000 Mixer Mill (SPEX® Sample Prep), which is particularly suited for alloying screening processes [21]. The milled powders were consolidated by cold-pressing (600 MPa) and sintering (30 min heating until reaching 1000 °C, 30 min holding, and then water cooling). The entire process was kept under a protective Ar environment within sealed quartz tubes. The sintering temperature of the mechanically alloyed samples was chosen based on the group’s previous work [47], where it was confirmed on the example of binary Ti-Mo alloys that higher sintering temperatures efficiently promote the formation of β.
The temperature applied during conventional PM sintering was lower than that used for MA-prepared powders to reduce the possibility of oxidation while the powders were held at elevated temperatures over a three-day period.
The composition of the final bulk samples was measured using X-ray fluorescence (XRF) spectrometry and was similar to the composition of the powders (Table 1). The Fischerscope X-Ray XDV-SDD X-Ray fluorescence spectrometer (Fischer Technology Inc.) was used for composition and film thickness measurements. The instrument was set to a voltage of 50 kV, collimator size of 0.3 mm, primary filter of Ni, spot size of 0.33 mm, and a measurement time of 30 s. For film measurements, the content gradient over the measurement spot size can be neglected. For bulk samples, five measurements were conducted for each compositional value. It should be noted that the composition uncertainty of the PM samples is greater than for MA, caused by coarse-grained structure formation during PM, leading to a more varied chemical composition at the microscale than for ultrafine-grained samples obtained via MA.
CSAF samples were deposited via HiPIMS (Hipster 1, Ionautics) in an in-house modified HexL reactor (Korvus), described in previous works [48, 49]. Pure Ti (99.995% purity) and Nb (99.95% purity) disc 2” × 0.1252” targets (Kurt J. Lesker) were installed onto 2 unbalanced magnetrons (Korvus). The films were deposited onto < 100 > -oriented silicon wafers (MicroChemicals). An in situ pre-treatment step was used to remove the native Si oxide layer by exposing the wafers to a microwave (MW) plasma produced by 3 MW plasma sources (Aura-wave, SAIREM) [48,49,50,51]. A pulse width of 25 µs was selected for both the Ti and Nb targets, with the sputtering process run in constant peak current mode (see Fig. S1 in Supplementary Materials). The pulse frequency was adapted to modify the deposition rates and film composition. Four samples were selected for these investigations: TF_Ti < 40Nb (overview sample covering the entire range of interest from 3 to 30% Nb, produced using two magnetrons installed face-to-face), and 3 samples targeting Nb concentrations of 10, 20 and 30% (produced using three magnetrons, two Ti and one Nb). The composition spread over the wafer was adjusted by rotating the substrate holder by ± 120° with a period of approximately 15 s. The substrate bias was set to − 40 V and Ar pressure to 0.6 Pa. The HiPIMS process was operated in constant peak current mode. The total thickness of the TF_Ti10Nb, TF_Ti20Nb, and TF_Ti30Nb films varied between 0.8 and 1.3 µm. The alloy concentration ranges are given in Table 2.
Characterisation methods
The film cross section was imaged using a Hitachi S-4800 high-resolution cold field emission (CFE) scanning electron microscope (SEM) (Hitachi High-Tech Corporation). Additionally, the structure of conventionally produced Ti-Nb alloys was observed using optical microscopy (Olympus GX51, JPN) after etching in Kroll reagent. The structure of the bulk samples was evaluated via electron backscatter diffraction (EBSD) using a Tescan Mira microscope (Tescan) and Digiview V camera (EDAX).
A Bruker D8 Discover X-Ray diffractometer (Bruker) with CuKα radiation was used for crystal structure evaluation of the film and bulk samples at room temperature using the following parameters: 40 kV voltage, 40 mA anode current, 30–80° 2θ range, with a 0.0196° step size. For the films, a greater time per step was set than for the bulk samples (1 vs 0.5 s/step) as a smaller slit and, in turn, spot size was used.
High Score Plus software (Malvern Panalytical B.V.) was used to perform Rietveld refinement. This is a profile fitting procedure that utilises diffraction patterns obtained from X-ray diffraction databases, such as the International Centre for Diffraction Data (ICDD) PDF4 + , as described in these articles [52, 53]. The Rietveld refinement procedure refines the background, profile coefficients, lattice parameters, linear absorption coefficients, and other variables in a least squares procedure to ensure the calculated pattern best fits the experimental data. Each phase’s data is calculated separately, and their relations are used to calculate the phase fractions, which are mainly directly related to the calculated scale factor (proportionality correction) [54, 55]. Phase fraction calculations are only performed for bulk samples that are randomly oriented due to the significant uncertainties introduced by preferred orientation. The provided data for films are limited to lattice constants.
A 1.5° offset from the symmetrical diffraction geometry was introduced to the films to avoid the signal from the Si substrate. For film samples showing a significant contents gradient, the samples were aligned on the sample stage in such a way that the contents gradient over the measurement spot size was as small as possible.
The hardness and Young’s modulus of the films were measured using a Hysitron Ubi Nanoindenter (Bruker) equipped with a diamond Berkovich indenter tip. A load force of 2 mN was used to achieve an indentation depth of approximately 10% of the films’ thickness. The Oliver-Pharr method was used to analyse the load–displacement data [56]. Young’s modulus was calculated from the reduced elastic modulus using a Poisson ratio of 0.32 [57]. The loading and unloading times were 10 s long, and the force was held for 5 s. Before the measurement, the tip area function was calibrated using fused silica as the reference sample. The mechanical properties of the bulk samples were examined by applying a higher force of 300 mN, loading time of 20 s and creep time of 5 s. The effect of porosity on the mechanical properties was neglectable, as the indents of approx. 1.5–2.5 μm were made in areas free of pores. A Fischerscope HM2000 nanoindenter (Fischer Technology Inc., USA) equipped with a Vickers tip was used for testing the bulk samples.
Results
Structural analysis
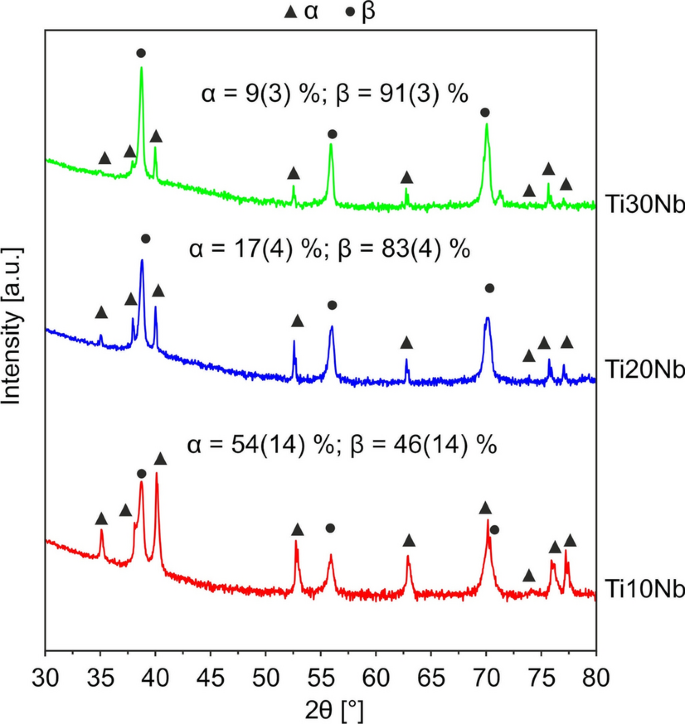
The X-ray diffractograms of the PM_TiXNb samples (Fig. 2) revealed that the crystal structure of all produced alloys consisted of two phases: hexagonal close-packed (hcp) α and body-centred cubic (bcc) β. The contents (mass fraction) of β increased from 46% for Ti10Nb to 91% for T30Nb. The unit cell volume of the bcc β phase was equal to 35.7(1) Å3 for alloys PM_Ti10Nb and PM_Ti20Nb and 35.6(1) Å3 for PM_Ti30Nb. Assuming that the α phase contains 2% Nb (the maximum solubility limit of Nb in α at 500 °C based on the stable Ti-Nb diagram [20]), the resulting β phase composition is Ti21Nb, Ti24Nb, and Ti34Nb. This implies that the Nb contents in β varies much less than its overall contents in the produced samples. The porosity of the PM_TiXNb samples varied between 2.0 and 2.9 vol. %, as calculated based on light microscopy images using the ImageJ software (see Fig. S2 in Supplementary Materials). Optical microscopy assessment of the chemically etched samples confirmed a mean grain size of 10 μm for both the α and β phases across all three compositions (refer to Fig. S3 in Supplementary Materials).
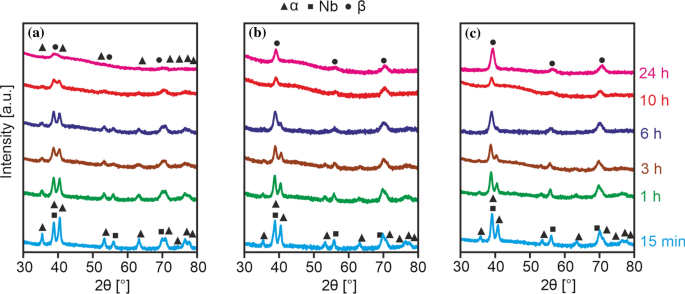
Figure 3 displays the evolution of the crystalline structure of the MA_TiXNB powder with increasing milling time. After 15 min of milling, the XRD revealed the presence of α and Nb-rich phases. The diffraction peaks of these phases were visible at early milling stages and their ratio depends on the composition of the powders. During milling, the β phase appeared at the expense of both Nb and α phases. For powders with a relatively high Nb contents (MA_Ti20Nb, MA_Ti30Nb) the β phase started to dominate. After 24 h of MA, both samples became single-phase β-structured alloys. The MA_Ti10Nb powder, however, had a α/β dual-phase structuring even after 24 h of milling. The amount of β phase in this material did not change significantly between 6 and 24 h of milling. However, significant peak broadening of both phases occurred.
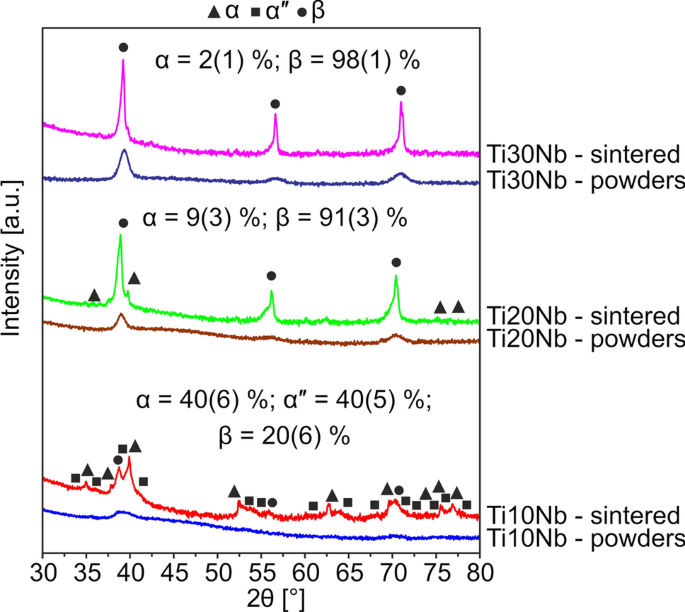
Next, the MA powders were sintered at 1000 °C [47, 58] and analysed via XRD (Fig. 4). The sintered samples contained α and β phases (MA_Ti20Nb and MA_Ti30Nb), as well as an additional orthorhombic Cmcm α″ phase in the case of the Ti10Nb alloy. Therefore, sintering led to the formation of α in alloys MA_Ti20Nb and MA_Ti30Nb (not present in the previously analysed MA powders). The formation of the Cmcm α″ phase, present in the low Nb contents alloy, might be favoured by the fast cooling of the samples in water. The contents of the β phase were observed to strongly increase with increasing Nb contents, i.e. from 20% in MA_Ti10Nb to almost 100% in MA_Ti30Nb.
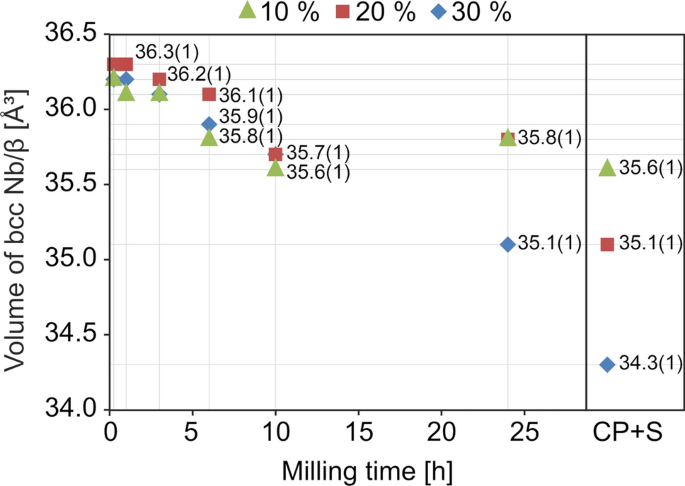
Figure 5 shows the evolution of the bcc β phase’s unit cell volume during the various steps of MA (milling duration, sintering). The unit cell volume was determined using Rietveld refinement using the diffractograms presented in Figs. 3 and 4. The uncertainties are based on the differences in the used numerical models for the same data set and do not include the effects of reproducibility of the milling process and XRD measurements.
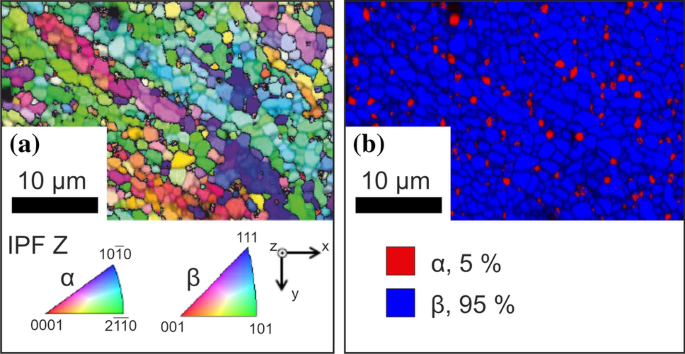
The volume of the unit cell decreased with increasing milling time up to 10 h, independent of the Nb contents. After 24 h, the unit cell volume for alloy powders containing 10 and 20% Nb did not show a significant reduction, however, for Ti30Nb it continued to reduce almost linearly in time to 35.1 Å3. During the last production steps (cold pressing and sintering) the unit cell volume decreased again for all MA samples. A clear trend can be seen for different Nb concentrations, decreasing from 35.6 Å3 for the MA_Ti10Nb sample to 34.1 Å3 for the MA_Ti30Nb one. EBSD was used to confirm the phase structure of the MA_Ti30Nb sample after milling and sintering (Fig. 6). The sample contained 95% β and approx. 5% α. The grain size distribution for both phases is relatively large, with an average grain size of 500 nm for α and 1.2 µm for β, respectively, with a standard deviation of approximately 50% of the averaged values for both. This proves that MA_Ti30Nb is an ultrafine-grained material, which normally would not be achievable through arc-melting or conventional powder metallurgy. The porosity of the MA_TiXNb samples (ranging from 18.6 to 26.4 vol. %, as shown in Fig. S2 in Supplementary Materials) was significantly higher than that of the PM_TiXNb samples. This was due to the lower compaction of MA_Ti20Nb, which resulted from the increased tendency of powder particles to weld during mechanical alloying, forming larger agglomerates. It is unclear to the authors why the cold welding phenomenon was more intense in Ti20Nb alloys compared to Ti10Nb and Ti30Nb. Sample MA_Ti20Nb had the highest porosity of all the samples, with an overall porosity of 26.4%. The pores are larger and connect to form channels compared to the other samples. Additionally, the pre-sintered agglomerated particles are visible in the sample’s microstructure, along with the necks formed in the contact area between them.
EBSD analysis of cold pressed and sintered at 1000 °C MA Ti30Nb alloy a crystal orientation maps of α and β phases. The IPF colour is displayed for the z-direction (cold pressing axis); b α and β phase distribution map. The crystal orientation maps were acquired using electron beam conditions of 20 kV and 10 nA, with a 100 nm step size.
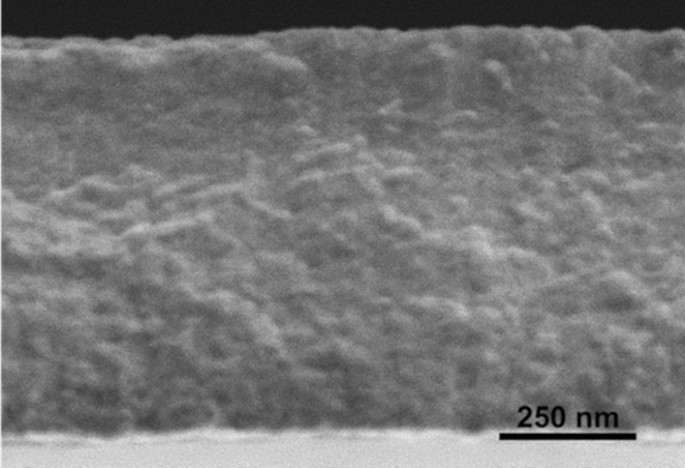
XRF mapping was performed to determine the thickness and composition gradient across the deposited film. Afterwards, the wafer was cleaved and an example fracture cross section of the HiPIMS-produced film is presented in Fig. 7. It can be seen that the film is highly compact with no visible columns, in contrast to what has been reported for DCMS [59].
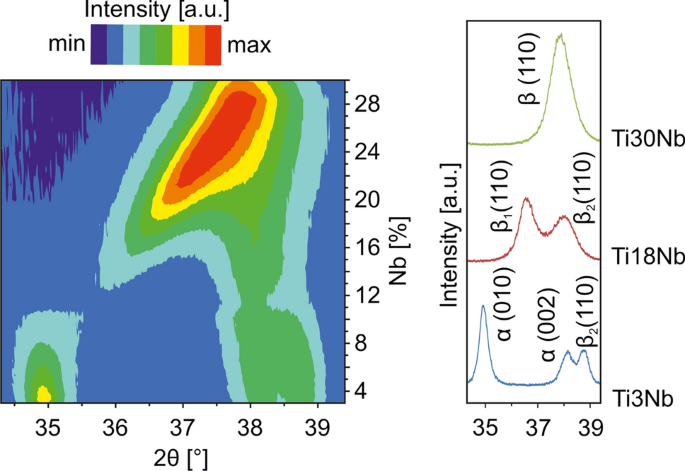
The obtained diffractograms revealed that the films are all highly textured. The intensities of the peaks coming from the (110) lattice plane are much more intense compared to others. The XRD analysis of the TF_Ti < 40Nb sample (large concentration spread) shows clear trends in the formation of different phases with varying Nb contents. Figure 8 summarises the XRD diffraction angle scans performed at different wafer positions, mainly along the border between the extremes of the concentration range. For Nb concentrations of 3–30%, it is possible to distinguish four different peaks in the 2θ range of 34–40°. These peaks are attributed to 3 different phases: (1) Peaks at 34.9 and 38.3° are linked to the α hcp P63/mmc lattices (010) and (002), respectively, (2) The peak at 38.8° for Nb contents of 3% shifting to lower angles with increasing Nb contents is attributed to the β2 cubic body-centred Im-3 m lattice (110), and (3) the fourth peak, visible for a Nb contents > 12%, which shifts to higher angles with increasing Nb contents, cannot be unambiguously attributed to a known phase of the Ti-Nb system, however, it is labelled as β1 throughout the text. The peaks of different planes belonging to α, β1, or β2 were not observed in the diffractograms of the film alloys due to their highly textured structure. The oxygen contents for the produced materials are predicted to be < 5 at.% as in other studies, where HiPIMS was used for producing Ti-based films [60, 61]. Films with Nb concentrations < 10% contained α and β2 phases, i.e. a small amount of Nb is solute in α and the rest forms a separate β2 phase. Following the Nb gradient from 3 to 10%, the peak positions did not shift, however, their relative intensities changed in favour of the β2 peak. At approx. 10% Nb, the intensities of the α peaks at 34.9° (010) and 38.3° (002) significantly drop, giving rise to a new reflex initially observed at 35.7°, which the authors have attributed to β1 (110). As the deposited films are highly textured, attribution based solely on XRD is questionable. The authors have adopted this interpretation, as with increasing Nb contents, the two peaks continuously move to a single peak, attributed to β. When looking into areas of increasingly high Nb contents, the two reflexes shift and move together, i.e. the β1 (110) phase shifts to larger angles, whereas the β2 peaks move to smaller angles to finally form a single peak for an approx. Nb contents of 30%.
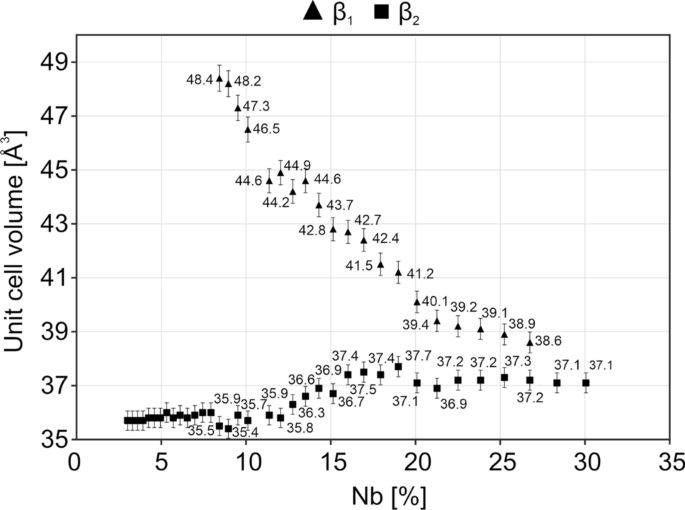
Based on the observed peak positions and under the assumption that both peaks belong to a bcc structure, the evolution of the unit cell volume was determined as a function of increasing Nb contents in the TF_Ti < 40Nb film (Fig. 9) via Rietveld refinement.
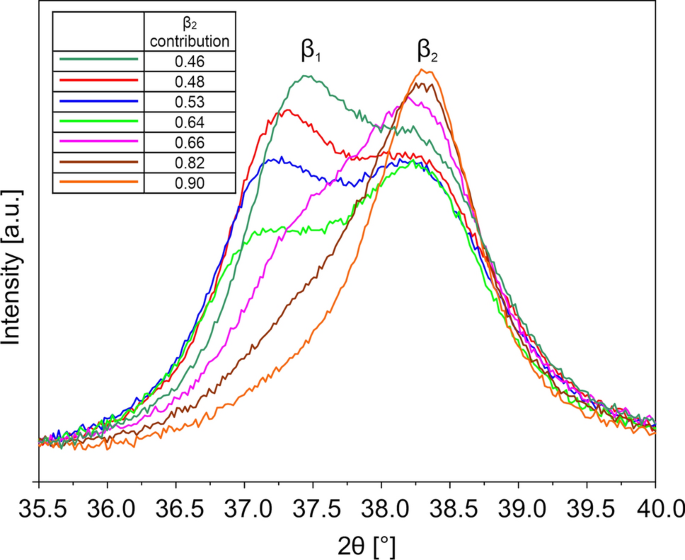
The unit cell volumes of β1 and β2 are influenced by the Nb contents. The unit cell volume of the β2 phase remained stable at 36.7 Å3, with some fluctuations for Nb concentrations below 10% (still possible to identify α, however, not yet β1). Above this Nb contents (α replaced by β1) the unit cell volume increased to reach a local maximum of 37.7 Å3 for 19% Nb to then slowly drop to a value of 37.1 Å3. The unit cell of the β1 phase, which replaced α for Nb concentrations > 8%, first shrunk rapidly from 48.4 to 41.1 Å3 at a Nb contents of 19% to slowly drop until β2 and β1 became indistinguishable at a Nb contents of 28%. Figure 10 shows a detailed X-ray diffractogram obtained from different spots on the wafer, all exhibiting the same chemical composition of Ti23Nb. The Nb contents variation was less than 2%, however, the mean energy and angle of incidence of the film-forming particles differed, as the relative position of the spots to the magnetron sources was not the same. The position of the peak attributed to the (110) plane of β1 and β2 is the same for all measured regions, however, their relative contribution changed considerably between 46 and 90% β2. It can be summarised that the unit cell volume of the two phases depends only on the relative amount of Nb incorporated into the film, whereas the relative phase distribution depends on the detailed changes of the deposition environment.
Mechanical properties
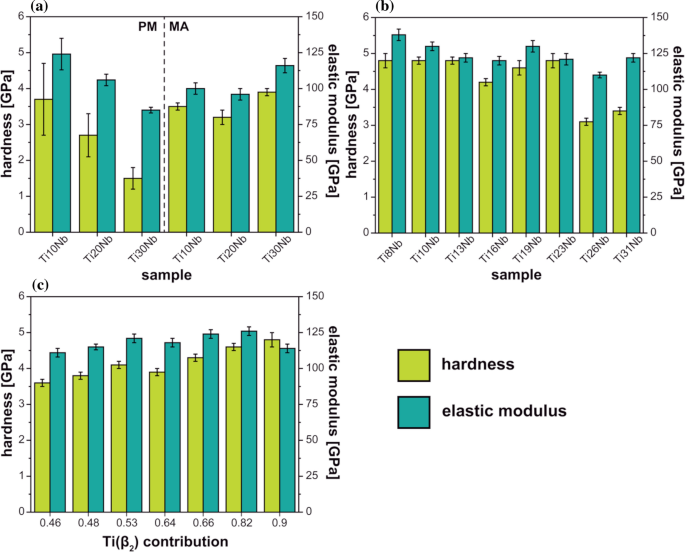
The mechanical properties of the PM (PM_TixNb) and MA (MA_TiXNb) bulk samples are summarised in Fig. 11a. For the PM samples, both the materials’ hardness and Young’s modulus decreased with increasing Nb contents, from approx. 4 to 1.5 and 125 to 85 GPa, respectively. The elastic modulus for MA_Ti10Nb of 99 GPa is significantly lower than the 141 GPa of commercially pure titanium (cp Ti) Grade 2 [46]. The further decrease in both elastic modulus and hardness was observed for MA_Ti20Nb, making the trend similar to that of the PM bulk samples. However, the MA_Ti30Nb alloy exhibited a reversed trend to MA_Ti20Nb, i.e. both the hardness and elastic modulus increased.
Nanoindentation was performed on the film samples (Fig. 11b), where their thickness was ≥ 1 µm to avoid substrate influences. The stated Nb contents may vary by 2% due to sample positioning in the nanoindenter, as the uncertainties in the content differences measured on a single wafer are significantly smaller. For pure Ti deposited in the same manner as the alloys, the hardness and elastic modulus were measured to be approx. 3.9(8) GPa and 153(16) GPa, respectively. For Nb concentrations up to 20%, the hardness increased to approx. 4.8 GPa, whereas a drop in hardness was observed for samples containing 26% Nb (3.1(1) GPa) and 31% Nb (3.4(1) GPa). The Young’s modulus did not vary significantly (between 110 and 138 GPa) and did not follow any specific trends. However, the measured values were lower than for pure Ti. The higher modulus values were, however, generally attained for lower Nb concentrations, when the α phase was still present.
The mechanical properties of the Ti23Nb regions on the TF_Ti30Nb sample, which show a strong variation in the β2 phase distribution (Fig. 10), are shown in Fig. 11c. The hardness of this material increased with increasing β2 contribution from 3.6 to 4.8 GPa. Simultaneously, the elastic modulus increased from 110 to 125 GPa, however, more result scattering occurred. For the thin film samples, as shown in Figs. 11b and c, the mechanical properties depend on the phase composition, particularly the β2 contribution, rather than the Nb content once α disappears.
Discussion
Energy considerations and alloy formation mechanisms in diverse production methods
Ti-Nb alloys with similar chemical compositions but manufactured using different methods were studied. The PM approach involves low-energy processes. The involved energy during cold pressing at 600 MPa is below the meV range and can therefore be considered negligible. Sintering at 800 °C requires thermal energies of 0.1 eV, which is approximately two thirds of the enthalpy of fusion. Aguilar et al. [62] estimated the Gibbs free energy for fabrication by means of MA to be in the range of 5–10 kJ mol−1, corresponding to 0.1 eV at the atomic level. The process of mechanical alloying increases the free Gibbs energy above the mixing energy, which alters the solubility limits through the formation of high-density defects. This study demonstrates that refining crystallites has a greater impact on solubility changes than elastic strain energy caused by a high dislocation density. This highlights the benefits of using mechanical alloying as a preferred technology for powder preparation. However, the technique has a disadvantage in that the produced samples have increased porosities compared to those produced with conventional powder metallurgy. Nevertheless, as previously stated, the MA samples could be further optimised by applying additional consolidation techniques, which would significantly reduce their porosity. Manufacturing Ti-Nb through magnetron sputtering, particularly HiPIMS, involves significantly higher energies. Ions participating in film growth accelerate in the plasma sheath. The energy of the particles can be estimated using the bias voltage, which in this study was −40 V. Due to particle collisions on the way to the substrate (with a mean free path of 13 mm for Ar at 0.5 Pa and room temperature), the average energy will be slightly lower. Additionally, the ions carry potential energy, specifically ionisation energy [63, 64].
Alternatively, we can compare these fabrication methods based on their main alloy formation mechanisms. PM relies mainly on diffusion between Ti and Nb grains during sintering, with negligible contribution from applied pressure. On the other hand, both MA and magnetron sputtering offer additional formation mechanisms. The milling process liberates considerable friction energy, which strongly deforms and reduces the grain size to 20–30 nm in diameter [46]. Defect generation, grain size reduction and forced Nb integration mostly destroy the α phase dominant in the pure Ti precursor powder during milling. These conditions favour the formation of the alloy phase. The high surface-to-volume ratio of the powder increases the interaction zone between the grains during cold pressing and sintering, compared to the PM approach using relatively large grains. The process of forming alloys through film fabrication differs significantly from the two bulk techniques. Magnetron sputtering transfers the target material in the form of a cloud consisting of single atoms and ions, without retaining any memory of the target’s crystalline structure. Each pulse under the HiPIMS conditions contributed to less than one atomic layer. The species that hit the surface and participate in film growth exhibit a wide energy range, from thermal energy to a few tens of electron volts. The more energetic particles transfer their energy to the growing crystals through multiple collisions, allowing for crystal re-arrangements and surface mobility [65,66,67].
The impact of niobium on phase formation and lattice constant variation
The amount of Nb required to achieve β-stabilisation varies depending on the process mechanism. It is highest in the case of PM methods and lowest when using HiPIMS. The proportion of cubic β in the phase composition is significantly greater in the MA materials compared to PM. This is due to the additional energy stored in the milled materials, which favours the formation of β over α. While the authors have not explicitly stated this, there is potential for enhancing material properties by utilising other advanced synthesis techniques, such as spark plasma sintering (SPS). According to existing literature, SPS can enhance mechanical properties by creating materials with a more refined microstructure [68, 69]. However, scalability presents a significant challenge, particularly when scaling up to discs larger than 10 cm in diameter [70, 71]. In the range of 20–30% Nb, the phase structure of the MA samples consists of hcp α and bcc β. However, the phase composition of the HiPIMS films in the same Nb content range does not contain any hcp α. The phase structure analysis revealed metastable phases in both the HiPIMS and MA samples. The HiPIMS samples contained separated bcc phases: β1 and β2, while the MA samples contained orthorhombic Cmcm α”. These are a consequence of non-equilibrium mechanisms. Other authors have confirmed the structural evolution in multiple phases using DCMS as a composition spread alloy thin film. This aligns with the results observed in the fabrication of alloys through pressureless sintering of mechanically alloyed samples [72]. The combined effect of efficient precursor material mixing and non-equilibrium conditions favours the rapid transformation of α into metastable a” and β. The PM samples only contained stable α and β.
The analysis indicates that the lattice constant of β remains unaltered by the Nb content in conventional microcrystalline alloys. However, in the case of the MA samples, an increase in the amount of Nb solute in the Ti lattice results in a reduction in the unit cell volume, as illustrated in Fig. 5. The transition process from α to β stops once all available Nb is consumed during the first 10 h. However, a significant amount of free Nb remained in the case of MA_Ti30Nb powder. The authors are uncertain as to why the reduction in unit cell volume ceased at the same level for both MA_Ti10Nb and MA_Ti20Nb after 10 h, despite the latter having a higher amount of free Nb. Furthermore, peak broadening was observed in both the α and β phases during mechanical alloying. This corresponds to structure fracturing caused by high energy impact during milling and the associated increase in the number of crystal defects, leading to the powders’ hardening during milling [73]. The literature on mechanical alloying technologies, such as [74], has extensively discussed peak broadening and defect formation. The defects found in the analysed powder particles include dislocations, vacancies, stacking faults, and increased grain boundaries. In addition, the formation of crystal defects with a high density can result in the amorphisation of mechanically alloyed powders. Mechanical alloying involves the simultaneous occurrence of cold welding and fracturing phenomena. The process generates high mechanical energy due to multiple collisions between milling balls and powder particles, resulting in particle deformation and fracturing. Cold welding is particularly dominant in the initial stages of the process. The agglomeration of powder particles is promoted by friction, which facilitates mechanically-activated diffusion. Furthermore, the process of cold pressing and sintering resulted in a reduction of the unit cell volume. This phenomenon was attributed to the diffusion of Nb into the β lattice and possibly thermal relaxation.
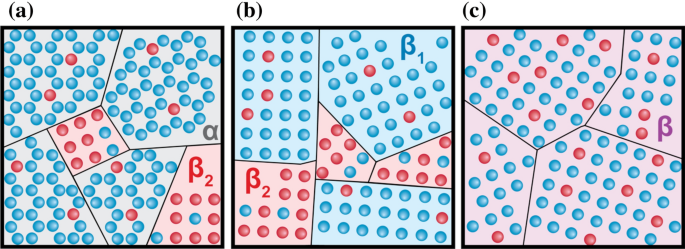
An increase in Nb content in the film samples, particularly in β1, results in a significant reduction of the unit cell volume. The unit cell volume decreased from 48.4 Å3 for the alloy containing approximately 8% Nb content to 37.1 Å3 for 30% Nb content and single-phase structuring. Conversely, the unit cell volume of β2 increased from 35.7 Å3 for low Nb to 37.1 Å3 for high Nb. The value is similar to the literature values found for both pure Nb (36.1 Å3) [75] and Ti (ranging from 35.4 Å3 [76] to 36.2 Å3 [77]). The unit cell volume of the alloy β2, observed along with α, does not change significantly with increasing Nb contents. The increase in unit cell volume only occurs once α has disappeared and β1 is clearly visible. The β2 phase may be due to a Nb-rich phase that incorporates the Nb atoms reaching the α-dominant surface. However, the authors could not provide evidence for this hypothesis. Additionally, the deposited films showed greater texturing than the bulk samples, with randomly oriented grains. The film texturing hindered accurate crystal structure analysis. The texture and microstructure of the film are influenced by the competition between surface and strain energy and can vary with film thickness. For example, TiN texture can change from the (200) plane to the (111) plane as thickness increases, while Ti films change their orientation from (100) to (002). Additionally, (101) plane texture results from thermal stress in DC magnetron sputtered titanium [43, 65,66,67, 78, 79]. Figure 12 schematically shows the phase distribution and domain formation during film deposition.
Impact of Nb on the mechanical properties of Ti-Nb alloys
Regardless of the production method, nanoindentation results show that the addition of Nb, which acts as a β-stabiliser, reduces the Young’s modulus of the alloys in comparison to pure Ti. The correlation between Nb content, hardness, and Young’s modulus observed in this study is consistent with the findings of other researchers [13, 80, 81]. The hardness and elastic modulus of the MA samples decreased with only a 10% Nb concentration due to the formation of a triple-phase structure consisting of α″, β and α. The reduction between MA_Ti10Nb and MA_Ti20Nb is due to the transition from a triple-phase structure (with α and α″ contents of approximately 80%) to a dual-phase structure with a dominant β content of approximately 91%. Tan et al. [80] produced alloys using a conventional casting technique to create TixNb4Zr alloys (x = 14, 17, 20). They observed the formation of two different phase structures in the materials produced: α′ + α″ + β + ω and β + α″. These structures significantly influenced the properties of the alloys. The Young’s modulus decreased from approximately 36 GPa to 29 GPa as the content of β phase increased and the content of α′ + α″ + ω phases decreased with Nb content. The decrease in modulus is explained by two factors: (1) An increase in α” phase content during the expansion of α΄ and α” phase, and (2) The dominance of β phase in the Ti20Nb4Zr alloy structure. This effect of Nb content on hardness and Young’s modulus has also been observed in other alloys, such as TixNb6Fe (x from 0 to 6) [13], where the Young’s modulus was lower than that of all PM_TixNb, MA_TixNb, and TF_TixNb alloys. Ehtemam-Haghighi et al. [81] found comparable correlations between the structure, composition, and mechanical properties of alloys stabilised by other elements, such as Fe and Ta. The alloys’ structures comprise of the α″ and β phases, with the Ti9Fe3Ta alloy having the highest content. This alloy exhibits mechanical properties, such as a hardness of 3.4 GPa and a Young’s modulus of 93 GPa, similar to those in the current work.
It is important to note that PM_30Nb and MA_Ti20Nb have a similar crystal structure (β content of approximately 91%) and a similar Young modulus of approximately 85 and 96 GPa for the PM and MA samples, respectively. However, their hardnesses differ significantly, with 1.5 GPa for PM_30Nb and 3.2 GPa for MA_Ti20Nb. This difference is due to grain refinement induced via MA, which does not occur during conventional processes [82]. The lower elastic modulus of sample PM_30Nb may be correlated with its lower hardness compared to the other produced samples. This material is primarily hardened through solid solution hardening without grain boundaries and precipitation strengthening. These three hardening effects affect the mechanical properties of Ti-based alloys [83, 84]. Sample MA_Ti30Nb showed an increase in hardness and modulus (to 3.9 and 116 GPa, respectively) with increasing Nb content. The main reason for the increase in Young’s modulus is not yet clear, but it may be related to the microstructure of that particular sample. Additionally, the EBSD distribution maps show a small amount of fine-grained α present in the matrix composed of β, which is atypical (see Fig. 6). This could explain the increase in hardness from 3.1 to 3.9 GPa without significant changes in the crystal structure. It is worth noting that the authors did not observe Nb particles with XRD analysis, which have been shown to increase the Young modulus in other research [27]. Mechanical alloying before sintering offers a significant advantage in producing powders with a single phase Ti-based β-structure. The presence of unmelted Nb particles suggests the need for increased mechanical alloying time, but this issue can be resolved with the application of this technology, as noted in some articles [85]. Previous research has reported a non-continuous reduction in elastic modulus, similar to what was observed in this study between MA_Ti20Nb and MA_Ti30Nb [86]. Specifically, the elastic modulus decreased for the Ti5Nb alloy compared to pure titanium (69 GPa), increased for Ti8Nb (88 GPa), and then decreased again for Ti12Nb (77 GPa). However, the elastic modulus of all alloys in these studies, including Ti8Nb, was lower than that of commercially pure titanium (107 GPa).
Due to differences in the method of determining elastic modulus, it is not easy to compare the obtained results with those obtained in the referenced works. This issue was previously highlighted by authors such as Iijima et al. [87], who attributed the differences to the influence of varying volumes across different testing techniques. The larger measured volume increases the likelihood of the influence of microscopic and macroscopic structural defects on the measured modulus, including defects such as porosity. It is important to note the so-called indentation size effect (ISE), which was studied by Garbiec et al. [88] and Rodríguez et al. [89]. These authors have analysed the phenomenon taking into consideration various differences in material properties at the macro-, micro-, and nanoscale. Our research has led to the successful production of alloys with a lower Young’s modulus. For instance, the Ti30Nb30Zr alloy [58] had a Young’s modulus of 68 GPa, while the Ti23Zr25Nb-45S5 Bioglass composite [90] and the Ti23Zr25Nb with about 70% porosity functionalised by the addition of 40% ammonium bicarbonate foaming agent [90] had Young’s moduli of 43 and 56 GPa, respectively. The reduction of the Young modulus was achieved in these studies through the modification of the materials with Zr content, the addition of 45S5 Bioglass bioceramics, and the production of foams with significant porosities.
The hardness and elastic modulus of thin films are affected not only by their chemical composition but also by the deposition parameters and the relative position of the deposition spot to the sputtering targets (see Fig. 11b and c). The authors have not yet determined the cause of the significant variation in the mechanical properties of the films. No relations between Co-Cr-Ni-Fe film structure and mechanical properties were observed in studies using the Nelson–Riley method and convolutional multiple whole profile (CMWP) analysis [91, 92]. Further work is required, including detailed microstructural studies, such as transmission electron microscopy investigations. These investigations will improve our understanding of the spinodal decomposition of the β phase during film deposition, the texture of the films and its effect on the hardness of the materials. In addition, it is necessary to investigate the formation mechanisms of binary systems in other production routes and the differences in nanostructure between the MA_Ti20Nb and MA_Ti30Nb alloys. This would facilitate a more detailed characterisation and comparison in α phase participation between MA_Ti20Nb and MA_Ti30Nb alloys and their effect on the mechanical properties of the alloys produced will also be investigated in detail. It is important to note that the mechanical properties of a material depend on various factors, including grain size and texture, when comparing samples produced by different methods [93,94,95]. The produced samples should also be monitored for mechanical behaviour, biological properties, corrosion resistance and microstructure.
Conclusion
This study analysed Ti-Nb alloys produced by three different methods: conventional powder metallurgy (PM), mechanical alloying (MA), and high-power impulse magnetron sputtering (HiPIMS). The analysis and the experiments have led to the following conclusions:
-
(1)
The techniques used for fabrication are crucial in determining the phase compositions and structural evolution of the material. PM relies on grain diffusion, MA increases free energy over mixing energy, while HiPIMS transfers materials as single atoms and ions from a sputtering target.
-
(2)
The manufacturing process is of critical importance in the formation of the β phase in the alloys produced. The samples produced by MA and HiPIMS contain a greater number of metastable phases (β1, β2 and αʹʹ) compared to PM samples. HiPIMS samples contain body-centred cubic β1 and β2 phases with high texture and different lattice constants. Conversely, the MA_Ti10Nb sample contains an orthorombic αʹʹ phase. Furthermore, the higher energy stored in the high-density defects of the MA samples resulted in a higher β content compared to the PM samples
-
(3)
The Young’s modulus of the MA samples decreased at Nb concentrations of 10% (100 GPa) and 20% (96 GPa), followed by an increase at a Nb content of 30% (116 GPa). The increase in hardness for MA samples can be attributed to grain refinement. The mechanical properties of the film were found to be correlated with the deposition conditions.
References
Long M, Rack HJ (1998) Titanium alloys in total joint replacement—A materials science perspective. Biomaterials 19:1621–1639
Elias CN, Lima JHC, Valiev R, Meyers MA (2008) Biomedical applications of titanium and its alloys. Jom 60:46–49. https://doi.org/10.1007/s11837-008-0031-1
Carlsson L, Röstlund T, Albrektsson B et al (1986) Osseointegration of titanium implants. Acta Orthop 57:285–289. https://doi.org/10.3109/17453678608994393
Ratner BD (2001) A Perspective on Titanium Biocompatibility. In: Brunette DM, Tengvall P, Textor M, Thomsen P (eds) Titanium in Medicine. Springer Berlin Heidelberg, Berlin, Heidelberg, pp 1–12. https://doi.org/10.1007/978-3-642-56486-4_1
Chen Q, Thouas GA (2015) Metallic implant biomaterials. Mater Sci Eng R Rep 87:1–57. https://doi.org/10.1016/j.mser.2014.10.001
Langley A, Charles TD (2015) Modern metal implant toxicity and anaesthesia. Australasian Anaesthesia 2015:57–65
Niinomi M (1998) Mechanical properties of biomedical titanium alloys. Mater Sci Eng, A 243:231–236. https://doi.org/10.1016/s0921-5093(97)00806-x
Niinomi M, Nakai M (2011) Titanium-based biomaterials for preventing stress shielding between implant devices and bone. Int J Biomater. https://doi.org/10.1155/2011/836587
Kuroda D, Niinomi M, Morinaga M et al (1998) Design and mechanical properties of new β type titanium alloys for implant materials. Mater Sci Eng, A 243:244–249. https://doi.org/10.1016/s0921-5093(97)00808-3
Okazaki Y, Ito Y, Kyo K, Tateishi T (1996) Corrosion resistance and corrosion fatigue strength of new titanium alloys for medical implants without V and Al. Mater Sci Eng, A. https://doi.org/10.1016/0921-5093(96)10247-1
Mantani Y, Tajima M (2006) Effect of ageing on internal friction and elastic modulus of Ti-Nb alloys. Mater Sci Eng, A 442:409–413. https://doi.org/10.1016/j.msea.2006.03.124
Chang LL, Wang YD, Ren Y (2016) In-situ investigation of stress-induced martensitic transformation in Ti-Nb binary alloys with low Young’s modulus. Mater Sci Eng A 651:442–448. https://doi.org/10.1016/j.msea.2015.11.005
Ehtemam-Haghighi S, Liu Y, Cao G, Zhang LC (2016) Influence of Nb on the β → α″ martensitic phase transformation and properties of the newly designed Ti-Fe-Nb alloys. Mater Sci Eng, C 60:503–510. https://doi.org/10.1016/j.msec.2015.11.072
Lee CM, Ju CP, Chern Lin JH (2002) Structure-property relationship of cast Ti-Nb alloys. J Oral Rehabil 29:314–322. https://doi.org/10.1046/j.1365-2842.2002.00825.x
Han MK, Kim JY, Hwang MJ et al (2015) Effect of Nb on the microstructure, mechanical properties, corrosion behavior, and cytotoxicity of Ti-Nb alloys. Materials 8:5986–6003. https://doi.org/10.3390/ma8095287
Xiao X, Yang K, Lei S et al (2023) A β-type titanium alloy with high strength and low elastic modulus achieved by spinodal decomposition. J Alloys Compd 963:171270. https://doi.org/10.1016/j.jallcom.2023.171270
Ishiguro Y, Tsukada Y, Koyama T (2020) Phase-field study of the spinodal decomposition rate of β phase in oxygen-added Ti–Nb alloys. Comput Mater Sci 174:109471. https://doi.org/10.1016/j.commatsci.2019.109471
Murray JL (1981) The Mo-Ti (Molybdenum-Titanium) system. Bull Alloy Phase Diagrams 2:185–192. https://doi.org/10.1007/BF02881476
Banumathy S, Prasad KS, Mandal RK, Singh AK (2011) Effect of thermomechanical processing on evolution of various phases in Ti-Nb alloys. Bull Mater Sci. https://doi.org/10.1007/s12034-011-0338-3
Moffat DL, Kattner UR (1988) Stable and metastable Ti-Nb phase diagrams. Metall Trans A Phys Metall Mater Sci 19:2389–2397. https://doi.org/10.1007/BF02645466
Suryanarayana C (2019) Mechanical alloying: a novel technique to synthesize advanced materials. Research 2019:1–17. https://doi.org/10.34133/2019/4219812
Zhuravleva K, Scudino S, Khoshkhoo MS et al (2013) Mechanical alloying of β-type Ti-Nb for biomedical applications. Adv Eng Mater 15:262–268. https://doi.org/10.1002/adem.201200117
Kalita D, Rogal Ł, Czeppe T et al (2020) Microstructure and mechanical properties of Ti-Nb alloys prepared by mechanical alloying and spark plasma sintering. J Mater Eng Perform 29:1445–1452. https://doi.org/10.1007/s11665-019-04417-0
Karre R, Kodli BK, Rajendran A et al (2019) Comparative study on Ti-Nb binary alloys fabricated through spark plasma sintering and conventional P/M routes for biomedical application. Mater Sci Eng C 94:619–627. https://doi.org/10.1016/j.msec.2018.10.006
Wang JC, Liu YJ, Qin P et al (2019) Selective laser melting of Ti–35Nb composite from elemental powder mixture: microstructure, mechanical behavior and corrosion behavior. Mater Sci Eng: A 760:214–224. https://doi.org/10.1016/j.msea.2019.06.001
Wang JC, Liu YJ, Liang SX et al (2022) Comparison of microstructure and mechanical behavior of Ti-35Nb manufactured by laser powder bed fusion from elemental powder mixture and prealloyed powder. J Mater Sci Technol 105:1–16. https://doi.org/10.1016/j.jmst.2021.07.021
Wang J, Liu Y, Rabadia CD et al (2021) Microstructural homogeneity and mechanical behavior of a selective laser melted Ti-35Nb alloy produced from an elemental powder mixture. J Mater Sci Technol 61:221–233. https://doi.org/10.1016/j.jmst.2020.05.052
Gebhardt T, Music D, Takahashi T, Schneider JM (2012) Combinatorial thin film materials science: from alloy discovery and optimization to alloy design. Thin Solid Films 520:5491–5499
Fleutot B, Miller JB, Gellman AJ (2012) Apparatus for deposition of composition spread alloy films: the rotatable shadow mask. J Vac Sci Technol, A: Vac, Surf Films. https://doi.org/10.1116/1.4766194
Priyadarshini D, Kondratyuk P, Miller JB, Gellman AJ (2012) Compact tool for deposition of composition spread alloy films. J Vac Sci Technol, A: Vac, Surf Films. https://doi.org/10.1116/1.3664078
Selinder TI, Miller DJ, Gray KE et al (1995) Phase formation and microstructure of Nb1 - xAlxN alloy films grown on MgO (001) by reactive sputtering: a new ternary phase. Vacuum. https://doi.org/10.1016/0042-207X(95)00161-1
Potyrailo R, Rajan K, Stoewe K et al (2011) Combinatorial and high-throughput screening of materials libraries: Review of state of the art. ACS Comb Sci 43:579–633
Ludwig A (2019) Discovery of new materials using combinatorial synthesis and high-throughput characterization of thin-film materials libraries combined with computational methods. NPJ Comput Mater 5:70
Gonzalez ED, Afonso CRM, Nascente PAP (2018) Nanostructural characterization of sputter deposited Ti-Nb coatings byautomated crystallographic orientation mapping. Thin Solid Films. https://doi.org/10.1016/j.tsf.2018.06.051
Sarakinos K, Alami J, Konstantinidis S (2010) High power pulsed magnetron sputtering: a review on scientific and engineering state of the art. Surf Coat Technol 204:1661–1684
Gudmundsson JT, Brenning N, Lundin D, Helmersson U (2012) High power impulse magnetron sputtering discharge. J Vac Sci Technol, A: Vac, Surf Films 30:030801. https://doi.org/10.1116/1.3691832
de Monteynard A, Schuster F, Billard A, Sanchette F (2017) Properties of chromium thin films deposited in a hollow cathode magnetron powered by pulsed DC or HiPIMS. Surf Coat Technol 330:241–248. https://doi.org/10.1016/j.surfcoat.2017.10.006
Weichart J, Elghazzali M, Kadlec S, Ehiasarian AP (2009) PVD processes in high aspect ratio features by HIPIMS. In: 52nd Annual technical conference proceedings. Society of Vacuum Coaters. pp 201–206
Barker PM, Lewin E, Patscheider J (2013) Modified high power impulse magnetron sputtering process for increased deposition rate of titanium. J Vac Sci Technol, A: Vac, Surf Films 31:060604. https://doi.org/10.1116/1.4819296
Lewin E, Loch D, Montagne A et al (2013) Comparison of Al-Si-N nanocomposite coatings deposited by HIPIMS and DC magnetron sputtering. Surf Coat Technol 232:680–689. https://doi.org/10.1016/j.surfcoat.2013.06.076
Ait Aissa K, Achour A, Camus J et al (2014) Comparison of the structural properties and residual stress of AlN films deposited by dc magnetron sputtering and high power impulse magnetron sputtering at different working pressures. Thin Solid Films 550:264–267. https://doi.org/10.1016/j.tsf.2013.11.073
Lundin D, Sarakinos K (2012) An introduction to thin film processing using high-power impulse magnetron sputtering. J Mater Res 27:780–792
Jing FJ, Yin TL, Yukimura K et al (2012) Titanium film deposition by high-power impulse magnetron sputtering: influence of pulse duration. Vacuum 86:2114–2119. https://doi.org/10.1016/j.vacuum.2012.06.003
Barker PM, Konstantinidis S, Lewin E et al (2014) An investigation of c-HiPIMS discharges during titanium deposition. Surf Coat Technol 258:631–638. https://doi.org/10.1016/j.surfcoat.2014.08.025
Schmidt S, Czigány Z, Greczynski G et al (2012) Ion mass spectrometry investigations of the discharge during reactive high power pulsed and direct current magnetron sputtering of carbon in Ar and Ar/N 2. J Appl Phys 112:013305. https://doi.org/10.1063/1.4733692
Marczewski M, Miklaszewski A, Jurczyk M (2018) Structure evolution analysis in ultrafine-grained Zr and Nb-based beta titanium alloys. J Alloys Compd 765:459–469. https://doi.org/10.1016/j.jallcom.2018.06.224
Sochacka P, Miklaszewski A, Jurczyk M (2019) Development of β-type Ti-x at.% Mo alloys by mechanical alloying and powder metallurgy: phase evolution and mechanical properties (10 ≤ x ≤ 35). J Alloys Compd 776:370–378. https://doi.org/10.1016/j.jallcom.2018.10.217
Hain C, Brown D, Welsh A et al (2022) From pulsed-DCMS and HiPIMS to microwave plasma-assisted sputtering: their influence on the properties of diamond-like carbon films. Surf Coat Technol 432:127928. https://doi.org/10.1016/J.SURFCOAT.2021.127928
Lapeyre L, Wieczerzak K, Hain C et al (2022) Influence of HiPIMS pulse widths on the deposition behaviour and properties of CuAgZr compositionally graded films. Surf Coat Technol 450:129002. https://doi.org/10.1016/J.SURFCOAT.2022.129002
Hain C, Schweizer P, Sturm P et al (2023) Microwave plasma-assisted reactive HiPIMS of InN films: plasma environment and material characterisation. Surf Coat Technol 454:129188. https://doi.org/10.1016/J.SURFCOAT.2022.129188
Latrasse L, Radoiu M, Nelis T, Antonin O (2017) Self-matching plasma sources using 2.45 GHz solid-state generators: microwave design and operating performance. J Microwave Power Electromagn Energy 51:237–258. https://doi.org/10.1080/08327823.2017.1388338
Post JE, Bish DL (2018) Rietveld refinement of crystal structures using powder x-ray diffraction data. Modern Powder Diffraction. Mineralogical Society of America Washington DC, USA, pp 277–308
Mccusker LB, Von Dreele RB, Cox DE et al (1999) Rietveld refinement guidelines. J Appl Crystallogr 32:36–50. https://doi.org/10.1107/S0021889898009856
Bish DL, Howard SA (1988) Quantitative phase analysis using the Rietveld method. J Appl Crystallogr 21:86–91. https://doi.org/10.1107/S0021889887009415
Kniess CT, Cardoso de Lima J, Prates PB (2012) The quantification of crystalline phases in materials: applications of rietveld method. In: Sintering—Methods and Products. InTech Brazil, pp 293–316
Oliver WC, Pharr GM (1992) An improved technique for determining hardness and elastic modulus using load and displacement sensing indentation experiments. J Mater Res 7:1564–1583. https://doi.org/10.1557/jmr.1992.1564
Hertzberg RW, Vinci RP, Hertzberg JL (1976) Elastic Response of Solids. Deformation and Fracture Mechanics of Engineering Materials. John Wiley and Sons Inc, Hoboken
Marczewski M, Miklaszewski A, Maeder X, Jurczyk M (2020) Crystal structure evolution, microstructure formation, and properties of mechanically alloyed ultrafine-grained Ti-Zr-Nb alloys at 36 ≤ Ti ≤ 70 (at.%). Materials 13:587. https://doi.org/10.3390/ma13030587
Achache S, Lamri S, Alhussein A et al (2016) Gum Metal thin films obtained by magnetron sputtering of a Ti-Nb-Zr-Ta target. Mater Sci Eng, A 673:492–502. https://doi.org/10.1016/j.msea.2016.07.096
Shu R, Du H, Sadowski G et al (2021) Multicomponent TixNbCrAl nitride films deposited by dc and high-power impulse magnetron sputtering. Surf Coat Technol 426:127743. https://doi.org/10.1016/j.surfcoat.2021.127743
Bachani SK, Wang CJ, Lou BS et al (2021) Fabrication of TiZrNbTaFeN high-entropy alloys coatings by HiPIMS: effect of nitrogen flow rate on the microstructural development, mechanical and tribological performance, electrical properties and corrosion characteristics. J Alloys Compd 873:159605. https://doi.org/10.1016/j.jallcom.2021.159605
Aguilar C, Martinez C, Tello K et al (2020) Thermodynamic analysis of the formation of FCC and BCC solid solutions of ti-based ternary alloys by mechanical alloying. Metals (Basel) 10:510. https://doi.org/10.3390/met10040510
Shirley CG, Chaplin RL (1972) Evaluation of the threshold energy for atomic displacements in titanium. Phys Rev B 5:2027–2029. https://doi.org/10.1103/PhysRevB.5.2027
Sattonnay G, Rullier-Albenque F, Dimitrov O (1999) Determination of displacement threshold energies in pure Ti and in γ-TiAl alloys by electron irradiation. J Nucl Mater 275:63–73. https://doi.org/10.1016/S0022-3115(99)00109-9
Rauschenbach B, Gerlach JW (2000) Texture development in titanium nitride films grown by low-energy ion assisted deposition. Cryst Res Technol. https://doi.org/10.1002/1521-4079(200007)35:6/7%3c675::AID-CRAT675%3e3.0.CO;2-7
Pelleg J, Zevin LZ, Lungo S, Croitoru N (1991) Reactive-sputter-deposited TiN films on glass substrates. Thin Solid Films. https://doi.org/10.1016/0040-6090(91)90225-M
Oh UC, Je JH (1993) Effects of strain energy on the preferred orientation of TiN thin films. J Appl Phys 74:1692–1696. https://doi.org/10.1063/1.355297
Hussein MA, Suryanarayana C, Al-Aqeeli N (2015) Fabrication of nano-grained Ti-Nb-Zr biomaterials using spark plasma sintering. Mater Des 87:693–700. https://doi.org/10.1016/j.matdes.2015.08.082
Mavros N, Larimian T, Esqivel J et al (2019) Spark plasma sintering of low modulus titanium-niobium-tantalum-zirconium (TNTZ) alloy for biomedical applications. Mater Des 183:108163. https://doi.org/10.1016/j.matdes.2019.108163
Guillon O, Gonzalez-Julian J, Dargatz B et al (2014) Field-assisted sintering technology/spark plasma sintering: mechanisms, materials, and technology developments. Adv Eng Mater 16:830–849
Mamedov V (2002) Spark plasma sintering as advanced PM sintering method. Powder Metall 45:322–328. https://doi.org/10.1179/003258902225007041
Gutiérrez Moreno JJ, Bönisch M, Panagiotopoulos NT et al (2017) Ab-initio and experimental study of phase stability of Ti-Nb alloys. J Alloys Compd 696:481–489. https://doi.org/10.1016/j.jallcom.2016.11.231
Adamek G, Jakubowicz J (2010) Microstructure of the mechanically alloyed and electrochemically etched Ti-6Al-4V and Ti-15Zr-4Nb nanocrystalline alloys. Mater Chem Phys 124:1198–1204. https://doi.org/10.1016/j.matchemphys.2010.08.057
Suryanarayana C (2001) Mechanical alloying and milling. Prog Mater Sci 46:1–184. https://doi.org/10.1016/S0079-6425(99)00010-9
Roberge R (1975) Lattice parameter of niobium between 4.2 and 300 K. J Less-Common Metals 40:161–164. https://doi.org/10.1016/0022-5088(75)90193-9
Levinger BW (1953) Lattice parameter of beta titanium at room temperature. Jom 5:195–195. https://doi.org/10.1007/bf03397474
Eppelsheimer DS, Penman RR (1950) Accurate determination of the lattice of beta-titanium at 900°C. Nature 166:960
Ma DL, Li YT, Deng QY et al (2019) Tailoring the texture of titanium thin films deposited by high-power pulsed magnetron sputtering. Int J Mod Phys B 33:1–7. https://doi.org/10.1142/S0217979219400174
Chawla V, Jayaganthan R, Chawla AK, Chandra R (2009) Microstructural characterizations of magnetron sputtered Ti films on glass substrate. J Mater Process Technol 209:3444–3451. https://doi.org/10.1016/j.jmatprotec.2008.08.004
Tan MHC, Baghi AD, Ghomashchi R et al (2019) Effect of niobium content on the microstructure and Young’s modulus of Ti-xNb-7Zr alloys for medical implants. J Mech Behav Biomed Mater 99:78–85. https://doi.org/10.1016/j.jmbbm.2019.07.014
Ehtemam-Haghighi S, Cao G, Zhang LC (2017) Nanoindentation study of mechanical properties of Ti based alloys with Fe and Ta additions. J Alloys Compd 692:892–897. https://doi.org/10.1016/j.jallcom.2016.09.123
Suryanarayana C, Froes FH (1993) Mechanical alloying of titanium-base alloys. Adv Mater 5:96–106
Shimagami K, Matsunaga S, Yumoto A et al (2017) Solid solution hardening and precipitation hardening of α2-Ti3Al in Ti-Al-Nb alloys. Mater Trans 58:1404–1410. https://doi.org/10.2320/matertrans.MAW201707
Jawed SF, Rabadia CD, Liu YJ et al (2020) Strengthening mechanism and corrosion resistance of beta-type Ti-Nb-Zr-Mn alloys. Mater Sci Eng C 110:110728. https://doi.org/10.1016/j.msec.2020.110728
Khimich MA, Prosolov KA, Mishurova T et al (2021) Advances in laser additive manufacturing of ti-nb alloys: from nanostructured powders to bulk objects. Nanomaterials 11:1159. https://doi.org/10.3390/nano11051159
Zhang Y, Sun D, Cheng J et al (2019) Mechanical and biological properties of Ti-(0–25 wt%)Nb alloys for biomedical implants application. Regen Biomater 7:119–127. https://doi.org/10.1093/rb/rbz042
Iijima M, Muguruma T, Brantley WA, Mizoguchi I (2011) Comparisons of nanoindentation, 3-point bending, and tension tests for orthodontic wires. Am J Orthod Dentofacial Orthop 140:65–71. https://doi.org/10.1016/j.ajodo.2009.11.015
Garbiec D, Leshchynsky V, Colella A et al (2019) Structure and deformation behavior of Ti-SiC composites made by mechanical alloying and spark plasma sintering. Materials 12:1276. https://doi.org/10.3390/ma12081276
Rodríguez R, Gutierrez I (2003) Correlation between nanoindentation and tensile properties influence of the indentation size effect. Mater Sci Eng: A 361:377–384. https://doi.org/10.1016/S0921-5093(03)00563-X
Marczewski M, Jurczyk MU, Kowalski K et al (2020) Composite and surface functionalization of ultrafine-grained Ti23Zr25Nb alloy for medical applications. Materials 13:1–18. https://doi.org/10.3390/ma13225252
Nagy P, Rohbeck N, Hegedűs Z et al (2021) Microstructure, hardness, and elastic modulus of a multibeam-sputtered nanocrystalline Co-Cr-Fe-Ni compositional complex alloy film. Materials 14:3357. https://doi.org/10.3390/ma14123357
Nagy P, Rohbeck N, Widmer RN et al (2022) Combinatorial study of phase composition, microstructure and mechanical behavior of Co-Cr-Fe-Ni nanocrystalline film processed by multiple-beam-sputtering physical vapor deposition. Materials 15:2319. https://doi.org/10.3390/ma15062319
Wieczerzak K, Michler J, Wheeler JM et al (2020) An in situ and ex situ study of χ phase formation in a hypoeutectic Fe-based hardfacing alloy. Mater Des 188:108438. https://doi.org/10.1016/j.matdes.2019.108438
Wieczerzak K, Nowicka O, Michalski S et al (2021) Ultrastrong nanocrystalline binary alloys discovered via high-throughput screening of the CoCr system. Mater Des 205:109710. https://doi.org/10.1016/j.matdes.2021.109710
Vlassak JJ, Nix WD (1994) Measuring the elastic properties of anisotropic materials by means of indentation experiments. J Mech Phys Solids 42:1223–1245. https://doi.org/10.1016/0022-5096(94)90033-7
Acknowledgements
The authors acknowledge financial support through Eurostars projects, PlasmaS3Tream (E!12507) and IonDrive (E!114277). The authors would like to thank Laszlo Pethö and Dr. Nadia Rohrbeck for their support with experimental work. K.W. was supported by the EMPAPOSTDOCS-II program that has received funding from the European Union’s Horizon 2020 research and innovation program under the Marie Skłodowska-Curie grant agreement number 754364.
Author information
Authors and Affiliations
Contributions
M. Marczewski: Conceptualization, Data Curation, Formal analysis, Investigation, Methodology, Writing-Original Draft, Writing-Review and Editing. K. Wieczerzak: Investigation, Writing-Review and Editing. X. Maeder: Investigation, Writing-Review and Editing. L. Lapeyre: Investigation, Writing-Review and Editing. C. Hain: Investigation, Writing-Review and Editing. M. Jurczyk: Investigation, Writing-Review and Editing. T. Nelis: Supervision, Investigation, Methodology, Funding Acquisition, Writing-Original Draft, Writing-Review and Editing.
Corresponding author
Ethics declarations
Conflicts of interest
The authors declare that they have no conflicts of interest.
Ethical approval
Not applicable.
Additional information
Handling Editor: Sophie Primig.
Publisher's Note
Springer Nature remains neutral with regard to jurisdictional claims in published maps and institutional affiliations.
Supplementary Information
Below is the link to the electronic supplementary material.
Rights and permissions
Open Access This article is licensed under a Creative Commons Attribution 4.0 International License, which permits use, sharing, adaptation, distribution and reproduction in any medium or format, as long as you give appropriate credit to the original author(s) and the source, provide a link to the Creative Commons licence, and indicate if changes were made. The images or other third party material in this article are included in the article's Creative Commons licence, unless indicated otherwise in a credit line to the material. If material is not included in the article's Creative Commons licence and your intended use is not permitted by statutory regulation or exceeds the permitted use, you will need to obtain permission directly from the copyright holder. To view a copy of this licence, visit http://creativecommons.org/licenses/by/4.0/.
About this article
Cite this article
Marczewski, M., Wieczerzak, K., Maeder, X. et al. Microstructure and mechanical properties of Ti-Nb alloys: comparing conventional powder metallurgy, mechanical alloying, and high power impulse magnetron sputtering processes for supporting materials screening. J Mater Sci 59, 9107–9125 (2024). https://doi.org/10.1007/s10853-024-09715-0
Received:
Accepted:
Published:
Issue Date:
DOI: https://doi.org/10.1007/s10853-024-09715-0


