
Abstract
Reactive oxygen species (ROS) are involved in both physiological and pathological processes. This widely accepted concept is based more on the effects of antioxidant interventions than on reliable assessments of rates and sites of intracellular ROS formation. This argument applies also to mitochondria that are generally considered the major site for ROS formation, especially in skeletal and cardiac myocytes.
Detection of oxidative modifications of intracellular or circulating molecules is frequently used as a marker of ROS formation. However, this approach provides limited information on spatiotemporal aspects of ROS formation that have to be defined in order to elucidate the role of ROS in a given pathophysiological condition. This information can be obtained by means of fluorescent probes that allow monitoring ROS formation in cell-free extracts and isolated cells. Thus, this approach can be used to characterize ROS formation in both isolated mitochondria and mitochondria within intact cells. This chapter describes three major examples of the use of fluorescent probes for monitoring mitochondrial ROS formation. Detailed methods description is accompanied by a critical analysis of the limitations of each technique, highlighting the possible sources of errors in performing the assay and results interpretation.
Key words
1 Introduction
Although the involvement of reactive oxygen species (ROS) in physiological and pathological processes is widely accepted [1, 2], information on ROS production in biological samples derives from methods that are far from being optimal. An ideal method should provide reliable estimates of the species generated, the cellular site, the kinetics, and the amounts. Also, factors that favor ROS formation or are modified by these oxidant species should be identified to elucidate causal relationships. This is especially the case when mitochondrial ROS formation is investigated in isolated cells or intact organs. Indeed, ROS accumulations can perturb mitochondrial function, yet in most cases mitochondrial dysfunction results in an increased ROS generation further exacerbating the initial mitochondrial derangement. The primary cause of this vicious cycle can hardly be established by means of loss-of-function approaches. Indeed, in most cases the inhibition of mitochondrial pathways for ROS generation, such as respiratory chain complexes, hampers inevitably vital processes of energy conservation [3].
The impact of ROS on mitochondrial and/or cellular homeostasis can be investigated by detecting the oxidation of biomolecules. However, this approach cannot provide a real-time monitoring of ROS formation in living cells. To this aim, imaging techniques have been developed using fluorescent probes or genetically encoded fluorescent proteins [4, 5]. The former compounds are small aromatic molecules that generate fluorescent products upon oxidation. This heterogeneous group of compounds includes lipophilic cations that localize preferentially to energized mitochondria. The degree of specificity and sensitivity of small molecule based fluorescent probes is significantly lower than that displayed by genetically encoded fluorescent proteins. In addition, these proteins can be targeted to specific cellular sites providing nonambiguous evidence of variations in ROS formation in the various cellular compartments [6]. The obvious disadvantage with fluorescent proteins is the procedure necessary for inducing their cellular expression. Indeed, transfection procedures can hardly be applied to primary cells, such as freshly isolated cardiac myocytes .
Advantages and limitations of the various compounds available for monitoring ROS formation should be carefully considered in relation to the experimental protocol. For instance, as detailed in the following sections, Amplex Red is quite useful in studies involving cell-free extracts, while it cannot be used in intact cells. On the other hand, the limited sensitivity and specificity of small molecule fluorescent probes is frequently tolerated in studies employing primary cells where the use of more efficacious genetically encoded proteins is hardly feasible.
This review is aimed at detailing three different approaches for assessing mitochondrial ROS formation in isolated mitochondria (exemplifying cell-free extracts) and isolated neonatal rat ventricular myocytes (NRVMs) in culture, respectively.
2 Methods
2.1 Measurement of ROS in Isolated Mitochondria
The Amplex Red assay is a widely used procedure for assessing ROS formation in cell-free extracts, including mitochondria [6,7,8]. This technique is devoid of limitations affecting other assays that are frequently used. Among these the fluorescence of 2′,7′-dichlorofluorescein (DCFH) is hampered by low specificity for H2O2 [6, 7]. Amplex Red is a substrate of horseradish peroxidase (HRP) , which in presence of H2O2 oxidizes Amplex Red resulting in the production of a red fluorescent compound resorufin (excitation/emission: 571/585 nm) [9]. Amplex Red reacts with H2O2 in a 1:1 stoichiometry to produce resorufin. The major shortcoming is the significant light sensitivity of Amplex Red that can lead to the formation of resorufin even in the absence of HRP and H2O2 [10]. Thus, necessary precautions should be taken to prevent photooxidation of this probe. Moreover, the fact that Amplex Red is cell impermeable limits its use to the permeabilized cells [9].
Amplex Red assay is commonly used to measure ROS produced by the mitochondrial respiratory chain in the presence of substrates, such as succinate or glutamate /malate [9]. Moreover, it is also possible to measure the activity of several enzymes that produce H2O2, including monoamine oxidases (MAO). These mitochondrial flavoenzymes catalyze the oxidative deamination of catecholamines and biogenic amines, resulting in the production of H2O2, aldehydes and ammonia [11,12,13].
A method for detection of MAO-generated H2O2 formation in isolated heart mitochondria by Amplex Red probe is described below.
2.1.1 Materials
-
1.
Isolated mitochondria: Heart mitochondria were isolated from C57BL/6 male as described in ref. 14.
-
2.
Probes: Amplex Red (ThermoFisher Scientific, A12222) and HRP (Sigma, P6782).
-
3.
Buffer: 137 mM KCl, 2 mM KH2PO4, 20 mM Hepes, and 20 μM EGTA.
-
4.
H2O2.
-
5.
Fluorimeter: Fluorimeter equipped with proper excitation/emission filters at 571 and 585 nm, respectively.
-
6.
Black 96-well plate.
2.1.2 Methods
-
(a)
Generation of hydrogen peroxide calibration curve.
-
1.
Set the fluorimeter at 571 nm excitation and 585 nm emission wavelengths. Set the temperature at 37°C.
-
2.
Prepare a buffer aliquot containing 5 μM Amplex Red and 4 μg/mL HRP. Pipette 200 μL of this master mix in each well and put the plate in the fluorimeter.
-
3.
Record the fluorescence changes at baseline.
-
4.
Add increasing concentrations of H2O2 starting from 0 to 1000 pmol, mix and record the fluorescence intensity until a flat line is observed as shown in Fig. 1a.
-
5.
Calculate the change in fluorescence intensity by subtracting the basal fluorescence level (measured at step 3) from fluorescence intensity recorded after each addition of H2O2 (as marked by X in Fig. 1a).
-
6.
Plot the graph with Δ fluorescence intensity on y-axis vs the amount of H2O2 added on x-axis as shown in Fig. 1b and calculate the slope of the line.
Note: The coefficient of multiple determination for multiple regression (R2) should always be higher than 0.95.
Fig. 1 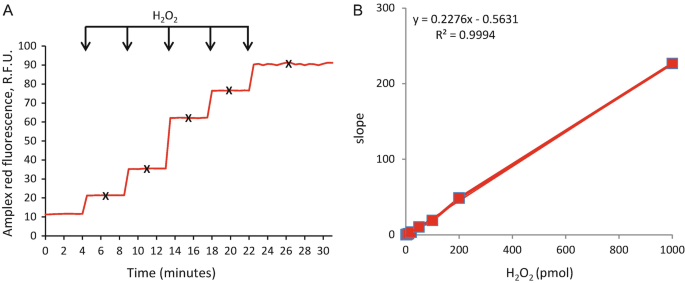
H2O2 calibration curve using Amplex Red . (a) Increasing H2O2 concentrations, from 0 to 1000 pmol, were added to each well containing the Amplex Red and HRP master-mix and fluorescence intensity was recorded. (b) Final fluorescence intensities (fluorescence intensity after addition of H2O2—basal fluorescence intensity) were calculated for each point and plotted against the amount of H2O2 added. The slope and coefficient of determination (R2) were calculated
-
1.
-
(b)
Measurement of MAO-dependent H2O2 formation in isolated mitochondria
-
1.
Set the fluorimeter as described in step 1. Add 5 μM Amplex Red , 4 μg/mL HRP , and 0.1 μg/μL mitochondria in the buffer. Pipette 200 μL of this master-mix in each well, and put the plate in the fluorimeter.
-
2.
Record the fluorescence changes at basal level for ~5 min.
-
3.
Add MAO substrate tyramine in each well and read the fluorescence up to 30 min. As shown in Fig. 2a, addition of tyramine results in an increase in H2O2 production as reflected by an increase in fluorescence intensity.
Note: MAO catabolizes tyramine and leads to the production of H2O2, aldehydes, and ammonia [11] (Fig. 2c). Thus, increasing tyramine concentration results in an increase in H2O2 production.
-
4.
To confirm that this increase in H2O2 production is indeed due to MAO activity, preincubate mitochondria with 1 μM pargyline, an irreversible inhibitor of these flavoenzymes, and repeat steps 1–3 (Fig. 2a).
-
5.
To quantify mitochondrial H2O2 formation, calculate the slope of the fluorescence traces obtained in each condition and extrapolate the amount of H2O2 generated using the slope and intercept values obtained in A. This value is then normalized to the amount of mitochondrial protein used in the assay and expressed as the rate of H2O2 emission in pmol/min/mg of mitochondrial proteins (Fig. 2b).
-
1.


MAO-generated H2O2 measurement in isolated heart mitochondria with Amplex Red . (a) Heart mitochondria were added to the mixture of Amplex Red and HRP , and basal H2O2 formation was measured for 5 min. To assess MAO-dependent mitochondrial ROS formation, tyramine, a MAO substrate, was added to each well at different concentrations in the presence or absence of the MAO inhibitor pargyline (1 μM). The fluorescence intensity was measured at excitation 571 and emission 585 nm. (b) Rate of H2O2 formation expressed as pmol/min/0.2 mg of mitochondrial proteins was calculated and plotted vs the concentration of tyramine. (c) Scheme showing MAO as an outer mitochondrial flavoenzyme that catabolizes the oxidative deamination of catecholamines and biogenic amines, such as serotonin, tyramine, and dopamine, and leads to the production of H2O2, ammonia, and aldehydes. Pargyline is an inhibitor of MAO that irreversibly blocks the activity of these flavoenzymes. In the presence of H2O2, HRP oxidizes Amplex Red and results in the production of a red fluorescent compound resorufin, which is excited and emits at 571 and 585 nm, respectively
2.2 Measurement of ROS in Isolated Cardiomyocytes
2.2.1 Fluorescent Redox-Sensitive Probes
In the past decade, several probes have been developed to measure intracellular and compartmentalized ROS formation inside the cell [6, 7, 15]. Small molecule fluorescent dyes, such as MitoSOX and reduced MitoTracker dyes, are commonly used for detection of mitochondrial ROS formation in intact cells.
MitoSOX Red is a derivative of hydroethidine and is widely used for the measurement of O2− formation in the active mitochondria. This dye is specifically targeted to mitochondria because it contains the lipophilic cation triphenyl phosphonium substituent [6, 16]. MitoSOX Red is oxidized by O2− to form a red fluorescent product 2-hydroxyethidium, which is excited at 510 nm and emits at 580 nm [16]. Even though MitoSOX is used to specifically detect O2− formation, it has been reported that this probe can also be oxidized by other oxidants to form ethidium, which overlaps with the fluorescence peak of 2-hydroxyethidium [17, 18]. Moreover, at high concentrations, MitoSOX displays some non-mitochondrial staining, for instance, in the nucleus [19].
MitoTracker Orange CM-H2TMRos and MitoTracker Red CM-H2XRos are derivatives of dihydrotetramethyl rosamine and dihydro-X-rosamine, respectively [6]. Reduced MitoTracker dyes do not fluoresce until entering viable cells, where they get oxidized and become positively charged. The cationic fluorescent compound then accumulates in the mitochondria depending on ROS levels and mitochondrial membrane potential and forms fluorescent conjugate with thiol groups [20]. The excitation/emission wavelenghts for MitoTracker Orange CM-H2TMRos and MitoTracker Red CM-H2XRos are 554/576 and 579/599 nm, respectively [6]. Unlike MitoSOX, these reduced MitoTracker dyes are not specific for single oxidant species, and thus detect general mitochondrial ROS [6]. Moreover, the fact that their mitochondrial localization and accumulation depend on the mitochondrial membrane potential is a crucial aspect to bear in mind for the correct interpretation of the fluorescence intensity levels [17, 19]. Indeed, it is necessary to measure mitochondrial membrane potential in order to avoid erroneous interpretations.
A method to detect mitochondrial ROS formation in NRVMs using reduced MitoTracker Red CMH2XRos dye is described below.
-
1.
Materials
-
(a)
Cells: NRVMs were isolated from 0–3-day-old Wistar rats as described in [12].
-
(b)
Fluorescent probes: MitoTracker™ Red CM-H2XRos (ThermoFisher Scientific, M7153).
-
(c)
Culture medium:
Medium A: Minimum essential medium (MEM, ThermoFisher Scientific, 2175022) supplemented with 1% nonessential amino acids , 1% penicillin/streptomycin, 10% fetal bovine serum (FBS), and BrdU (0.1 mM).
Medium B: MEM supplemented with 1% nonessential amino acids, 1% penicillin/streptomycin, and 1% FBS/insulin-transferrin-selenium (ITS).
-
(d)
Buffer: Hanks’ balanced salt solution (HBSS, 136.9 mM NaCl, 5.36 mM KCl, 0.4 mM MgSO4, 0.5 mM MgCl2, 0.4 mM KH2PO4, 0.4 mM Na2HPO4, 4 mM NaHCO3, 5 mM glucose, and 2 mM CaCl2).
-
(e)
Microscope: Fluorescence microscope equipped with appropriate filters to detect the fluorescence at 579/599 nm. We use an inverted Leica DMI6000 B fluorescence microscope equipped with DFC365FX camera.
-
(f)
Incubator: To culture cells use a CO2 incubator set at 37°C with 5% CO2 and 96% relative humidity.
-
(a)
-
2.
Methods
-
(a)
After isolation of NRVMs, plate cells in MEM medium A in a 6-well plate containing gelatin-coated glass slides. Place NRVMs in the incubator for 24 h.
Note: It is always suggested to pre-warm the medium at 37°C prior to use for cell culture. To coat the plastic plates with gelatin , dissolve 0.1% gelatin in H2O and autoclave. Place sterile glass slides into each well and add 2 mL gelatin solution. Incubate the plates at 37°C for 30 min to create a layer of gelatin over the glass slides. After incubation, wash plates with PBS to remove excess gelatin. Plates are then ready to use.
-
(b)
After 24 h of culture, aspirate the medium and wash cells with HBSS to remove any dead cells. Replace the medium with MEM medium B and place the cells in the incubator.
-
(c)
Treat NRVMs in different conditions as required. In Fig. 3, NRVMs are treated either with vehicle or 5 μM doxorubicin for 1 h.
Note: Doxorubicin, a well-known anticancer drug, is a redox cycler that localizes to mitochondria [21]. Doxorubicin-induced ROS production is known to trigger cardiac dilation, contractile dysfunction, and ultimately heart failure [22,23,24,25]. Here, we used doxorubicin as a ROS-inducing agent.
-
(d)
While the cells are in treatment , dissolve one vial of MitoTracker Red CMH2XRos in DMSO to make a 100 μM stock solution. Further dilute MitoTracker Red to 25 nM in HBSS and cover it with aluminum foil to protect it from the light.
Note: Always prepare fresh mixture of MitoTracker Red and HBSS. The optimal MitoTracker Red concentration for different cell types should be determined empirically. Using too high concentration of the dye can lead to non-specific staining and higher fluorescence background.
-
(e)
After the treatment, aspirate the medium and incubate cells with 2 mL of HBSS + MitoTracker Red solution at 37°C for 30 min. MitoTracker Red will enter in the living cells and accumulate inside the respiring mitochondria.
-
(f)
Aspirate the medium after 30 min and wash three to four times with HBSS to remove any excess dye . Leave the cells in HBSS medium for the rest of the experiment.
-
(g)
Pick the glass slide with forceps and place it carefully in the holder (cells should be on the side facing up). Tighten the holder and add 1 mL HBSS on the top of the cells.
Note: Tightening the holder is a sensitive step, since tightening too much can break the glass slide, while leaving it loose can result in leaking of the medium.
-
(h)
Fix the holder containing cells on the microscope stage, and set the temperature at 37 °C. Focus the cells and start capturing images of the different field of views (~15 fields per slide). Remember to use appropriate filters (excitation at 579 nm and emission at 599 nm). Cells loaded with MitoTracker Red will show mitochondria network in red color (Fig. 3a). Increase in ROS production will lead to an increase in fluorescence intensity, since the probe will be oxidized more, as shown in doxorubicin-treated cardiomyocytes compared to control cells (Fig. 3).
Note: It is crucial to keep the exposure time, gain, lamp intensity, and all other settings the same for all the slides to be able to make the comparisons between the groups.
-
(i)
To quantify the fluorescence intensity, Java-based image processing program ImageJ (NIH) can be used.
Fluorescence intensity analysis using ImageJ:
-
Open the images in ImageJ.
-
Click on the freehand selection tool, and select the area within the cell where fluorescence intensity is to be measured.
-
Open ROI manager (Analyze>Tools>ROI manager), and click on “Add” to add the area in the list. Select several regions of interest in the image, and add all the areas in the list.
Note: In each image, remember to select a background region where there are no cells.
-
Press “measure”, ROI manager will calculate the fluorescence intensity for all the selected regions. Remember to subtract the background fluorescence from each region of interest.
Note: In ImageJ several parameters can be measured, for instance area, centroid, skewness, and many more. To quantify the fluorescence intensity, “mean gray value” should be measured. To set this parameter, click analyze>set measurements>check mean gray value box and press ok.
-
Repeat the same steps for all the acquired images, and calculate the mean and standard deviation.
Note: Doxorubicin has an intrinsic fluorescence . Therefore, to correctly interpret the data, doxorubicin auto-fluorescence intensity was subtracted from the MitoTracker Red fluorescence levels in doxorubicin-treated cells.
-
-
(a)

Mitochondrial ROS measurement in neonatal cardiomyocytes. (a) NRVMs were treated either with vehicle or 5 μM doxorubicin for 1 h, and cells were loaded with fluorescent probe MitoTracker Red CM-H2XRos for 30 min. Images were captured with inverted fluorescence microscope using 579 nm excitation and 599 nm emission, wavelengths. (b) Quantification of ROS levels in cardiomyocytes following doxorubicin treatment
2.2.2 Genetically Encoded Fluorescent Probe-HyPer
As described above, fluorescent redox probes such as MitoSOX and MitoTracker dyes present limitations in terms of selectivity, sensitivity, and also localization. Therefore, genetically encoded biosensors have been developed to measure H2O2 or other species fluctuations in different compartments of living cells, such as roGFP [26], Orp1-roGFP2 [27], and HyPer ([26], Fig. 4a) .

pHyPer-dMito: structure and main properties. (a) Mammalian expression vector encoding mitochondria-targeted HyPer. Duplicated mitochondria targeting sequence (MTS) derived from the subunit VIII of human cytochrome C oxidase is fused with HyPer N-terminus. The vector backbone contains immediate early cytomegalovirus promoter (PCMV IE) for protein expression. The vector has a neomycin resistance gene (Neor), to select stably transfected eukaryotic cells using G418 and kanamycin resistance gene expression (Kanr) to select in E. coli. (b) Scheme of HyPer oxidation and reduction reactions. In presence of H2O2, the two cysteines are oxidized, inducing an increase in the cpYFP fluorescence. Glutaredoxin (GRX) activity reverses the process. (c) HyPer excitation (blue line) and emission (green line) spectra. In the absence of H2O2, HyPer has two excitation peaks with maxima at 420 nm and 500 nm and one emission peak with maximum at 516 nm. Upon exposure to H2O2, the excitation peak at 420 nm decreases proportionally to the increase in the peak at 500 nm, allowing ratiometric measurement of H2O2
HyPer contains an H2O2-sensitive regulatory domain of E. coli transcription factor OxyR [28, 29], bound to a yellow fluorescent protein (cpYFP). OxyR can be oxidized by H2O2, leading to the formation of a disulfide bond between Cys-199 and Cys-208; this oxidative modification can be reversed by the activity of endogenous glutaredoxins. The conformational change induced by the oxidation is transmitted to the cpYFP located between amino acids 205 and 206 [29] (Fig. 4b).
The major advantages of this genetically encoded redox sensor are that it’s ratiometric and reversible and can be targeted to specific compartments of the cell. Several variants of HyPer are commercially available, such as cytosolic (pHyPer-cyto), mitochondrial (pHyPer-dMito), and nuclear (pHyPer-nuc) constructs. In addition, other versions of the plasmid targeted to endoplasmic reticulum , lysosomes, and different compartments within the mitochondria have been reported in the literature. Thus, HyPer is a useful tool to measure compartmentalized H2O2 formation [30].
HyPer has two excitation maxima (420/500 nm) and a single emission peak maximum (516 nm). Upon oxidation, the intensity of the 420 nm peak decreases proportionally to the increase of the intensity of the 500 nm peak, thus making HyPer a ratiometric sensor. An increase in H2O2 levels is directly proportional to the increase in fluorescence ratio F500/F420 [31] (Figs. 4c and 5b).

Measurement of mitochondrial H2O2 in neonatal cardiomyocytes. NRVMs transfected with mitochondria-targeted HyPer were placed under a microscope, and images were captured using an external filter wheel composed by excitation filters CFPex (BP427/10) and YFPex (BP504/12) and a 535/30m T515lp emission filter. Baseline kinetics was followed for 60 s, and then 100 μM H2O2 was added to the cells. (a) The fluorescence in response to 420 nm excitation decreases, while the fluorescence in response to 500 nm excitation increases. (b) The ratio of the emission of the two wavelengths (F500/F420) is shown
Although HyPer is widely used to detect H2O2, its fluorescence levels can be influenced by pH , potentially leading to erroneous result interpretation. Hence, it is important to monitor pH in the same compartment and experimental conditions in which HyPer is being used. This can be accomplished using SypHer, a form of HyPer bearing a mutation in one of the two H2O2-sensing cysteines of the OxyR domain, making it H2O2 insensitive but pH sensitive sensor [6].
-
1.
Materials
-
(a)
Cells: NRVMs were isolated as described in Subheading 2.2.1, step 1. Coat plates as described in Subheading 2.2.1, step 2.
-
(b)
Plasmid: pHyPer-dMito (Evrogen, FP942).
-
(c)
Medium: Use the same media described in Subheading 2.2.1, step 1.
-
(d)
Buffers:
-
1× Hanks’ balanced salt solution (HBSS, 136.9 mM NaCl, 5.36 mM KCl, 0.4 mM MgSO4, 0.5 mM MgCl2, 0.4 mM KH2PO4, 0.4 mM Na2HPO4, 4 mM NaHCO3, 5 mM glucose, and 2 mM CaCl2, pH 7.4).
-
2× HBS (274 mM NaCl, 10 mM KCl, 1.4 mM Na2HPO4, and 42 mM HEPES, pH 7.1).
-
1× PBS (134 mM NaCl, 2.7 mM KCl, 10 mM Na2HPO4, 1.8 mM KH2PO4, pH 7.4).
pH of all buffers is adjusted with NaOH.
-
-
(e)
Microscope: We use an inverted fluorescence microscope with the same features described in Subheading 2.2.1, step 1. We use an external filter wheel containing excitation filters for CFPex (BP427/10) and YFPex (BP504/12), and a 535/30m T515lp emission filter to detect the emission fluorescence.
-
(f)
Incubator: As described in Subheading 2.2.1, step 1.
-
(a)
-
2.
Methods
-
(a)
Plate NRVMs at a density of 3×10⁵ cells/well in MEM medium A in a 6-well plate containing gelatin-coated glass slides. Place NRVMs in the incubator for 24 h.
-
(b)
After 24 h of culture, aspirate the medium from the cells and wash them with HBSS to remove any dead cells. Replace the medium with MEM medium B, place the cells in the incubator , and start preparing for the HyPer transfection.
-
(c)
NRVMs are transfected using the calcium phosphate method. For each transfection, dilute pHyPer-dmito to 2 μg with sterile water, mix with ice-cold 0.25 M CaCl2, add drop by drop to the 2× HBS buffer, and leave for 4 min to precipitate. Add this mixture to cells and incubate for 4 h. Rinse cells with PBS and add fresh MEM medium B.
Note: In order to obtain a good transfection, 2.5 M CaCl2 must be stored at −20 °C, and the ratio between CaCl2/DNA/HBS must be 0.1:0.9:1 (i.e., 10 μL CaCl2:90 μL Water/DNA:100 μL HBS). The mixture CaCl2/DNA must be added to HBS drop by drop while vortexing HBS. An important point is to wash the cells with PBS for 6–10 times in order to remove all the deposits of calcium that would otherwise be toxic for the cells.
-
(d)
After 48 h from transfection, wash three to four times with HBSS to remove any dead cells. Pick the glass slide with forceps and place it in the holder carefully. Tighten the holder and add 1 mL HBSS on the top of cells.
-
(e)
Treatment:
-
End Point Experiment: Pretreat the cells in the conditions you would like to investigate. Place the slide under the microscope and set the temperature at 37°C. Focus the cells and capture images of the different fields of view. In order to obtain consistent data, capture at least five fields of view per slide.
-
Kinetics Experiment: Place the slide under the microscope, set the temperature at 37°C, and focus the cells in the field of view of interest. Record continuously for at least 30 frames to obtain a baseline (i.e., 1 frame/1 s as shown in Fig. 5), and then add the acute treatment.
Remember to use the correct filters based on the HyPer excitation/emission spectrum . Transfected cells will show mitochondria network in green color (Fig. 5a). In conditions in which H2O2 levels will increase, the fluorescence at 420 nm will decrease, while 500 nm will increase, as shown in Fig. 5a. In this experiment addition of 100 μM H2O2 led to an increase the ratio of F500/F420 (Fig. 5b).
Note: The expression efficiency of HyPer may vary in different cells due to different expression levels of the sensor. This difference or other artifacts (i.e., mitochondrial movements or cell contractions) will not influence the result since HyPer is a ratiometric sensor.
-
-
(f)
To quantify the fluorescence intensity, Java-based image processing program ImageJ (NIH) can be used.
Analysis using ImageJ program:
-
Open the images in ImageJ.
-
Click on the freehand selection tool and select the area within the cell where fluorescence intensity is to be measured.
-
Open ROI manager (Analyze>Tools>ROI manager) and click on “Add” to add the area in the list (ROI, Region of Interest). Select several regions of interest in the image and add all the areas in the list.
Note: In each image, remember to select a background region where there are no cells. You will have two sets of images, one deriving from the excitation at 420 nm and the other one deriving from the excitation at 500 nm. Do the same procedure for both sets and calculate the ratio. In order to select the same area, once the ROI list is done, click on ROI manager>More>Save to save the list. Open the second set of images and click on ROI manager>More>Open to load the list.
-
Press “measure”, ROI manager will calculate the fluorescence intensity for all the selected regions. Remember to subtract the background fluorescence from each region of interest.
Note: In ImageJ several parameters could be measured, for instance, area, centroid, skewness, and many more. To quantify the fluorescence intensity, “mean gray value” should be measured. To set this parameter, click analyze>set measurements>check mean gray value box and press ok.
-
Repeat the same steps for all the acquired images, and calculate the mean and standard deviation .
Note: In kinetics experiments, click File>Import>Image Sequence to open all the files. In ROI manager, click on more>Multi Measure to calculate the fluorescence intensity for all the selected regions in all the images.
-
-
(a)
References
Egea J, Fabregat I, Frapart YM, Ghezzi P, Gorlach A, Kietzmann T, Kubaichuk K, Knaus UG, Lopez MG et al (2017) European contribution to the study of ROS: a summary of the findings and prospects for the future from the COST action BM1203 (EU-ROS). Redox Biol 13:94–162. https://doi.org/10.1016/j.redox.2017.05.007
Casas AI, Dao VT, Daiber A, Maghzal GJ, Di Lisa F, Kaludercic N, Leach S, Cuadrado A, Jaquet V, Seredenina T, Krause KH, Lopez MG, Stocker R, Ghezzi P, Schmidt HH (2015) Reactive oxygen-related diseases: therapeutic targets and emerging clinical indications. Antioxid Redox Signal 23(14):1171–1185. https://doi.org/10.1089/ars.2015.6433
Murphy E, Ardehali H, Balaban RS, DiLisa F, Dorn GW 2nd, Kitsis RN, Otsu K, Ping P, Rizzuto R, Sack MN, Wallace D, Youle RJ (2016) Mitochondrial function, biology, and role in disease: a scientific statement from the American Heart Association. Circ Res 118(12):1960–1991. https://doi.org/10.1161/RES.0000000000000104
Lukyanov KA, Belousov VV (2014) Genetically encoded fluorescent redox sensors. Biochim Biophys Acta 1840(2):745–756. https://doi.org/10.1016/j.bbagen.2013.05.030
Winterbourn CC (2014) The challenges of using fluorescent probes to detect and quantify specific reactive oxygen species in living cells. Biochim Biophys Acta 1840(2):730–738. https://doi.org/10.1016/j.bbagen.2013.05.004
Kaludercic N, Deshwal S, Di Lisa F (2014) Reactive oxygen species and redox compartmentalization. Front Physiol 5:285. https://doi.org/10.3389/fphys.2014.00285
Dikalov SI, Harrison DG (2014) Methods for detection of mitochondrial and cellular reactive oxygen species. Antioxid Redox Signal 20(2):372–382. https://doi.org/10.1089/ars.2012.4886
Mailloux RJ (2015) Teaching the fundamentals of electron transfer reactions in mitochondria and the production and detection of reactive oxygen species. Redox Biol 4:381–398. https://doi.org/10.1016/j.redox.2015.02.001
Starkov AA (2010) Measurement of mitochondrial ROS production. Methods Mol Biol 648:245–255. https://doi.org/10.1007/978-1-60761-756-3_16
Zhao B, Summers FA, Mason RP (2012) Photooxidation of Amplex Red to resorufin: implications of exposing the Amplex Red assay to light. Free Radic Biol Med 53(5):1080–1087. https://doi.org/10.1016/j.freeradbiomed.2012.06.034
Deshwal S, Di Sante M, Di Lisa F, Kaludercic N (2017) Emerging role of monoamine oxidase as a therapeutic target for cardiovascular disease. Curr Opin Pharmacol 33:64–69. https://doi.org/10.1016/j.coph.2017.04.003
Kaludercic N, Takimoto E, Nagayama T, Feng N, Lai EW, Bedja D, Chen K, Gabrielson KL, Blakely RD, Shih JC, Pacak K, Kass DA, Di Lisa F, Paolocci N (2010) Monoamine oxidase A-mediated enhanced catabolism of norepinephrine contributes to adverse remodeling and pump failure in hearts with pressure overload. Circ Res 106(1):193–202. https://doi.org/10.1161/CIRCRESAHA.109.198366
Kaludercic N, Carpi A, Nagayama T, Sivakumaran V, Zhu G, Lai EW, Bedja D, De Mario A, Chen K, Gabrielson KL, Lindsey ML, Pacak K, Takimoto E, Shih JC, Kass DA, Di Lisa F, Paolocci N (2014) Monoamine oxidase B prompts mitochondrial and cardiac dysfunction in pressure overloaded hearts. Antioxid Redox Signal 20(2):267–280. https://doi.org/10.1089/ars.2012.4616
Di Lisa F, Menabo R, Canton M, Barile M, Bernardi P (2001) Opening of the mitochondrial permeability transition pore causes depletion of mitochondrial and cytosolic NAD+ and is a causative event in the death of myocytes in postischemic reperfusion of the heart. J Biol Chem 276(4):2571–2575. https://doi.org/10.1074/jbc.M006825200
Zhang H, Goodman HM, Jansson S (1997) Antisense inhibition of the photosystem I antenna protein Lhca4 in Arabidopsis thaliana. Plant Physiol 115(4):1525–1531
Cottet-Rousselle C, Ronot X, Leverve X, Mayol JF (2011) Cytometric assessment of mitochondria using fluorescent probes. Cytometry A 79(6):405–425. https://doi.org/10.1002/cyto.a.21061
Zielonka J, Kalyanaraman B (2010) Hydroethidine- and MitoSOX-derived red fluorescence is not a reliable indicator of intracellular superoxide formation: another inconvenient truth. Free Radic Biol Med 48(8):983–1001. https://doi.org/10.1016/j.freeradbiomed.2010.01.028
Kalyanaraman B, Darley-Usmar V, Davies KJ, Dennery PA, Forman HJ, Grisham MB, Mann GE, Moore K, Roberts LJ 2nd, Ischiropoulos H (2012) Measuring reactive oxygen and nitrogen species with fluorescent probes: challenges and limitations. Free Radic Biol Med 52(1):1–6. https://doi.org/10.1016/j.freeradbiomed.2011.09.030
Robinson KM, Janes MS, Pehar M, Monette JS, Ross MF, Hagen TM, Murphy MP, Beckman JS (2006) Selective fluorescent imaging of superoxide in vivo using ethidium-based probes. Proc Natl Acad Sci U S A 103(41):15038–15043. https://doi.org/10.1073/pnas.0601945103
Hsieh CW, Chu CH, Lee HM, Yuan Yang W (2015) Triggering mitophagy with far-red fluorescent photosensitizers. Sci Rep 5:10376. https://doi.org/10.1038/srep10376
Kuznetsov AV, Margreiter R, Amberger A, Saks V, Grimm M (2011) Changes in mitochondrial redox state, membrane potential and calcium precede mitochondrial dysfunction in doxorubicin-induced cell death. Biochim Biophys Acta 1813(6):1144–1152. https://doi.org/10.1016/j.bbamcr.2011.03.002
Tocchetti CG, Ragone G, Coppola C, Rea D, Piscopo G, Scala S, De Lorenzo C, Iaffaioli RV, Arra C, Maurea N (2012) Detection, monitoring, and management of trastuzumab-induced left ventricular dysfunction: an actual challenge. Eur J Heart Fail 14(2):130–137. https://doi.org/10.1093/eurjhf/hfr165
Tocchetti CG, Carpi A, Coppola C, Quintavalle C, Rea D, Campesan M, Arcari A, Piscopo G, Cipresso C, Monti MG, De Lorenzo C, Arra C, Condorelli G, Di Lisa F, Maurea N (2014) Ranolazine protects from doxorubicin-induced oxidative stress and cardiac dysfunction. Eur J Heart Fail 16(4):358–366. https://doi.org/10.1002/ejhf.50
Kim SY, Kim SJ, Kim BJ, Rah SY, Chung SM, Im MJ, Kim UH (2006) Doxorubicin-induced reactive oxygen species generation and intracellular Ca2+ increase are reciprocally modulated in rat cardiomyocytes. Exp Mol Med 38(5):535–545. https://doi.org/10.1038/emm.2006.63
Khouri MG, Douglas PS, Mackey JR, Martin M, Scott JM, Scherrer-Crosbie M, Jones LW (2012) Cancer therapy-induced cardiac toxicity in early breast cancer: addressing the unresolved issues. Circulation 126(23):2749–2763. https://doi.org/10.1161/CIRCULATIONAHA.112.100560
Dooley CT, Dore TM, Hanson GT, Jackson WC, Remington SJ, Tsien RY (2004) Imaging dynamic redox changes in mammalian cells with green fluorescent protein indicators. J Biol Chem 279(21):22284–22293. https://doi.org/10.1074/jbc.M312847200
Albrecht SC, Barata AG, Grosshans J, Teleman AA, Dick TP (2011) In vivo mapping of hydrogen peroxide and oxidized glutathione reveals chemical and regional specificity of redox homeostasis. Cell Metab 14(6):819–829. https://doi.org/10.1016/j.cmet.2011.10.010
Belousov VV, Fradkov AF, Lukyanov KA, Staroverov DB, Shakhbazov KS, Terskikh AV, Lukyanov S (2006) Genetically encoded fluorescent indicator for intracellular hydrogen peroxide. Nat Methods 3(4):281–286. https://doi.org/10.1038/nmeth866
Choi H, Kim S, Mukhopadhyay P, Cho S, Woo J, Storz G, Ryu SE (2001) Structural basis of the redox switch in the OxyR transcription factor. Cell 105(1):103–113
Malinouski M, Zhou Y, Belousov VV, Hatfield DL, Gladyshev VN (2011) Hydrogen peroxide probes directed to different cellular compartments. PLoS One 6(1):e14564. https://doi.org/10.1371/journal.pone.0014564
Bilan DS, Belousov VV (2016) HyPer family probes: state of the art. Antioxid Redox Signal 24(13):731–751. https://doi.org/10.1089/ars.2015.6586
Author information
Authors and Affiliations
Corresponding author
Editor information
Editors and Affiliations
Rights and permissions
Copyright information
© 2018 Springer Science+Business Media, LLC, part of Springer Nature
About this protocol

Cite this protocol
Deshwal, S., Antonucci, S., Kaludercic, N., Di Lisa, F. (2018). Measurement of Mitochondrial ROS Formation. In: Palmeira, C., Moreno, A. (eds) Mitochondrial Bioenergetics. Methods in Molecular Biology, vol 1782. Humana Press, New York, NY. https://doi.org/10.1007/978-1-4939-7831-1_24
Download citation
DOI: https://doi.org/10.1007/978-1-4939-7831-1_24
Published:
Publisher Name: Humana Press, New York, NY
Print ISBN: 978-1-4939-7830-4
Online ISBN: 978-1-4939-7831-1
eBook Packages: Springer Protocols