
Abstract
The liver is a vital organ in the body. It has various essential functions, including detoxification, protein synthesis, and control of infection. Because of its medical importance, liver diseases such as hepatitis and cirrhosis can be crucial for an individual. Exploring dynamics of living cells in the liver would provide the clues for understanding the pathology. However, due to its technical difficulty, few studies have used intravital liver imaging. To resolve this, we have established a novel imaging system for visualizing liver cell dynamics in living animals.
Herein we describe the methodology for visualizing the in vivo behavior of liver cells using intravital multiphoton microscopy. This approach will be useful for understanding the pathogenesis of liver disorders, as well as liver biology, in vivo.
We’re sorry, something doesn't seem to be working properly.
Please try refreshing the page. If that doesn't work, please contact support so we can address the problem.
Key words
1 Introduction
The liver is the largest organ in the abdominal cavity and perfused by a great volume of blood [1]. Various types of cells exist around a network of capillaries called sinusoids: abundant hepatocytes, and specialized cells, such as liver sinusoidal endothelial cells (LSECs), Kupffer cells, and lymphocytes. This unique structure and cellular population allow the liver to serve many vital functions, including detoxification, protein synthesis, bile production, glucose metabolism, and control of infection.
Because it is difficult to visualize the inner liver tissue in living animals, only a few in vivo studies have described the mechanisms of liver diseases. Although the cell population, morphology, and structure in liver tissues can be analyzed by conventional methods such as histological analysis and flow cytometry, these methods only allow for the evaluation of cell shape and molecular expression, but cannot observe the movement and interaction of different cell types with respect to blood flow circulation.
We recently established an advanced imaging system to visualize dynamic cell behavior in intravital liver tissues with multiphoton microscopy and quantitatively analyzed their mobility and interactions. Using this system, we assessed the behavior of myeloid cells in the liver of obese mice [2]. We found that the number of rolling and adherent myeloid cells increased significantly, and cell-tracking velocity was decreased in obese mice. We also demonstrated that the blockade of very late antigen-4 (VLA-4), an adhesion molecule, inhibited the transition of myeloid cells from the rolling state to the adhesion state and increased their mean velocity in obese mice. These results suggest that LSECs play an important role in hepatic myeloid cell accumulation via VLA-4-dependent cell-cell adhesion in the fatty liver, resulting in hepatic inflammation and glucose intolerance [2].
In this chapter, we propose the working doses of fluorescent antibodies to stain multiple liver cells in vivo and describe the methodology of intravital multiphoton imaging for visualizing the in vivo behavior of liver cells, as well as their morphology and function in physiological or pathological conditions in the living liver.
2 Materials
2.1 Multiphoton Microscopy
-
1.
Inverted multiphoton microscope (A1R-MP; Nikon).
-
2.
Water-immersion objective, 20× (Plan Fluor: numerical aperture [NA], 0.75; working distance [WD], 0.35 mm; Nikon).
-
3.
Femtosecond-pulsed infrared laser (Chameleon Vision II Ti: sapphire laser; Coherent).
-
4.
External non-descanned detector (NDD) with four channels (Nikon).
-
5.
Dichroic and filter set: three dichroic mirrors (495, 560, and 593 nm) and four band-pass filters (492 nm for the second harmonic generation signal, and Hoechst 33342, 525/50 nm for enhanced green fluorescent protein [EGFP], and fluorescein isothiocyanate [FITC], 575/25 nm for Texas-Red, and 660/52 nm for Qtracker 655; Nikon).
-
6.
NIS Elements integrated software (Nikon).
2.2 Mice and Anesthesia
-
1.
Lysozyme M-EGFP (LysM-EGFP) [3] and wild-type (WT) mice.
-
2.
Isoflurane (Escain).
-
3.
Vaporizer (inhalation device).
-
4.
O2 bomb.
-
5.
Anesthesia box and mask.
2.3 Intravital Imaging
-
1.
Custom-made stereotactic stage (Fig. 1) (see Note 1 ).
Fig. 1 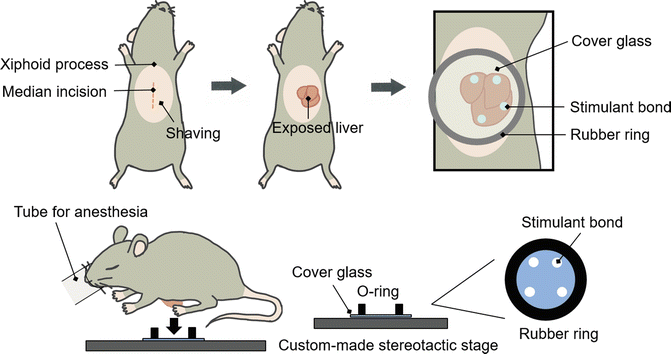
Schematic illustration of liver imaging. The mouse is anesthetized with isoflurane, the left lobe of the liver is surgically exposed, and the liver is immobilized using the custom-made stereotactic stage
-
2.
Shaver and hair removal lotion.
-
3.
Iris scissors and tweezers for mouse surgery.
-
4.
N-Butyl cyanoacrylate glue.
-
5.
Infusion line.
-
6.
Infusion syringe pump.
-
7.
Phosphate-buffered saline (PBS), pH 7.4.
-
8.
Electrocardiogram monitoring device.
-
9.
Environmental dark box in which an anesthetized mouse is warmed to 37 °C by an air heater.

2.4 Staining of Blood Vessels, Nuclei, and Cells
-
1.
Angiographic agents: Hoechst 33342, Texas-Red conjugated dextran, Qtracker 655, anti-F4/80-FITC antibody, and anti-CD31-FITC antibody.
-
2.
One 29-gauge insulin syringe for intravenous injection.
2.5 Image Processing and Analysis
-
1.
Image processing and analysis software: Imaris (Bitplane), or NIS Elements (Nikon).
-
2.
After Effects software (Adobe).
3 Methods
3.1 Administration of Fluorescent Dyes
3.1.1 Administration of Fluorescent Antibodies
-
1.
Dissolve anti-F4/80-FITC or anti-CD31-FITC antibody in PBS (see Note 2 ).
-
2.
All procedures in mice are performed under anesthesia .
-
3.
Inject anti-F4/80-FITC or anti-CD31-FITC antibody intravenously into mice 2 h before imaging.
-
4.
Perform intravital liver imaging experiments (see Subheading 3.2).
3.1.2 Administration of Qtracker 655 and Hoechst 33342
-
1.
Dissolve Qtracker 655 and Hoechst 33342 in PBS (see Note 3 ).
-
2.
Inject Qtracker 655 and Hoechst 33342 intravenously into mice immediately before imaging.
3.2 Intravital Multiphoton Imaging of the Liver
-
1.
Initiate the multiphoton microscope and turn on the heater in the environmental dark box.
-
2.
All surgical procedures are performed under isoflurane inhalation anesthesia .
-
3.
Shave the hair and apply hair removal lotion just under the xiphoid process of the mouse.
-
4.
Disinfect the skin of the abdomen using 70% ethanol.
-
5.
Cut the skin and peritoneum minimally using iris scissors and expose the left lobe of the liver (see Note 4 ).
-
6.
Insert a piece of folded gauze between the liver and body of the mouse (see Note 5 ).
-
7.
Apply n-butyl cyanoacrylate glue to four spots on the cover glass (see Note 6 ).
-
8.
Gently place the liver on the cover glass of the custom-made holder (Fig. 1) (see Note 7 ).
-
9.
Place the mouse in the environmental dark box.
-
10.
Focus on the liver at an appropriate depth and look through the ocular lenses using a mercury lamp as the light source.
-
11.
Change the light source from the mercury lamp to the Ti: sapphire laser.
-
12.
Set the excitation wavelength, zoom ratio, z-positions, interval time, and duration time using the microscope software (see Note 8 ).
-
13.
Observe the internal surface of the liver by multiphoton excitation microscopy (Figs. 2, 3, and 4).
Fig. 2 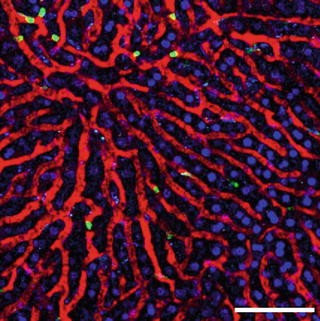
Visualization of cellular dynamics in the living liver using intravital multiphoton microscopy . Representative images of the liver of LysM-EGFP mice. Green, neutrophils expressing enhanced green fluorescent protein (EGFP); red, blood vessels; blue, nuclei. Scale bar, 100 μm
Fig. 3 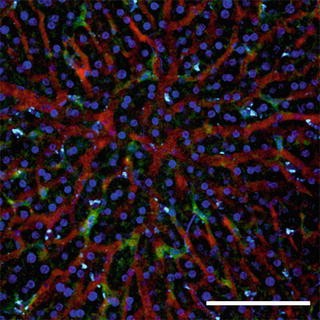
Visualization of Kupffer cells in the living liver using intravital multiphoton microscopy . Representative images of the liver of wild-type (WT) mice treated with anti-F4/80-fluorescein isothiocyanate (FITC) antibody. Green, Kupffer cells expressing F4/80-FITC; red, blood vessels; blue, nuclei. Scale bar, 100 μm
Fig. 4 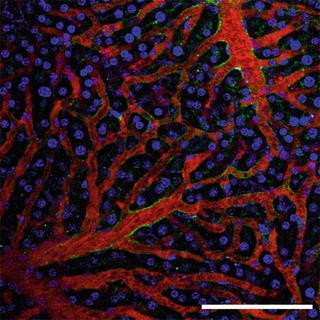
Visualization of liver sinusoidal endothelial cells in the living liver using intravital multiphoton microscopy. Representative images of the liver of WT mice treated with anti-CD31-FITC antibody. Green, liver sinusoidal endothelial cells expressing CD31-FITC; red, blood vessels; blue, nuclei. Scale bar, 100 μm
-
14.
Monitor the heart rate of the mouse using an electrocardiogram throughout imaging.


3.3 Image Processing and Analysis
3.3.1 Analysis of Intravital Multiphoton Images
-
1.
Correct images for XY drift using NIS Elements or Imaris software.
-
2.
Analyze images by measuring the frequency and duration of cell-to-cell contacts using Imaris software.
-
3.
Create a movie using After Effects software.
4 Notes
-
1.
A commercially available stage with a 24-mm hole is customized on which a cover glass and a 13-mm rubber ring are attached in order from the bottom.
-
2.
To stain Kupffer cells, 100 μl of anti-F4/80-FITC antibody (0.5 mg/ml) can be used and 100 μl of anti-CD31-FITC antibody (0.5 mg/ml) can be used to stain sinusoidal endothelial cells [4].
-
3.
To stain the vascular lumen, 20 μl of Qtracker 655 (or 100 μl of 2 mg/ml Texas-Red conjugated dextran) can be used and 40 μl of 10 mg/ml Hoechst 33342 can be used to stain cell nuclei.
-
4.
The median and left lobes are naturally protruded by pushing bilateral abdomen with hands.
-
5.
A piece of gauze is moistened and inserted between the left lobe and the body of mouse.
-
6.
A small amount of glue is applied to four spots on the glass, forming a trapezoid using the pipette. It is important to prevent drifting of the visual field.
-
7.
The lower edge of the mouse liver should be placed inside the rubber ring as gently as possible.
-
8.
The excitation wavelength of 840 nm is used. For an example of intravital time-lapse liver imaging, image stacks were collected at 5-μm vertical steps at a depth of 40–50 μm below the liver surface, 512 × 512 X–Y resolution, and a time resolution of 1 min.
References
Vollmar B, Menger MD (2009) The hepatic microcirculation: mechanistic contributions and therapeutic targets in liver injury and repair. Physiol Rev 89:1269–1339
Miyachi Y et al (2017) Roles for cell-cell adhesion and contact in obesity-induced hepatic myeloid cell accumulation and glucose intolerance. Cell Rep 18:2766–2779
Faust N et al (2000) Insertion of enhanced green fluorescent protein into the lysozyme gene creates mice with green fluorescent granulocytes and macrophages. Blood 96:719–726
Marques PE et al (2015) Imaging liver biology in vivo using conventional confocal microscopy. Nat Protoc 10:258–268
Author information
Authors and Affiliations
Corresponding authors
Editor information
Editors and Affiliations
Rights and permissions
Copyright information
© 2018 Springer Science+Business Media, LLC
About this protocol

Cite this protocol
Matsumoto, S., Kikuta, J., Ishii, M. (2018). Intravital Imaging of Liver Cell Dynamics. In: Ishii, M. (eds) Intravital Imaging of Dynamic Bone and Immune Systems . Methods in Molecular Biology, vol 1763. Humana Press, New York, NY. https://doi.org/10.1007/978-1-4939-7762-8_13
Download citation
DOI: https://doi.org/10.1007/978-1-4939-7762-8_13
Published:
Publisher Name: Humana Press, New York, NY
Print ISBN: 978-1-4939-7761-1
Online ISBN: 978-1-4939-7762-8
eBook Packages: Springer Protocols