
Abstract
Our ability to see is based on the activity of retinal rod and cone photoreceptors. Rods function when there is very little light, while cones operate at higher light levels. Photon absorption by rhodopsin activates a biochemical cascade that converts photic energy into a change in the membrane potential of the cell by decreasing the levels of a second messenger, cGMP, that control the gating of cation channels. But just as important as the activation of the cascade are the shut-off and recovery processes. The timing of shutoff and recovery ultimately affects sensitivity, temporal resolution and even the capacity for counting single photons. An important part of the recovery is restoration of cGMP through the action of rod outer segment membrane guanylate cyclases (ROS-GCs) and guanylate cyclase-activating proteins (GCAPs). In darkness, ROS-GCs catalyze the conversion of GTP to cGMP at a low rate, due to inhibition of cyclase activity by GCAPs. In the light, GCAP enhances ROS-GC activity. Mutations in the ROS-GC system can cause problems in vision, and even result in blindness due to photoreceptor death. The mouse has emerged as a particularly useful subject to study the role of ROS-GC because the technology for the manipulation of their genetics is advanced, making production of mice with targeted mutations much easier. Here we describe some experimental procedures for studying the retinal rods of wild-type and genetically engineered mice: biochemical assays of ROS-GC activity, immunohistochemistry, and single cell recording.
Key words
- Membrane guanylate cyclase
- GCAP
- Cyclic GMP
- Photoreceptor
- Visual transduction
- Knockout mouse
- Mouse genetics
- Confocal microscopy
- Single cell recording
1 Introduction
The visual system employs two kinds of photoreceptors , rods and cones, to detect and convert light into an electrochemical signal so that we are able to see. Rods are extremely sensitive to light and mediate vision at the lowest light levels. Cones are less sensitive than rods, but they respond over a wider range of intensities, they recover faster than rods, and there are different spectral types of cones that lay the foundation for color vision. Phototransduction begins when a molecule of visual pigment, rhodopsin , absorbs a photon [1,2,3]. Photoexcited rhodopsin activates transducin G proteins that in turn trigger the activity of an enzyme, PDE6 , that rapidly catalyzes the hydrolysis of cGMP to 5′-GMP. Lowering the intracellular concentration of cGMP causes cyclic nucleotide-gated (CNG) channels in the photoreceptor membrane to close. In the dark, sodium ions pour through the open channels, keeping the photoreceptor in a depolarized state that releases glutamate from its synaptic terminal. Closure of the CNG channels in the light hyperpolarizes the photoreceptor and decreases neurotransmitter release.
The mechanisms governing shutoff of phototransduction and recovery of cGMP levels are critical for setting the size, for contributing to reproducibility and for controlling the duration of the photon response. Cyclic GMP is synthesized from GTP by ROS-GC (rod outer segment membrane guanylate cyclase, sometimes referred to as ret-GC), an enzyme whose catalytic activity is intimately tied to intracellular calcium. In darkness, when cGMP levels are relatively high and the CNG channels are open, a small fraction of the inward current is carried by Ca2+. Efflux of Ca2+ mediated by a Na+/K+, Ca2+ exchanger maintains an intracellular Ca2+ concentration of 250 nM in mouse rods. Light sparks hydrolysis of cGMP, resulting in closure of CNG channels. The influx of Ca2+ decreases, yet extrusion through the exchanger persists, decreasing the concentration of intracellular Ca2+ by as much as an order of magnitude. Changes in Ca2+ concentration are detected by GCAP (guanylate cyclase activating protein) subunits of the ROS-GC complex. Mammalian rods express two forms of ROS-GC, ROS-GC1 and ROS-GC2, and two types of GCAPs, GCAP1 and GCAP2. GCAP1 is several fold less sensitive to Ca2+ than GCAP2. Thus GCAP1 senses the intracellular decline of Ca2+ first and kick starts the activation of ROS-GC early during the light-induced fall in intracellular Ca2+. The continued decline in Ca2+ recruits GCAP2, which further stimulates ROS-GC. As the cGMP concentration recovers, CNG channels reopen to allow intracellular Ca2+ to rise, which then returns ROS-GC activity back to its basal level [4].
Contributions from many research laboratories located all over the world have provided a detailed outline of phototransduction , including the role of the ROS-GC system in rods. It may well be one of the best characterized sensory transductions in the body. But this knowledge has also revealed a great complexity that remains incompletely understood and has raised many questions. For example, with regard to ROS-GC, why do vertebrates express as many as three types of ROS-GCs and as many as eight types of GCAPs ? What are the functional differences in the ROS-GC systems of rods and cones? The ROS-GC protein has been subdivided into functional domains (Fig. 1), but how do the domains communicate messages from GCAP to alter catalytic activity? Why are there separate intramolecular signaling pathways within ROS-GC for GCAP1 and GCAP2? Genetic mutations targeting cGMP metabolism in rods and cones have been found to impair phototransduction and lead to blinding diseases with an irreplaceable loss of rods, cones or both [5]. Future research will enable us to understand what pathologies and diseases arise from other molecular defects in the ROS-GC system as they are discovered and how retinal diseases may be treated.

Modular composition of the ROS-GC1 dimer. A 56-amino-acid leader sequence (LS) precedes the extracellular domain (ExtD) in the nascent, immature protein. All signaling events occur in intracellular domain (ICD), which is separated from ExtD by transmembrane domain (TMD). ICD is composed of the following domains: juxtamembrane (JMD), kinase homology (KHD), signaling helix (SHD), catalytic core (CCD), and C-terminal extension (CTE). Two phototransduction linked switches for Ca2+ sensing subunits, one for GCAP1 in the JMD, and one for GCAP2 in the CTE, are located on opposing sides of the CCD. The migratory patterns of these pathways from their sites of origin to the CCD are indicated by arrows. Both GCAPs stimulate the synthesis of the second messenger cGMP by the CCD at low Ca2+ concentrations. Although the ROS-GC1 dimer is capable of binding GCAP1 and GCAP2, the native protein has either 2 GCAP1 subunits or 2 GCAP2 subunits bound
The numerous, naturally occurring mouse mutations, the relatively small space requirement for housing mice, their rapid breeding cycle, and the capacity to genetically engineer specific proteins, makes the mouse retina a powerful tool for finding out how different components of the phototransduction cascade impact vision and why certain defects give rise to retinal degenerative diseases. The following chapter outlines histochemical, biochemical, and physiological techniques that we use to study the ROS-GC system in photoreceptors of mutant and wild type mice. Immunohistochemistry makes it possible to visualize the distribution and localization of protein components of the phototransduction cascade in distinct areas of the retina using specific antibodies raised against target antigens such as ROS-GC or GCAP . Biochemical assays isolate ROS-GC in order to study its mechanics and to gauge the effects of Ca2+ and other modulators on its activity. Mutations can be introduced in transgenic mice or by mutagenesis of recombinant proteins. Single cell recordings probe the workings of ROS-GC as part of a complete system, where it is present with native components, all in their proper locations and with natural stoichiometry. Our focus has been on the rod system, but with some modifications the same general approach may be extended to the study of cones .
2 Materials
2.1 Immunohistochemistry
2.1.1 Confocal Microscope
Imaging of immunohistochemistry is carried out using a confocal microscope. Confocal microscopes represent a significant investment of funds for acquisition and for periodic maintenance and cleaning to guarantee production of high-contrast images. A designated room with relatively constant temperature and low humidity is needed to house the microscope in order to prevent water condensation on lenses and other internal parts. The performance of the microscope is negatively impacted by vibrations transmitted through the floor of the building, therefore, a stable support is necessary (e.g., a Vibraplane vibration-free workstation from Kinetic Systems).
2.2 Biochemical Assays
ROS-GC is a membrane protein expressed in the retina in two forms, ROS-GC1 and ROS-GC2. ROS-GC1 is the predominant form in rod photoreceptors, comprising ~95% of guanylate cyclase activity in bovine retina [6] and ~80% in mouse retina [7]. ROS-GC1 is also the sole form of guanylate cyclase in mouse cones [8]. ROS-GC activity can be measured in the membranes from whole retina (see Note 1), membranes of isolated outer segments , or using purified ROS-GC protein. The first two approaches yield the combined activities of both ROS-GC1 and ROS-GC2.
2.2.1 Mouse Retinal Membranes
-
1.
Mice are dark-adapted, euthanized in darkness, and the eyes enucleated under infrared illumination. All subsequent manipulations are conducted under infrared illumination and samples are kept on ice.
-
2.
Retinas are placed in TBS buffer (Tris-buffered saline with added protease inhibitors) and washed.
-
3.
The washed retinas are homogenized with 4 bursts of a Tissumizer (Tekmar), each burst lasting 20 s, in a buffer containing: 320 mM sucrose, 20 mM Tris–HCl; pH 7.5, 2 mM MgCl2, 1 mM phenylmethylsulfonylfluoride (PMSF), 10 μg/mL leupeptin, 10 μg/mL aprotinin, 10 μg/mL trypsin inhibitor, and 50 μg/mL benzamidine (see Note 2).
-
4.
The homogenate is spun at 1000 × g for 30 min at 4 °C, the supernatant saved, and the pellet discarded.
-
5.
The supernatant is centrifuged at 43,000 × g for 1 h at 4 °C to obtain the membrane fraction.
-
6.
The pelleted membranes are resuspended in 10 mM Tris–HCl; pH 7.5, at 0.1 mg protein/mL and centrifuged at 43,000 × g for 20 min at 4 °C.
-
7.
Washing with 10 mM Tris–HCl; pH 7.5, followed by centrifugation is repeated three to five times. The purpose of these washings is to remove soluble and/or peripheral proteins (GCAPs among others).
-
8.
The pelleted membranes are resuspended in buffer containing: 50 mM Tris–HCl; pH 7.5, 10 mM MgCl2, with the addition of 1 mM PMSF, 10 μg/mL leupeptin, 10 μg/mL aprotinin, 10 μg/mL trypsin inhibitor, and 50 μg/mL benzamidine or a protease inhibitor cocktail (for example P8340, Sigma).
-
9.
The membranes are used immediately for guanylate cyclase activity assays, or frozen as aliquots in liquid N2 and stored at −80 °C (see Note 3).
2.2.2 Isolation of Mouse Retinal Outer Segment Membranes
Retinal outer segments have a significantly lower density compared to other retinal cells, so the membranes are purified by density gradient centrifugation.
-
1.
Retinas are placed in 8% (vol/vol) Optiprep in buffered Locke’s solution: 10 mM HEPES , 130 mM NaCl, 3.6 mM KCl, 2.4 mM MgCl2, 1.2 mM CaCl2, 0.02 mM ethylenediamine-N,N,N′,N′-tetraacetate (EDTA) and 20 μg/mL leupeptin; pH 7.4 (see Note 4).
-
2.
The sample is vortexed for 1 min, centrifuged at 500 rpm for 1 min, and the supernatant removed and stored on ice.
-
3.
The pellet is resuspended in 8% Optiprep and subjected to the vortexing/centrifugation sequence three more times.
-
4.
Supernatant from each spin is pooled and layered on a 10–30% (vol/vol) gradient of Optiprep in 12 mL of Locke’s buffer.
-
5.
The gradient is centrifuged for 40 min at 26,500 × g and 4 °C (see Note 5).
-
6.
To prepare washed outer segment disc membranes devoid of soluble and peripheral proteins, the isolated outer segments are suspended in 10 mM Tris–HCl buffer; pH 7.5, supplemented with protease inhibitors (1 mM PMSF, 10 μg/mL leupeptin, 10 μg/mL aprotinin, 10 μg/mL trypsin inhibitor and 50 μg/mL benzamidine).
-
7.
Outer segment membranes are gently homogenized and centrifuged first at 1000 × g for 15 min at 4–8 °C to sediment the debris and the supernatant is then centrifuged at 30,000 × g for 30 min at 4–8 °C.
-
8.
The pellet is then washed in the following sequence:
-
(a)
Three times in 20 mM MOPS, 2 mM MgCl2, 1 mM dithiothreitol (DTT), and 0.5 mM PMSF; pH 8,
-
(b)
Twice in 10 mM Tris–HCl buffer; pH 7.5, containing 5 mM DTT, 0.5 mM PMSF, and 12.5 μg/mL each of aprotinin, benzamidine, and leupeptin,
-
(c)
Once in Tris–HCl buffer; pH 7.5, without additions,
-
(d)
Once in Tris–HCl buffer; pH 7.5, with 200 mM KCl,
-
(e)
Finally in Tris–HCl buffer; pH 7.5, with 200 mM KCl and 2 mM EDTA .
-
(a)
The membranes are used immediately for guanylate cyclase activity assays, or frozen in liquid N2 and stored at −80 °C for future use.
2.2.3 Purified ROS-GC1
This protocol was modified from [9, 10].
-
1.
Rod outer segment disc membranes isolated as described earlier are solubilized in 1 M KCl and 5% Nonidet P-40 for 3 h at 0 °C.
-
2.
The reaction mixture is clarified by centrifugation and the supernatant is loaded on a GTP-agarose column equilibrated with buffer consisting of: 20 mM Tris–HCl; pH 7.5, 1 mM DTT, 2 mM MnCl2, 0.1 mM PMSF, 0.005% butylated hydroxytoluene, 2% Lubrol PX, and 25% glycerol.
-
3.
The column is washed with the same buffer and guanylate cyclase is eluted with a 0–10 mM GTP gradient also in the same buffer. Two-milliliter fractions are collected and analyzed for guanylate cyclase activity (see Note 6).
-
4.
The fractions with the maximal activity are further analyzed for purity by SDS-polyacrylamide gel electrophoresis.
This protocol was used for the purification of ROS-GC1 from bovine retina and for its sequencing. It is noteworthy that the sequencing results were then used to clone bovine ROS-GC1 cDNA [11].
2.2.4 Recombinant ROS-GC
To study the functional properties of ROS-GC1, ROS-GC2, or their mutant forms, it is most convenient to express the protein in a heterologous system of mammalian cells such as COS cells [simian virus 40 (SV40) transformed African green monkey kidney cells] (see Note 7).
For stable transfection, introduced genetic materials that usually have a marker gene for selection (transgenes) are integrated into the host genome and sustain transgene expression even after host cells replicate. In contrast with stably transfected genes, transiently transfected genes are only expressed for a limited period of time and are not integrated into the genome.
For transient transfection, COS cells are grown in DMEM supplemented with 10% fetal bovine serum and 0.05% penicillin-streptomycin. At approximately 60% confluency, the cells are transfected with the appropriate cDNA using the calcium phosphate coprecipitation technique described originally in [12]:
-
1.
DMEM is changed for cells 1–2 h prior to transfection.
-
2.
A cDNA–Ca2+–phosphate precipitate is prepared; for a 10 cm (diameter) cell culture dish, the following ingredients are mixed: 25–30 μg cDNA , 50 μL of 2.5 M CaCl2, up to 500 μL H2O.
To the above mixture while vortexing, 500 μL of 2× HEPES buffer; pH 7.05 (280 mM NaCl, 10 mM KCl, 1.5 mM sodium phosphate dibasic, 50 mM HEPES ; sterilized by filtration—pore size 0.22 μm) are added dropwise (see Note 8).
-
3.
Fine precipitate is allowed to form at room temperature for 20–30 min.
-
4.
Media is removed from the cells to be transfected.
-
5.
The cDNA–Ca2+–phosphate mixture is applied evenly onto the cells.
-
6.
Twenty minutes after application of the cDNA /Ca2+/phosphate mixture, 5 mL DMEM is added and the cells are transferred to the culturing incubator.
-
7.
After a 3–6 h incubation, media is removed from the cells.
-
8.
The cells are washed with 5 mL of serum-free medium.
-
9.
Five milliliters of 15% glycerol in serum-free DMEM are applied to the cells for 2 min.
-
10.
The glycerol solution is then diluted with 5 mL of serum free DMEM and removed immediately.
-
11.
Cells are washed once with 5 mL of serum-free DMEM.
-
12.
Regular culture medium (DMEM with fetal bovine serum and antibiotics) is added and cells are transferred to an incubator.
-
13.
Cells are grown at 37 °C in a 95% O2, 5% CO2 atmosphere.
-
14.
After 64–72 h, cells are ready for experiments.
2.2.5 Recombinant GCAP1 [13] (See Note 9)
-
1.
Bovine or mouse GCAP1 cDNA is cloned in frame into the pET21a(+) (Novagen) vector and expressed in E. coli BL21(DE3) bacterial cells carrying the plasmid pBB131 encoding yeast N-myristoyl transferase (see Note 10).
-
2.
Cells are grown at 37 °C with vigorous shaking in Lauria Broth containing 100 μg/mL ampicillin and 50 μg/mL kanamycin.
-
3.
At an OD600 of 0.5, 50 μg/mL myristic acid are added to the cell culture and the cells are grown for an additional 30 min.
-
4.
The cells are induced with 0.5 mM isopropyl-1-thio-β-d-galactopyranoside (IPTG) and cultured for another 4 h.
-
5.
The cells are harvested by centrifugation.
-
6.
The pelleted cells (from 1.0 L of culture) are suspended in 50 mL of 50 mM Tris–HCl buffer; pH 7.5, and lysed with 100 μg/mL lysozyme and 10 units/mL DNase1. After 30 min at 30 °C, lysis is terminated with 1 mM DTT and 0.1 mM PMSF.
-
7.
The lysed suspension is centrifuged at 30,000 × g for 20 min.
-
8.
The supernatant is discarded and the pellet is solubilized in 50 mM Tris–HCl buffer; pH 7.5, containing 6 M guanidinium chloride, 0.1 mM PMSF, and 2.5 mM DTT for 1 h at room temperature.
-
9.
The suspension is filtered and dialyzed at 4 °C against three changes of 10 mM EDTA and 1 mM DTT, followed by two changes of 10 mM sodium phosphate buffer containing 200 μM CaCl2 and 1 mM DTT.
-
10.
After dialysis the mixture is centrifuged at 30,000 × g for 20 min.
-
11.
The pellet is discarded and the supernatant is concentrated on an Amicon centrifugal filter (10 kDa cutoff).
-
12.
The concentrated supernatant is applied to a Superdex75 XK16/60 gel filtration column (Pharmacia) and eluted with 10 mM sodium phosphate buffer; pH 7.5, containing 100 mM NaCl and 200 μM CaCl2.
-
13.
Collected fractions are analyzed by Coomassie staining after SDS-PAGE and the fractions containing GCAP1 are pooled.
-
14.
The GCAP1 containing fractions are loaded onto an HR5/FPLC column (Pharmacia) of ceramic hydroxyapatite type I (BioRad).
-
15.
GCAP1 is eluted with a linear gradient of 0–100% 300 mM sodium phosphate; pH 7.5, in 10 mM sodium phosphate buffer; pH 7.5, containing 200 μM CaCl2.
-
16.
Purified GCAP1 is dialyzed against five changes of 50 mM (NH4)HCO3.
-
17.
Aliquots are stored at −80 °C (see Note 11).
2.2.6 Recombinant GCAP2 [14] (See Note 9)
-
1.
GCAP2 cDNA is cloned in frame into the pET21a(+) vector. E. coli BL21(DE3) cells carrying the plasmid encoding for N-myristoyl transferase are transformed with the vector.
-
2.
The transformed cells are grown at 37 °C in Lauria Broth containing 100 μg/mL ampicillin, 12.5 μg/mL chloramphenicol, and 50 μg/mL kanamycin.
-
3.
When the OD600 of the culture reaches ~0.5, 50 μg/mL myristic acid is added to the culture and the cells are grown for an additional 30 min.
-
4.
The cells are induced by the addition of IPTG to a final concentration of 0.5 mM and the expression is allowed to proceed for 4 h.
-
5.
Cells are pelleted by centrifugation (20 min, 30,000 × g) and suspended in 50 mM Tris–HCl buffer; pH 7.5 (50 mL for 1.0 L of culture).
-
6.
The pelleted cells are lysed for 30 min at 30 °C with 100 μg/mL lysozyme and 10 units/mL DNase1.
-
7.
Lysis is terminated by the addition of 1 mM DTT and 0.1 mM PMSF.
-
8.
The insoluble fraction is collected by centrifugation at 30,000 × g for 20 min.
-
9.
The pellet is solubilized by stirring in 250 mL of 50 mM Tris–HCl buffer; pH 7.5, containing 6 M guanidinium chloride, 0.1 mM PMSF, and 2.5 mM DTT for 1 h at room temperature.
-
10.
The resulting suspension is filtered.
-
11.
The supernatant is dialyzed three times at 4 °C against 10 mM sodium phosphate buffer; pH 7.5, containing 1 mM EDTA and 1 mM DTT, and two times against 10 mM sodium phosphate buffer; pH 7.5, containing 200 μM CaCl2 and 1 mM DTT.
-
12.
The reaction is clarified by centrifugation and the supernatant is concentrated on an Amicon centrifugal filter with a cutoff of 10 kDa.
-
13.
The concentrate is then applied to a Sephadex75 XK16/60 gel-filtration column (Pharmacia).
-
14.
GCAP2 is eluted with 10 mM sodium phosphate buffer; pH 7.5, 100 mM NaCl and 200 μM CaCl2.
-
15.
Fractions containing recombinant GCAP2 are pooled and bound to an UnoQ 6 column.
-
16.
GCAP2 is eluted by a gradient of 50–500 mM NaCl in 5 mM sodium phosphate buffer; pH 7.5, containing 20 μM CaCl2.
-
17.
Purified GCAP2 is dialyzed against five changes of 50 mM (NH4)HCO3 and stored in aliquots at −80 °C (see Note 12).
2.2.7 Preparation of [125I]-cGMP
[125I]-cyclic GMP is prepared using 2’-O-succinylguanosine 3′:5′-cyclic monophosphate tyrosyl methyl ester (ScGMP-TME), Na125I and chloramine T (see Note 13).
-
1.
The reaction is initiated by the addition of 10 μL chloramine T (1 mg/mL), carried out at room temperature for 1 min with constant vortexing and stopped by the addition of 50 μL sodium metabisulfite (2 mg/mL).
-
2.
The reaction mixture is applied to a Sepharose G-50 column (1 cm × 30 cm) equilibrated with PBS.
-
3.
Iodinated cGMP is eluted in 2–3 mL fractions with PBS; 10 μL of each eluted fraction is counted for radioactivity.
-
4.
Fractions with the highest radioactivity are pooled, 20% isopropanol is added and the iodinated cGMP is stored at −20 °C.
A standard curve for radioimmunoassay (RIA) is generated in duplicate.
-
1.
Cyclic GMP (0.002–0.5 pmol; 100 μL) is acetylated with 6 μL of 2:1 mixture of glacial acetic acid and triethylamine mixed with 100 μL of [125I]-cGMP (~10,000 cpm) and 100 μL of anti-cGMP antibody solution.
-
2.
The reaction is incubated overnight at 4–8 °C.
-
3.
Free cGMP is separated from antibody-bound cGMP by incubation with a charcoal suspension and centrifugation.
-
4.
The supernatant is counted for radioactivity.
2.3 Single Cell Recording
2.3.1 Rig Room
-
1.
A darkened room is necessary for tissue preparation and recording (see Note 14).
-
2.
Blackout curtains are placed to block stray light, including light from electronic displays.
-
3.
Infrared-sensitive (“night vision”) goggles equipped with an infrared source are used to perform euthanasia, enucleation of eyes, and all subsequent tissue handling.
-
4.
The dissecting microscope used for isolating the retina and chopping tissue into slices for recording is outfitted with an infrared-emitting LED and image intensifiers that are sensitive to infrared light (see Note 15).
-
5.
An anti-vibration table with a floating tabletop is required to isolate the recording apparatus from vibrations transmitted through the floor.
-
6.
An optical bench and inverted microscope are secured to the tabletop to minimize vibration and unwanted movement of the instruments.
-
7.
A xenon arc lamp serves as the light source.
-
8.
Exposure is set by electronic shutters.
-
9.
Interference filters and long wavelength bandpass filters are used to alter spectral composition (see Note 16).
-
10.
Thin-film, metal coated, neutral density filters are used to set the intensity (see Note 17).
-
11.
A photodiode placed after the shutter monitors the timing and duration of light exposure.
-
12.
The microscope is housed in a Faraday cage constructed with three walls of aluminum sheeting to shield against electrical noise and stray light. A hole in one side wall admits light from the optical bench. The open face that allows for access to the microscope is closed off with a curtain of black, electrically conductive plastic (Velostat, 3M) during the recording.
-
13.
The microscope is equipped with an infrared-sensitive camera for visualization of the cell and electrode on a closed circuit television system.
-
14.
A Huxley type micromanipulator positions the electrode.
-
15.
For recording, we use an Axopatch 200 patch clamp amplifier, a Frequency Devices 8 pole Bessel low pass filter , an Instrutech ITC16 A/D board, a MacIntosh computer, a cathode ray oscilloscope, and a strip chart recorder.
2.3.2 Recording Chamber
The recording chamber (Fig. 2) was designed by Dr. Tim Kraft [15]. The volume of the bath is created by gluing two sapphire slides to a polycarbonate spacer. The high thermal conductivity of sapphire reduces temperature gradients across the chamber. The bath is fed from microporous Teflon tubing that travels through a compartment in which the flow can be warmed and oxygenated. The tubing is wrapped with wire connected to a power supply to warm the perfusate. During an experiment, 95% O2, 5% CO2 is streamed across the tubing to assure gas equilibration. A strip of platinum foil connects the output of a bathclamp circuit to the bath. Electrical connections to the heating wire and bathclamp output are made with gold-plated bolts. A suction tube (not shown) positioned at the front of the bath, to the extreme left side toward the floor, maintains a steady meniscus (see Note 18).

Experimental chamber for recording from mouse rods
2.3.3 Electrodes
-
1.
Pyrex glass tubing 1.2 mm OD, 0.6 mm ID (Glass Company of America) is cleaned with chromic acid and rinsed with copious amounts of water.
-
2.
The glass is baked in an oven at 150 °C to remove all of the water (see Note 19).
-
3.
The electrodes are pulled using a Flaming-Brown type micropipette puller (e.g., from Sutter Instruments).
-
4.
The pipettes are stored in a covered container with foam inserts to keep the electrodes suspended, the tips protected, and away from dust and other contaminants (see Note 20).
-
5.
The tips of the pipettes are far too small for use in suction electrode recordings so the pipettes are cut to an outer diameter of ~10 μm.
-
6.
The electrode is positioned orthogonal to a diamond knife with a 3 mm cutting surface (see Note 21).
-
7.
The tip is slowly lowered onto the edge of the knife, just past the point of contact. With this very slight amount of pressure, a fracture line will form and the tip will break.
-
8.
Fracture may be encouraged by gently tapping the tabletop. The goal is to break the tip off squarely (see Notes 22 and 23).
-
9.
The tip of the electrode is polished to an inner diameter of 1.3–1.7 μm by advancing it toward a heated platinum/iridium wire that has been thinly coated with glass.
-
(a)
The pipette is laid on a specially designed carrier that can be positioned under a 40× objective of a microscope.
-
(b)
The platinum/iridium wire is mounted on a micromanipulator positioned next to the microscope stage.
-
(c)
The wire and pipette tip are positioned using manipulator and stage controls until the desired orientation is achieved, with the pipette tip perpendicular to the wire surface (see Note 24).
-
(d)
Heating is controlled by a variable transformer.
-
(a)
-
10.
Measurements for OD/ID of each electrode are made using a long working distance 100× objective. For quality control, 7–10 measurements are taken of the ID (see Notes 25–27) (Fig. 3).
Fig. 3 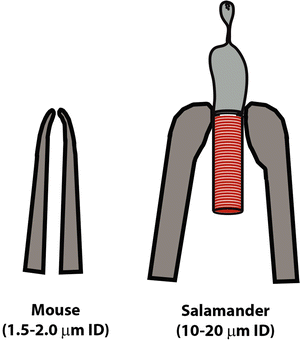
Mouse electrode vs amphibian electrode. An electrode used for recording from a mouse rod outer segment is smaller and has a different shape than that used for amphibian rod outer segments
-
11.
The electrodes are coated with silane to make the glass hydrophobic. The idea is that the cell membrane must slide into the electrode without adhering too tightly, to avoid damaging it when pulling the rod into the electrode (see Note 28).
-
(a)
For better coating, the electrodes are placed on a brass block in a glass Petri dish and heated in a vacuum oven to 180 °C to drive off water molecules.
-
(b)
When the electrodes have dried for 30 min, 20 μL of silane is added to the dish, and the pipettes are baked for an additional 30 min.
-
(c)
After 30 min, the dish is vented and the electrodes are cooled to room temperature.
-
(a)
-
12.
Electrodes are stored in dust-free containers until used.

2.3.4 Mouse Models
Mouse rods express two types of membrane guanylate cyclases (ROS-GC1 and ROS-GC2) and two types of guanylate cyclase activating proteins (GCAP1 and GCAP2). Mutant mice have been genetically engineered to lack one (GCAP1−/−, GCAP2−/−) or both (GCAPs−/−) GCAPs [16,17,18], to express a mutant GCAP1 [19, 20], to restore expression of one type of GCAP in GCAP−/− [16, 21], or to lack one or both ROS-GCs [22, 23] (see Note 29).
Mice at 4–15 weeks of age are dark-adapted overnight (about 16 h) with free access to food and water before use. Both male and female mice are used (see Notes 30 and 31). We constructed a dark-box with interior dimensions large enough to accommodate a mouse cage. This reduces unnecessary handling and accompanying stress to the animal (see Note 32).
2.4 Media and Solutions
-
1.
Disc membrane isolation buffer: 130 mM NaCl, 3.6 mM KCl, 2.4 mM MgCl2, 1.2 mM CaCl2, 10 mM HEPES , 0.02 mM EDTA , and 20 μg/mL leupeptin; pH 7.4.
-
2.
Phosphate-buffered saline: 137 mM NaCl, 2.7 mM KCl, 10 mM Na2HPO4, and 1.8 mM KH2PO4.
-
3.
Cell culture medium: Dulbecco’s Modified Eagle Medium (DMEM , GIBCO Life Technologies) supplemented with 10% fetal bovine serum and 0.05% penicillin–streptomycin.
-
4.
Leibovitz’s L-15 medium (ThermoFisher Scientific).
-
5.
Modified Locke’s solution: 112.5 mM NaCl, 3.6 mM KCl, 2.4 mM MgCl2, 1.2 mM CaCl2, 20 mM NaHCO3, 10 mM HEPES, 0.02 mM EDTA, 3 mM sodium succinate, and 0.5 mM sodium glutamate. Locke’s solution is passed through a 0.2 μm nitrocellulose filter that has been washed with three volumes of water. It is then stored at 4 °C until use. Just before use, BME vitamins, MEM amino acids, 10 mM glucose and on Dr. Tim Kraft’s recommendation, 0.1 mg/mL bovine serum albumin, are added. The pH is adjusted to 7.4 while equilibrated with 95% O2, 5% CO2.
-
6.
Electrode solution: same as modified Locke’s solution except that vitamins, amino acids, and albumin are omitted and NaHCO3 is replaced with NaCl.
3 Methods
3.1 Immunohistochemistry
Every time a new type of primary or secondary antibody or new type of tissue is used it is obligatory to standardize the conditions for immunostaining. Here we provide general guidelines, but some details such as time of tissue fixation, detergent, dilution of antibodies, and time of incubation will need to be optimized.
-
1.
A deeply anesthetized mouse is perfused transcardially with phosphate buffered saline (PBS).
-
2.
The eyes are enucleated and may be fixed intact, or an eyecup may be prepared or the retina may be isolated.
-
3.
Eyes are fixed for 3 h with 4% paraformaldehyde in PBS at 4 °C (see Note 33–35).
-
4.
After fixation, tissue is washed in PBS, and the fixed tissue is cryoprotected by immersion in 25% sucrose overnight at 4 °C.
-
5.
Cryoprotected tissue is transferred to OCT (optimal cutting temperature) mounting medium (Electron Microscopy Sciences) in plastic, peel-away molds and frozen at −20 to −80 °C (see Note 36).
-
6.
Frozen, OCT-embedded tissue is cut into sections with a cryostat at a thickness of 16 or 20 μm.
-
7.
Sections are mounted onto glass slides that are coated with an adhesive (Electron Microscopy Sciences) (see Note 37).
-
8.
Once the desired number of sections is collected, slides can be used immediately or stored at −20 to −80 °C.
-
9.
To block nonspecific protein binding, sections are incubated in 0.1 M phosphate buffer; pH 7.4, containing 10% normal serum (goat, rabbit), 5% sucrose, and 0.5% Triton X-100 for 60 min at room temperature (see Note 38).
-
10.
Sections are incubated overnight with primary antibody diluted in the blocking solution at 4 °C (see Notes 39–41).
-
11.
After incubation with primary antibodies, the sections are washed three times for 10 min each with 0.1 M phosphate buffer; pH 7.4, containing 5% sucrose at room temperature.
-
12.
Sections are subsequently incubated for 3 h at 4 °C with secondary antibody conjugated to a fluorescent dye, diluted in the blocking solution.
-
13.
After incubation with secondary antibody, the slides are washed three times for 10 min at room temperature with 0.1 M phosphate buffer; 7.4, containing 5% sucrose.
-
14.
Slides are mounted with coverslips and viewed on a confocal microscope. Images are acquired and processed using commercially available software.
-
15.
To verify the specificity of the immunostaining, control reactions are performed under identical conditions as described above except that the primary antibody is omitted, is replaced with preimmune serum or is preabsorbed on purified antigen.
3.2 Guanylate Cyclase Activity Assay
-
1.
Membranes obtained from retina, from outer segments or from mammalian cells expressing recombinant ROS-GC1 (recombinant system) are suspended in buffer containing 50 mM Tris–HCl; pH 7.4, and 10 mM MgCl2.
-
2.
Aliquots (2.5 μL) of the suspension are mixed with varying concentrations of a modulator (for example GCAP1 or GCAP2) in an assay mixture (25 μL) consisting of: 10 mM theophylline, 15 mM phosphocreatine, 50 mM Tris–HCl; pH 7.5, and 20 μg creatine kinase (Sigma) (see Note 42).
-
3.
The reaction is initiated by addition of the substrate solution (4 mM MgCl2 and 1 mM GTP, final concentrations) and incubated at 37 °C for 10 min.
-
4.
The reaction is terminated by the addition of 225 μL of 50 mM sodium acetate buffer; pH 6.2, followed by heating in a boiling water bath for 3 min.
-
5.
The amount of cGMP formed is determined by radioimmunoassay (see Note 43).
For each experimental condition, 100 μL of the reaction mixture is transferred to a 5 mL glass tube.
-
6.
Six microliters of an acetylation mixture (2:1 mixture of glacial acetic acid and trimethylamine) is added to each tube and vortexed.
-
7.
Hundred microliters of [125I]-cGMP (~10,000 cpm) diluted in water with 10% normal rabbit serum is added to each tube.
-
8.
Hundred microliters of anti-cGMP antibody solution in water with 10% normal rabbit serum and 5 mg/mL bovine serum albumin fraction V (Sigma) is added to each tube (see Notes 44–46).
-
9.
After incubating overnight at 4–8 °C, 1 mL of charcoal suspension [0.1 M potassium phosphate buffer; pH 6.8, with 2.5 mg/mL bovine serum albumin fraction V and 2 mg/mL charcoal (Activated charcoal decolorizing, Sigma)] is added to each tube and vortexed.
-
10.
After incubating for 10 min at room temperature, the tubes are spun at 3000 rpm (~2000 × g) for 10 min.
-
11.
The supernatant from each tube is collected into a 5 mL polystyrene tube (see Note 47).
-
12.
The radioactivity of each sample is quantified using a scintillation counter (see Notes 48 and 49).
3.3 Single Cell Recording of Mutant Mouse Rods
3.3.1 Prerecording Electrode Handling
-
1.
To fill an electrode, polyethylene tubing connected to a syringe is attached to the back of the electrode.
-
2.
The tip of the electrode is immersed into filtered HEPES buffered Locke’s solution and fluid is pulled into the electrode using the syringe.
-
3.
Once the fluid level passes the taper, the tubing is removed and the electrode is backfilled with a quartz Micro-Fil fiber attached to a syringe. The solutions are refiltered through a 0.2 μm nylon membrane syringe filter.
-
4.
The electrode is mounted in a holder filled with Locke’s solution.
-
5.
The holder has two ports. One port is connected to a hydraulic system to provide positive or negative pressure. The other port is connected to a calomel half-cell via a string-filled agar bridge (see Note 50).
-
6.
Agar bridges are prepared with the electrode solution lacking glucose to provide a stable, nontoxic, nonmetallic contact with the electrode and bath (see Note 51).
-
7.
Just prior to use, a droplet of filtered fetal calf serum may be dried on the shaft of the electrode close to the tip (see Note 52).
3.3.2 Dissection of the Retina
Animals are euthanized in the dark. All surgery and subsequent tissue handling is performed in the dark with the use of infrared-sensitive image enhancers.
-
1.
After euthanasia, the eyes are enucleated and placed on a petri dish lined with filter paper.
-
2.
The cornea is slit with a razor and the eyes are transferred to a second dish containing chilled Leibovitz’s L-15 solution.
-
3.
With the use of a dissection microscope equipped with infrared optics, the anterior segment is removed with curved spring scissors.
-
4.
The lens is removed with fine gauge needles whose tips have been angled slightly.
-
5.
The eyecup is cut in half with a razor blade and the retina is carefully teased away from the pigment epithelium.
-
6.
The pieces of isolated retina are transferred to a glass dish containing fresh L-15 medium, and stored in a light-tight container on ice (see Notes 53–55).
3.3.3 Single Cell Recording
-
1.
The reservoir containing the perfusate is bubbled with 95% O2, 5% CO2. In addition, 95% O2, 5% CO2 is passed over gas-permeable Gore-Tex tubing that brings the perfusate to the bath (Fig. 2), ensuring equilibration.
-
2.
Perfusate is heated to bring the chamber temperature to 36–38 °C, as measured by a thermistor probe inserted into the bath. In our chamber, the temperature variation found by sampling with the probe was ±2 °C (see Note 56–59).
-
3.
To prepare tissue for recording, a piece of retina is transferred to a culture dish lined with Sylgard, and chopped into slices in a bead of fluid (~100 μL) with a single edged razor blade (see Note 60).
-
4.
The slices are loaded into the recording chamber with a Pipetman.
-
5.
A glass rod is slid across the front of the chamber to remove some of the debris on the fluid surface, in essence “pool skimming” before the electrode is inserted into the chamber.
-
6.
After waiting a few min for pieces to settle on the bottom, the perfusion is started and the power supply to the wire heating the flow is turned on.
-
7.
The electrode is brought into the front of the chamber at a downward angle to access cells lying on the bottom of the chamber.
-
8.
Low positive pressure applied to the electrode discourages clogging of the electrode tip by debris floating in the chamber.
-
9.
Once a rod is located in a slice, the electrode tip is moved into position. Gentle suction applied to the electrode pulls the tip of the outer segment toward the electrode opening.
-
10.
The pipette is advanced to allow the rod to slide into the electrode (Fig. 4) (see Note 61).
Fig. 4 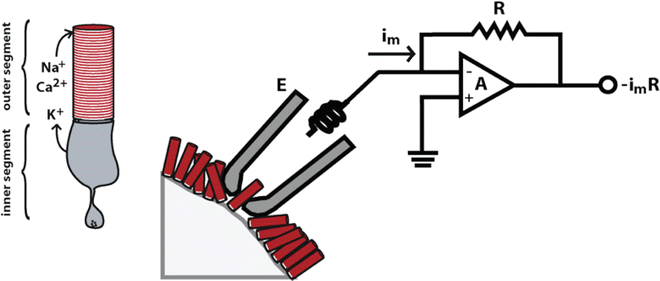
Single cell suction electrode recording. In darkness, a current circulates between the inner and outer segments. The current carried by Na+ and some Ca2+ entering the rod outer segment through the cGMP-gated channel is balanced by a current carried by K+ through voltage-gated channels in the inner segment membrane. Thus, by pulling the outer segment into a suction electrode, the circulating current can be diverted to recording electronics for measurement
-
11.
Once the outer segment is inside the electrode, the pressure is dropped to zero (see Note 62).
-
12.
To monitor the cell’s status, a flash that elicits a saturating response is given periodically (see Notes 63 and 64).
-
13.
Responses are recorded with the Axopatch patch clamp amplifier, low pass filtered with an 8 pole Bessel at 30 Hz, and digitized at 400 Hz (see Note 65).
-
14.
At the end of the recording, the cell is ejected with positive pressure. The same electrode can be used to record sequentially from multiple cells (see Note 66).
-
15.
Every few hours, the inside of the chamber is wiped clean with a Kimwipe and reloaded with freshly chopped tissue.

3.3.4 Data Acquisition
Records are digitized online with a MacIntosh computer running HEKA Patchmaster software, but we also keep a record of the scaled output of the patch clamp amplifier on videotape or on digital tape as a backup. A multichannel stimulator starts data acquisition by the Patchmaster program. After a delay for baseline recording, a pulse is sent to the shutter driver to open the shutter briefly, initiating a “flash” of ~20 ms in duration, and the response is recorded.
A response family is recorded to flashes of increasing strength. For the dimmest flashes, 20–50 trials are desirable, whereas for the brightest flashes, 2–5 trials will sometimes suffice. Responses to steps of light may also be recorded. Typically we use a duration of 10 s. Adaptation continues to develop over a longer period, particularly at the highest intensities. The 10 s duration was selected for convenience, however, when measuring incremental responses, flashes superimposed on steps, it becomes more important to wait for ~30 s before giving the flash, otherwise the capacity to adapt will be underestimated.
3.3.5 Calibration
A precise analysis of the responses of mouse rods to light of different wavelengths and flash strengths requires an accurate calibration of the light source. A digital photometer (UDT) is used to measure the light reaching the cell. A pinhole with a diameter of 200 μm is placed at the level of the chamber, and a calibrated photodiode is positioned just below the level of the recording chamber (see Note 67).
3.3.6 Analysis
-
1.
Trials at a given flash strength are averaged and then digitally filtered at 12–14 Hz, which convolves the trace with a Gaussian to smooth the output.
-
2.
The shape of the photocurrent response to a flash varies with flash strength, however, the responses to dim flashes that fall below about 1/5 of the maximum have a constant waveform and vary only in amplitude. This regime is referred to as the linear range, because the size of the response increases in proportion to the flash strength with all responses having the same kinetics as the single photon response. The kinetics of the dim flash response can be compared across rods from various types of mutant mice. Some parameters include time-to-peak, integration time, and final recovery time constant (Fig. 5) (see Notes 68 and 69).
Fig. 5 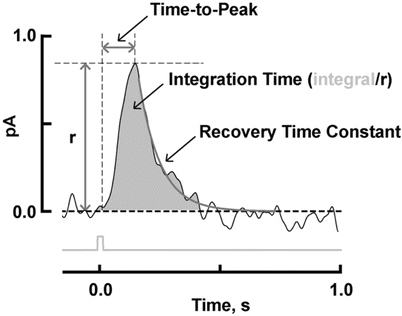
Analysis of the mouse rod dim flash response. Time-to-peak is measured from mid-flash to the peak of the response. Integration time is given as the response integral divided by the amplitude. It gives the duration of a square wave, one pA in amplitude, that has the same area as the response. It usually provides more information about the recovery phase rather than the rising phase, because the former has a much slower time course. The final recovery of the dim flash response is typically well described by an exponential function
-
3.
Relative sensitivity is found by plotting the peak amplitudes of the flash responses normalized to the saturating response amplitude against flash strength. The form of the relation is well described by a saturating exponential, r/r max = 1−exp(−ki), where k is a constant equal to ln(2)/i 1/2 and i 1/2 is the flash strength that elicits a half maximal response (see Note 70).
-
4.
The size of the single photon response may be estimated. Since rods generate highly reproducible responses to photons, their behavior in the linear range may be described as shot noise, where the main source of variance from trial to trial is whether the rod generates a quantal response or not. Hence the size of the quantal response may be estimated from the ratio of the ensemble variance to the mean amplitude of the responses to a large number of dim flash trials [24].
-
5.
The magnitude of the circulating current may be estimated from the amplitude of the saturating response (see Note 71).

These are a few basic parameters of mouse rods that can be measured with single cell recording , through which the phenotype of mutant mice can be gauged physiologically. When combined with biochemical and anatomical information, these results can give an in-depth description of the phenotypic changes that exist in the rods of genetically engineered and naturally occurring mutant mice.
4 Notes
-
1.
In mouse retina, ROS-GC1 and 2 are expressed mainly by the rods. However, interpretation of experimental results on cGMP synthetic activity in retina should be made with caution because ROS-GCs are not localized exclusively to rod outer segments. ROS-GC1 is present also in cone outer segments , in the outer plexiform layer [25,26,27] and in ganglion cells [28].
-
2.
Homogenization and washing eliminates the soluble, guanylate cyclase activity present in the retina.
-
3.
To determine whether GCAPs were successfully removed, it is important to compare the guanylate cyclase activity of the isolated membranes in the presence of 1 mM EGTA (~10 nM Ca2+ final concentration) to that with 1 μM Ca2+. Higher activity in the presence of 1 mM EGTA indicates that some GCAP is still present in the preparation and that the washing step should be repeated.
-
4.
The sucrose density gradient method [29] was used for several decades. A newer method employs OptiPrep™ solution (Sigma) instead of sucrose to prepare the density gradient [30]. OptiPrep™ is a sterile endotoxin tested solution of 60% iodixanol in water with a density of 1.32 g/mL. Iodixanol is nonionic, nontoxic to cells and metabolically inert. Its solutions have low viscosity and osmolarity thus avoiding the high viscosity of sucrose and Ficoll®.
-
5.
The outer segments migrate as the second band from the top.
-
6.
In our hands, the maximal guanylate cyclase activity is in fraction 4, whereas the activity in fractions 3 and 5 is approximately 30% of that in fraction 4.
-
7.
Other heterologous systems such as HEK (human embryonic kidney) or CHO (Chinese hamster ovary) may be substituted. COS and HEK cell lines are used mostly for transient expression whereas CHO cells are used to develop a stable expressing cell line. Having had success with COS cells, we only occasionally use the other.
-
8.
Adjusting the pH to 7.05 ± 0.05 is critical for the efficiency of transfection.
-
9.
GCAPs 1 and 2 can be purified as native proteins from the retina or as recombinant proteins expressed in bacterial or insect cells. The recombinant system is the main system used now because milligram quantities can be purified from a single culture of bacterial cells.
-
10.
The transferase is necessary because native GCAP proteins are myristoylated, which is important for their modulation of ROS-GC activity. Nonmyristoylated GCAPs activate ROS-GC1 less efficiently than the myristoylated forms. Myristoylation of GCAP2 has no influence on the apparent affinity for ROS-GC 1, but myristoylated GCAP1 has approximately sevenfold higher affinity for ROS-GC1 than nonmyristoylated GCAP1. In our laboratory the plasmid was a gift from Dr. Jeffrey Gordon, Washington University School of Medicine.
-
11.
We routinely obtain ~95% purity for GCAP1 when following this protocol.
-
12.
We routinely obtain >95% purity for GCAP2 when following this protocol.
-
13.
Routinely, we iodinate 50 ng ScGMP-TME with 1 mCi of Na125I.
-
14.
Dr. Vadim Arshavsky pointed out to us that with fluorescent illumination, the light slowly wanes after turning off the light switch, so we wait at least 5 min for the lighting to power down.
-
15.
We use a mini-Maglite fitted with an infrared LED and a pushbutton ON/OFF switch. Some “infrared” LEDs leak visible light, but inclusion of a Schott Glass RG850 filter over the face cap remedies the problem.
-
16.
Six cavity interference filters are used for wavelengths greater than 499 nm. For shorter wavelengths, transmission was poor so 3 cavity interference filters in combination with cutoff filters are used. For the latter filters, however, a small but significant amount of energy at wavelengths greater than 600 nm is transmitted from the xenon arc lamp and must be taken into account during calibration.
-
17.
The beamsplitters and neutral density filters are made of quartz. The microscope has a glass prism and condenser, nevertheless, we have been able to get a sufficient amount of UV light to the recording chamber to record spectral sensitivities in rods at and below 350 nm.
-
18.
Improper positioning of the suction tube will give rise to a drifting baseline as the meniscus waxes and wanes.
-
19.
After the glass is cleaned, it is handled only by the ends. The mid-section of the glass tubing is the portion that will be heated during the pulling process and should remain free of fingerprints and debris.
-
20.
Square, plastic Lab-Tek petri dishes fitted with a foam insert to separate pipettes are ideal storage containers. Michael Baylor found that the foam padding used for camping works especially well for the insert.
-
21.
The diamond knife is one that has been repurposed from cutting sections for electron microscopy .
-
22.
A crooked or uneven break will produce a tip with an aperture that is not round when polished. As a result, the cell may become damaged as it goes inside the electrode and the seal will be less than optimal.
-
23.
Broken off tips, glass grit and dust will accumulate on the diamond knife with use. It may be cleaned with ethanol and a cotton swab, or with compressed air.
-
24.
A cover slip attached to the microscope objective protects it from metal deposition by the heated wire.
-
25.
Despite the long working distance of the 100× objective, the electrode must be tilted slightly in order to view the tip.
-
26.
Round openings are desirable; electrodes with a wide range in diameter are discarded. Variation in diameter of less than 10% of the average is best, but we accept 30% because of uncertainty in the measurement.
-
27.
The shape of mouse electrodes differs from those used for larger amphibian rods (Fig. 3). The former have a fast taper while the latter have an extended constriction at the tip.
-
28.
We originally used tri-n-butylchlorosilane but switched to using N,N-dimethyltrimethylsilylamine (Sigma) on the advice of Dr. Gregor Jones.
-
29.
Rod transducin knockout and Nrl knockout mice are proving useful for the study of mouse cones . In the former, rods are incapable of visual transduction [31], while in the latter, rod development is precluded leading to the formation of an “all cone” retina [32, 33].
-
30.
By physical appearance and rate of outer segment renewal, mouse rod photoreceptors reach full maturity between 3 and 4 weeks of age [34]. Although gene expression of phototransduction components, rhodopsin content in the retina and rhodopsin regeneration have not quite stabilized by 3 weeks [35,36,37], rod sensitivity and flash response kinetics change only slightly over the ensuing few weeks [38]. Other factors to consider are that some mutants, e.g., hemizygous rhodopsin knockout mice (R+/−), display delayed maturation and develop a retinal degeneration that manifests initially in the loss of rods [39]. Early onset, rapidly progressing retinal degenerations may force the experimental window to be shifted to an earlier age.
-
31.
The choice of wild type mouse strain should be made with care. Some inbred strains express a protein variant or differ in their expression patterns in ways that alter retinal physiology. For example, strain differences in the variant of RPE65 expressed or in the level of melatonin expression can affect the rate of rhodopsin regeneration [40, 41]. The recent discovery that C57BL/6N but not C57BL/6J mice carry the rd8 mutation [42] underscores the existence of critical substrain variation.
-
32.
Although rhodopsin regeneration in mouse appears to be largely complete in a couple of hours, full regeneration may take up to 4 h [40, 43]. In addition, other processes, such as rhodopsin dephosphorylation and translocation of transduction components between inner and outer segment may take many hours. Thus it seems prudent to keep the mouse in darkness overnight to achieve maximal dark adaptation.
-
33.
Fixation chemically crosslinks proteins or reduces their solubility, which can mask target antigens. Therefore, the proper fixation must be experimentally optimized for each application. Fixation of the intact eye may work best in some experiments whereas fixation of an eyecup or isolated retina may be better in others.
-
34.
If isolated retina is used, 1 h fixation in paraformaldehyde at 4 °C is sufficient.
-
35.
Fixative is freshly prepared. Aliquots may be stored at −20 °C for several months.
-
36.
OCT is a water soluble blend of glycols and resins that provides a convenient specimen matrix for cryostat sectioning at temperatures of −10 °C and below. It is used instead of paraffin because the former is easily removed during washes of the sections making antigen accessible for antibody whereas removal of paraffin is more difficult and sometimes requires heating at 95 °C for unmasking the antigen.
-
37.
Microscope slides can be purchased pretreated to enhance retention of sections on the glass or they can be coated or “gelatin-subbed” by the user.
-
38.
Triton X-100 enables access of antibody to the antigen and also quenches autofluorescence of the retina. Nevertheless, it is sometimes advantageous to omit Triton X-100 from the blocking solution as we did in order to better visualize coexpression of ROS-GC1 and GCAP1 in the outer plexiform layer of the retina [27].
-
39.
Dilution and time of incubation will vary for every type of tissue and antibody. Highly specific and purified IgGs can be diluted 1:2000 and incubation for 3 h may be sufficient; if using antiserum, significantly higher concentrations and incubation times may be required.
-
40.
If primary antibody conjugated to a fluorescent dye is available, incubation with a secondary antibody is not needed.
-
41.
If colocalization of two antigens is the goal, the primary antibodies must be conjugated to different fluorescent dyes or the antibodies must be raised in different species (for example in rabbit and goat or donkey) and the secondary antibodies conjugated to fluorescent dyes must be directed toward these species. For the fluorescent dyes, the spectral characteristics (absorption and emission wavelengths) must be significantly different. We mostly use antibodies conjugated to Alexa Fluor AF488 (excitation λ 490 nm, emission λ 525 nm) or to AF647 (excitation λ 650 nm, emission λ 665 nm).
-
42.
The appropriate Ca2+ concentration is obtained by mixing EGTA and CaCl2 solutions [44].
-
43.
Radioimmunoassay (RIA) combines the specificity of antigen–antibody reaction with the sensitivity of radioisotope detection. It is an extremely sensitive assay for practically any molecule to which antibody is available and a radiolabeled form can be prepared. For radiolabeling the most frequently used procedure is the introduction of an isotope of iodine, 131I or 125I, into the tyrosine residues of the peptides. Iodination with 125I is more convenient due to its longer half-life and lower-energy radiation with consequent increased ease of handling.
-
44.
cGMP antibody can be obtained commercially, but we use a rabbit anti-cGMP antibody developed [45] and stored in aliquots at −80 °C in our laboratory.
-
45.
RIA for each experiment must be accompanied by a standard curve (see Subheading 2).
-
46.
Commercial cGMP RIA kits and manufacturer protocols for their use are available.
-
47.
The experimental tubes are not to be discarded until after the RIA results are available. In case of a problem, it is easier to repeat the RIA alone rather than the entire experiment.
-
48.
We always perform the assays in triplicate and repeat the experiments at least three times to make sure the results are reproducible.
-
49.
Guanylate cyclase activity is expressed as pmol cyclic GMP formed in 1 min per 1 mg protein [cGMP formed min−1 (mg protein)−1].
-
50.
The calomel half-cells are insulated to prevent any temperature difference across the two half-cells.
-
51.
The length of the bridge is kept short and made with thick tubing (ID = 0.375 in.) to minimize the electrical resistance.
-
52.
During the course of the experiment, heated water evaporates from the front of the experimental chamber and condenses onto the electrode. The microdroplets could form beads that drip back into the chamber causing noise; calf serum helps to prevent bead formation.
-
53.
Dr. Xiao-Hong Wen had good success with the “Winkler method” [46]. Curved blunt forceps are placed gently behind the eye. The cornea is slit across the midline with a razor. The forceps are squeezed and lifted to remove the lens and retina, which are then placed in a dish containing chilled, oxygenated Leibovitz’s L-15 medium. The retina is freed from the lens and stored in cold L-15 medium. The advantage of the Winkler method is that a retina can be isolated in a few seconds whereas a meticulous dissection takes about 20 min.
-
54.
In the early studies we followed a procedure designed to remove the vitreous humor [47, 48], since the gooey substance had the potential to clog electrodes. Later, we dispensed with the procedure after Dr. Xiao-Hong Wen observed that the vitreous dissipated with time after simply allowing the tissue to rest in L-15 for 15–30 min.
-
55.
Storage of the tissue in ice cold L-15 medium does not preserve inner retinal morphology and physiology as well as Ames medium. The rods appear to be healthy in either medium, however, the exposure to ice cold L-15 quickens rod flash response kinetics and reduces dim flash response amplitude [49].
-
56.
It is important to minimize temperature variations within the chamber because low temperature decreases the amplitude of the circulating current, slows flash response kinetics and increases relative sensitivity [50, 51].
-
57.
Bicarbonate has been shown to influence cGMP synthesis in rods, affecting the magnitude of the dark current, flash response kinetics, and flash sensitivity [52].
-
58.
It is probably best to record from rods in a large piece of tissue (slice). While isolated rods and rods in small clumps appear to be healthy, they seem to have slow kinetics, which we think is due to their inability to take in bicarbonate, e.g., [52].
-
59.
Faster flow rates are useful for quickly bringing the chamber temperature to 37 °C and for rapidly changing the type of solution perfusing the chamber, but many pieces of tissue may get washed away. If that becomes problematic, the bottom of the chamber can be treated with poly-l-lysine prior to loading chopped tissue [53].
-
60.
Only a small piece of the tissue isolated from a single eye is necessary for one recording session.
-
61.
The rod outer segment and the electrode should be coaxial before and during passage of the outer segment into the electrode.
-
62.
When the outer segment is inside the electrode, the rod can be recorded for several hours under optimal conditions. Recording times of 45 min to an hour may be more typical, though.
-
63.
The amplitude of the measured circulating current increases as more of the outer segment is pulled into the electrode [54]. It is difficult to know when the entire outer segment is inside the pipette because the inner segment has the same diameter and the boundary is not clear. Should the cell be pulled into the pipette past the junction between outer and inner segments, the amplitude of the circulating current will start to subside. What constitutes “inside” the electrode must be determined empirically, and the pressure inside the electrode balanced to stabilize the recording. Sometimes small adjustments in cell position can be made to maximize the amplitude of the response to a saturating flash. The outer segment, however, does not always slide in easily and there is a risk of pulling the cell out of the piece of tissue or ripping off the outer segment.
-
64.
A change in response amplitude could indicate movement of the rod in the electrode, in which case the pressure inside the electrode needs to be stabilized. Prolongation of the response at constant temperature, however, is always a bad sign. If you are “lucky” and there was inadequate perfusion, the flow rate can be turned up. The rod will recover. Otherwise, the rod has entered a downward spiral and will soon lose all circulating current and cease to respond to flashes. As the cell condition declines, response kinetics slow and circulating current decreases.
-
65.
Low pass filtering introduces a temporal delay, e.g., [55]. For example, with a corner frequency of 30 Hz, an 8 pole Bessel filter will delay the time-to-peak of the dim flash response by 16.9 ms.
-
66.
Eventually an electrode will become clogged. Dr. Peter Calvert found the most effective way to clear the electrode tip of debris. The electrode is removed from the bath and poked into a Kimwipe several times. The procedure is not without risk; the Kimwipe must be moved back and forth exactly perpendicular to the electrode tip. If not, the tip will break off. To make matters more challenging, the procedure must be done while visualizing the electrode with infrared-sensitive goggles, to maintain dark adaptation of the tissue. Best of luck.
-
67.
Focusing of the condenser during the experiment and for the calibration is done under infrared light, but during recordings rods may be stimulated with wavelengths ranging from ~330 nm to 800 nm. The use of a pinhole circumvents problems arising from chromatic aberration.
-
68.
Rod response kinetics are slow, so it is generally reasonable to approximate a 20 ms duration flash as an impulse and measure the interval from mid flash to the response peak as time-to-peak.
-
69.
Some care must be taken in selecting the relative amplitude for starting the exponential fit because sometimes, there is a notch in the recovery.
-
70.
This equation is consistent with the idea that a photon closes channels in an annulus of plasma membrane surrounding the site of photon absorption [56].
-
71.
The estimate is approximate because the value depends on the seal resistance, the length of OS within the electrode (see above) as well as other factors such as the rod OS length and cascade activity.
References
Lamb TD (2013) Evolution of phototransduction, vertebrate photoreceptors and retina. Prog Retin Eye Res 36:52–119
Koch KW, Dell’Orco D (2015) Protein and signaling networks in vertebrate photoreceptor cells. Front Mol Neurosci 8:67. https://doi.org/10.3389/fnmol.2015.0067
Ingram NT, Sampath AP, Fain GL (2016) Why are rods more sensitive than cones? J Physiol Lond 594:5415–5426
Wen X-H, Dizhoor AM, Makino CL (2014) Membrane guanylyl cyclase complexes shape the photoresponses of retinal rods and cones. Front Mol Neurosci 7:45. https://doi.org/10.3389/fnmol.2014.00045
Retinal Information Network (1996) The University of Texas Health Science Center, Houston, TX. http://www.sph.uth.tmc.edu/Retnet/. Accessed 30 Apr 2017
Hwang JY, Lange C, Helten A et al (2003) Regulatory modes of rod outer segment membrane guanylate cyclase differ in catalytic efficiency and Ca(2+)-sensitivity. Eur J Biochem 270:3814–3821
Peshenko IV, Olshevskaya EV, Savchenko AB et al (2011) Enzymatic properties and regulation of the native isozymes of retinal membrane guanylyl cyclase (RetGC) from mouse photoreceptors. Biochemistry 50:5590–5600
Brooks MJ, Rajasimha HK, Rogers JE et al (2011) Next-generation sequencing facilitates quantitative analysis of wild-type and Nrl(−/−) retinal transcriptomes. Mol Vis 17:3034–3054
Margulis A, Goraczniak RM, Duda T et al (1993) Structural and biochemical identity of retinal rod outer segment membrane guanylate cyclase. Biochem Biophys Res Commun 194:855–861
Hayashi F, Yamazaki A (1991) Polymorphism in purified guanylate cyclase from vertebrate rod photoreceptors. Proc Natl Acad Sci U S A 88:4746–4750
Goraczniak RM, Duda T, Sitaramayya A et al (1994) Structural and functional characterization of the rod outer segment membrane guanylate cyclase. Biochem J 302:455–461
Sambrook J, Fritsch EF, Maniatis T (1989) Expression of cloned genes in cultured mammalian cells. In: Ausubel FM, Brent R, Kingston RE, Moore DD, Seidman JG, Smith JA, Struhl K (eds) Molecular cloning: a laboratory manual, 2nd edn. Cold Spring Harbor, NY
Duda T, Venkataraman V, Goraczniak R et al (1999) Functional consequences of a rod outer segment membrane guanylate cyclase (ROS-GC1) gene mutation linked with Leber’s congenital amaurosis. Biochemistry 38:509–515
Duda T, Venkataraman V, Jankowska A et al (2000) Impairment of the rod outer segment membrane guanylate cyclase dimerization in a cone-rod dystrophy results in defective calcium signaling. Biochemistry 39:12522–12533
Makino CL, Kraft TW, Mathies RA et al (1990) Effects of modified chromophores on the spectral sensitivity of salamander, squirrel and macaque cones. J Physiol Lond 424:545–560
Mendez A, Burns ME, Sokal I et al (2001) Role of guanylate cyclase-activating proteins (GCAPs) in setting the flash sensitivity of rod photoreceptors. Proc Natl Acad Sci U S A 98:9948–9953
Makino CL, Peshenko IV, Wen X-H et al (2008) A role for GCAP2 in regulating the photoresponse: guanylyl cyclase activation and rod electrophysiology in GUCA1B knock-out mice. J Biol Chem 283:29135–29143
Makino CL, Wen X-H, Olshevskaya EV et al (2012) Enzymatic relay mechanism stimulates cyclic GMP synthesis in rod photoresponse: biochemical and physiological study in guanylyl cyclase activating protein 1 knockout mice. PLoS One 7:e47637. https://doi.org/10.1371/journal.pone.0047637
Olshevskaya EV, Calvert PD, Woodruff ML et al (2004) Y99C GCAP1 increases intracellular Ca2+ and causes photoreceptor degeneration in transgenic mice. J Neurosci 24:6078–6085
Dizhoor AM, Olshevskaya EV, Peshenko IV (2016) The R838S mutation in retinyl guanylyl cyclase 1 (RetGC1) alters calcium sensitivity of cGMP synthesis in the retina and causes blindness in transgenic mice. J Biol Chem 291:24504–24516
Howes KA, Pennesi ME, Sokal I et al (2002) GCAP1 rescues rod photoreceptor response in GCAP1/GCAP2 knockout mice. EMBO J 21:1545–1554
Yang R-B, Robinson SW, Xiong W-H et al (1999) Disruption of a retinal guanylyl cyclase gene leads to cone-specific dystrophy and paradoxical rod behavior. J Neurosci 19:5889–5897
Baehr W, Karan S, Maeda T et al (2007) The function of guanylate cyclase 1 and guanylate cyclase 2 in rod and cone photoreceptors. J Biol Chem 282:8837–8847
Baylor DA, Lamb TD, Yau KW (1979) Responses of retinal rods to single photons. J Physiol Lond 288:613–634
Cooper N, Liu L, Yoshida A et al (1995) The bovine rod outer segment guanylate cyclase, ROS-GC, is present in both outer segment and synaptic layers of the retina. J Mol Neurosci 6:211–222
Duda T, Koch KW, Venkataraman V et al (2002) Ca(2+) sensor S100beta-modulated sites of membrane guanylate cyclase in the photoreceptor-bipolar synapse. EMBO J 21:2547–2256
Venkataraman V, Duda T, Vardi N et al (2003) Calcium-modulated guanylate cyclase transduction machinery in the photoreceptor—bipolar synaptic region. Biochemistry 42:5640–5648
Krishnan A, Venkataraman V, Fik-Rymarkiewicz E et al (2004) Structural, biochemical, and functional characterization of the calcium sensor neurocalcin delta in the inner retinal neurons and its linkage with the rod outer segment membrane guanylate cyclase transduction system. Biochemistry 43:2708–2723
Papermaster DS, Dreyer WJ (1974) Rhodopsin content in the outer segment membranes of bovine and frog retinal rods. Biochemistry 13:2438–2444
Nickell S, Park PSH, Baumeister W et al (2007) Three-dimensional architecture of murine rod outer segments determined by cryoelectron tomography. J Cell Biol 177:917–925
Calvert PD, Krasnoperova NV, Lyubarsky AL et al (2000) Phototransduction in transgenic mice after targeted deletion of the rod transducin alpha-subunit. Proc Natl Acad Sci U S A 97:13913–13918
Mears AJ, Kondo M, Swain PK et al (2001) Nrl is required for rod photoreceptor development. Nat Genet 29:447–452
Daniele LL, Lillo C, Lyubarsky AL et al (2005) Cone-like morphological, molecular, and electrophysiological features of the photoreceptors of the Nrl knockout mouse. Invest Ophthalmol Vis Sci 46:2156–2167
LaVail MM (1973) Kinetics of rod outer segment renewal in the developing mouse retina. J Cell Biol 58:650–661
Carter-Dawson L, Alvarez RA, Fong SL et al (1986) Rhodopsin, 11-cis vitamin A, and interstitial retinol-binding protein (IRBP) during development in normal and rd mutant mice. Dev Biol 116:431–438
Schalken JJ, Janssen JJ, Sanyal S et al (1990) Development and degeneration of retina in rds mutant mice: immunoassay of the rod visual pigment rhodopsin. Biochim Biophys Acta 1033:103–109
Dorrell MI, Aguilar E, Weber C et al (2004) Global gene expression analysis of the developing postnatal mouse retina. Invest Ophthalmol Vis Sci 45:1009–1019
Luo DG, Yau KW (2005) Rod sensitivity of neonatal mouse and rat. J Gen Physiol 126:263–269
Lem J, Krasnoperova NV, Calvert PD et al (1999) Morphological, physiological, and biochemical changes in rhodopsin knockout mice. Proc Natl Acad Sci U S A 96:736–741
Wenzel A, Remé CE, Williams TP et al (2001) The Rpe65 Leu450Met variation increases retinal resistance against light-induced degeneration by slowing rhodopsin regeneration. J Neurosci 21:53–58
Xue Y, Shen SQ, Corbo JC et al (2015) Circadian and light-driven regulation of rod dark adaptation. Sci Rep 5:17616. https://doi.org/10.1038/srep17616
Mattapallil MJ, Wawrousek EF, Chan C-C et al (2012) The Rd8 mutation of the Crb1 gene is present in vendor lines of C57BL/6N mice and embryonic stem cells, and confounds ocular induced mutant phenotypes. Invest Ophthalmol Vis Sci 53:2921–2927
Kueng-Hitz N, Grimm C, Lansel N et al (2000) The retina of c-fos −/− mice: electrophysiologic, morphologic and biochemical aspects. Invest Ophthalmol Vis Sci 41:909–916
Patton C (2014) Ca-Mg-ATP-EGTA calculator v1.0 using constants from NIST database #46 v8. http://web.stanford.edu/~cpatton/CaMgATPEGTA-NIST.htm. Accessed 1 May 2017
Nambi P, Aiyar NV, Roberts AN et al (1982) Relationship of calcium and membrane guanylate cyclase in adrenocorticotropin-induced steroidogenesis. Endocrinology 111:196–200
Winkler BS (1972) The electroretinogram of the isolated rat retina. Vis Res 12:1183–1198
Raport CJ, Lem J, Makino C et al (1994) Down-regulation of cGMP phosphodiesterase induced by expression of a GTPase-deficient cone transducin in mouse rod photoreceptors. Invest Ophthalmol Vis Sci 35:2932–2947
Sung CH, Makino C, Baylor D et al (1994) A rhodopsin gene mutation responsible for autosomal dominant retinitis pigmentosa results in a protein that is defective in localization to the photoreceptor outer segment. J Neurosci 14:5818–5833
Azevedo AW, Rieke F (2011) Experimental protocols alter phototransduction: the implications for retinal processing at visual threshold. J Neurosci 31:3670–3682
Baylor DA, Matthews G, Yau KW (1983) Temperature effects on the membrane current of retinal rods of the toad. J Physiol Lond 337:723–734
Robinson DW, Ratto GM, Lagnado L et al (1993) Temperature dependence of the light response in rat rods. J Physiol Lond 462:465–481
Duda T, Wen X-H, Isayama T et al (2015) Bicarbonate modulates photoreceptor guanylate cyclase (ROS-GC) catalytic activity. J Biol Chem 290:11052–11060
Mazia D, Schatten G, Sale W (1975) Adhesion of cells to surfaces coated with polylysine. Application to electron microscopy. J Cell Biol 66:198–200
Baylor DA, Lamb TD, Yau KW (1979) The membrane current of single rod outer segments. J Physiol Lond 288:59–611
Schnapf JL (1983) Dependence of the single photon response on longitudinal position of absorption in toad rod outer segments. J Physiol 343:147–159
Lamb TD, McNaughton PA, Yau KW (1981) Spatial spread of activation and background desensitization in toad rod outer segments. J Physiol Lond 319:463–496
Acknowledgments
We thank Dr. Rikard Frederiksen for comments on the manuscript. Funded in part by NEI EY023980. The contents of this chapter are the sole responsibility of the authors and are not meant to convey the official views of the National Eye Institute.
Author information
Authors and Affiliations
Corresponding author
Editor information
Editors and Affiliations
Rights and permissions
Copyright information
© 2018 Springer Science+Business Media, LLC, part of Springer Nature
About this protocol

Cite this protocol
Makino, C.L., Duda, T., Pertzev, A., Sharma, R.K. (2018). Experimental Approaches for Defining the Role of the Ca2+-Modulated ROS-GC System in Retinal Rods of Mouse. In: Tanimoto, N. (eds) Mouse Retinal Phenotyping. Methods in Molecular Biology, vol 1753. Humana Press, New York, NY. https://doi.org/10.1007/978-1-4939-7720-8_9
Download citation
DOI: https://doi.org/10.1007/978-1-4939-7720-8_9
Published:
Publisher Name: Humana Press, New York, NY
Print ISBN: 978-1-4939-7719-2
Online ISBN: 978-1-4939-7720-8
eBook Packages: Springer Protocols