
Abstract
Skeletal muscle electrical stimulation is commonly used for clinical purposes, assisting recovery, preservation, or even improvement of muscle mass and function in healthy and pathological conditions. Additionally, it is a useful research tool for evaluation of skeletal muscle contractile function. It may be applied in vitro, using cell culture or isolated fibers/muscles, and in vivo, using human subjects or animal models (neuromuscular electrical stimulation – NMES). This chapter focuses on the electrical stimulation of the sciatic nerve as a research method for evaluation of the contractile properties of murine hind limb muscles. Variations of this protocol allow for the assessment of muscle force, fatigue resistance, contraction and relaxation times, and can be used as a model of contraction-induced muscle injury, reactive oxygen species production, and muscle adaptation to contractile activity.
Key words
1 Introduction
Neuromuscular electrical stimulation (NMES) consists in the delivery of electrical stimuli to motor nerves or superficial skeletal muscles, inducing muscle contraction [1]. It is used as a common therapeutic strategy for several disorders affecting the skeletal muscle. Nonetheless, it is a similarly effective research tool for in vivo assessment of neuromuscular function in different conditions (e.g., normal, fatigued, or injured muscle) and evaluation of muscle contraction properties in a standardized way (e.g., force-frequency relationship, fatigue during constant stimulation, comparison between maximal voluntary contraction and NMES-induced contraction) [1].
Muscle contraction may be “partial,” as a muscle fasciculation, or “total,” as a tetanic contraction, depending on the manipulations of NMES parameters [2]. Important parameters that must be considered are pulse amplitude, duration, frequency, and the location for delivery of the stimuli (nerve or muscle) [3]. For example, electrical stimulation directly to the nerve produces repetitive depolarization of axons in contact with the electrodes that will reach the neuromuscular junction and elicit muscle contraction. If pulse voltage is increased, axonal depolarization and recruitment of motor units are enhanced (spatial summation), producing more intense muscle contraction [3].
Frequency selection is also crucial and depends on the aim of the evaluation, as it influences contraction pattern, recruitment of motor units, and fiber types elicited. Usually, frequency is considered low when below 20 Hz and high when above 30 Hz. If above 80 Hz, they are regarded as tetanic frequencies, when complete muscle relaxation between stimuli is prevented and temporal summation occurs until a fused tetanus producing maximal force is achieved. Isotonic muscle contractions (twitch) are elicited at low frequencies (1–10 Hz), and maximal tetanic muscle contractions are achieved at high frequencies (~100 Hz) [4,5,6]. Low-frequency stimulation activates fewer and smaller motor units, with predominantly oxidative/slow/type I fibers, and high-frequency stimulation activates more and larger motor units, with glycolytic/fast/type II muscle fibers. For example, rat soleus muscle, composed mainly by oxidative/slow/type I muscle fibers (83% type I, 17% type IIa, 0% type IIb) [7], presents a median motor unit firing frequency of 19–26 Hz [8]. The extensor digitorum longus (EDL) muscle, composed mainly by glycolytic/fast/type II muscle fibers (3% type I, 54% type IIa, 43% type IIb) [7], presents a median motor unit firing frequency of ~30 Hz [9]. During volitional contractions of increasing intensity, smaller motor units are recruited first, followed by larger ones, a pattern that is reversed during NMES [10].
Electrical stimulation protocols performed in muscle cell culture and isolated fibers, both in vitro models, provide a highly controlled environment for muscle studies, and the potential of manipulating the culture conditions and perfusion media confers additional experimental advantage. These are powerful approaches for investigation of specific mechanisms underlying muscle function. However, in situ and in vivo models take into account whole-body dynamics, including cardiovascular, respiratory, neural, and endocrine features. They represent the “final effect” of the mechanisms investigated by in vitro models and molecular studies on muscle contractile function. Therefore, in vivo models are a necessary complement to in vitro studies. They are also useful tools on investigation of muscle function during pathological conditions, such as diabetic myopathy, disuse-induced atrophy, muscular dystrophy, cachexia, several neuromuscular disorders, and other situations, including ageing, muscle regeneration , hypertrophy, stem cell treatment, and nutritional supplementation [11,12,13,14,15,16].
The method for murine NMES described here is based on Wojtaszewski et al. [17] and Silveira et al. [18] with modifications by Pinheiro et al. [12] and Fortes et al. [15]. It provides a direct assessment of basic parameters of neuromuscular excitability (rheobase and chronaxie) and skeletal muscle contractile function (force and shortening/relaxation properties). Specific contraction protocols can be developed according to the purposes of the study. This experimental setup supports short- or long-duration protocols, as well as the development of force-frequency curves (Fig. 1), providing models for analysis of muscle strength, fatigue , contraction-induced injury, reactive oxygen species production, recruitment of specific motor units/fiber types, and muscle adaptation to contractile activity.

Screenshots of myograms (“force × time” graphs) from rat triceps surae muscle group at increasing frequencies for development of a force-frequency curve. Pulse duration: 500 μs. Voltage: 10–15 V. Force is presented in gram-force (1gf = 9.806 × 10⁻³ N). Time is presented in s. (a) Overall image showing summation effect and progressive force increase at 10 Hz (b), 20 Hz (c), and 30 Hz (d), until a fused tetanic contraction and force plateau are achieved at 40 Hz (e) and 50 Hz (f). Images acquired from the data analysis software AqAnalysis® (Lynx Tecnologia Eletronica Ltda, Sao Paulo, Brazil)
2 Materials
2.1 Equipment
-
1.
Electrical stimulation device MultiStim System D330 (Digitimer Ltd., Welwyn Garden City, Hertfordshire, UK) (see Note 1 ).
-
2.
Force transducer (Grass Technologies, West Warwick, RI, USA) (see Note 1 ).
-
3.
Acrylic platform (Fig. 2a).
Fig. 2 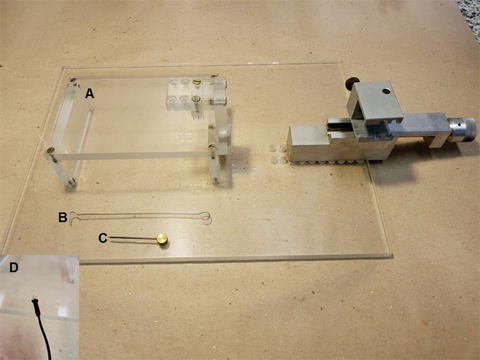
Specialized equipment for the setup of electrical stimulation protocol. (a) Acrylic platform. (b) Stainless steel rod with hook ends. (c) Stainless steel pin. (d) Curved electrode
-
4.
Stainless steel rod with hook ends (Fig. 2b).
-
5.
Stainless steel pin (Fig. 2c).
-
6.
Curved electrodes (Fig. 2d).
-
7.
Heating lamp.
-
8.
Computer with AqDados® and AqAnalysis® softwares (Lynx Tecnologia Eletronica Ltda, Sao Paulo, Brazil).

2.2 Reagents
-
1.
Ketamine solution.
-
2.
Xylazine solution.
3 Methods (see Note 2 )
3.1 Anesthesia
-
1.
Anesthetize rats or mice by intraperitoneal injection of ketamine and xylazine 90/10 mg/kg (see Note 3 ).
-
2.
Maintain consistency in terms of time of day, and use a heating lamp and/or heated platform for maintenance of regular body and muscle temperatures during the protocol (see Note 4 ).
3.2 Sciatic Nerve Access and Electrode Placement
-
1.
Using a pair of scissors and tweezers, retract the skin covering the anesthetized rat/mouse hind limb, exposing the thigh and calf muscles .
-
2.
Using a craniolateral approach, palpate the femur and estimate the incision site at about 1/3 to 1/2 of the proximal length of the thigh (the interval between superficial gluteal muscles and biceps femoris is identified as the access point) (see Note 5 ).
-
3.
Place a pair of scissors orthogonally to the muscle surface to pierce the fascia and displace the muscle fibers, by inserting the closed scissors, slightly opening and retracting it while still partially open.
-
4.
Perform this movement along the length of the boundary between the gluteal and biceps femoris muscles.
-
5.
Use a pair of tweezers to hold the 1-cm-long incision open, and move the muscle layer, until detection of the sciatic nerve underneath (Fig. 3a).
Fig. 3 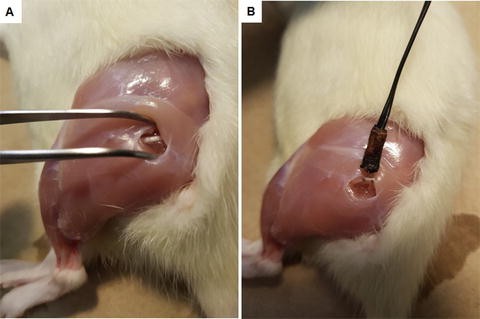
Sciatic nerve access and electrode placement. (a) Access point between gluteal and biceps femoris muscles , where the sciatic nerve is detected beneath the superficial muscle tissue. (b) The curved electrode is placed avoiding straining of the nerve
-
6.
Place the curved electrodes on the nerve, which is still above the trifurcation level, avoiding pulling and straining motions (Fig. 3b).

3.3 Tenotomy
-
1.
To evaluate the contractile function of a single muscle (soleus, EDL, or gastrocnemius) or muscle group (triceps surae, plantaris + gastrocnemius + soleus), tenotomize corresponding synergistic and antagonist muscles and retract their fascia.
-
2.
Prevent excessive blood loss if damaging main blood vessels, such as the saphenous artery (some loss cannot be avoided).
-
3.
Alternatively, the contractile function of the whole calf may be assessed without the need of tenotomy (see Note 6 ).
3.4 Animal Setup on Acrylic Platform
-
1.
Place the animal in supine position on the acrylic platform while the forelimbs and the remaining hind limb are immobilized and taped to the platform (the hip joint should be positioned at approximately 130° angle).
-
2.
Insert a stainless steel pin across the knee of the hind limb to be stimulated, beneath the distal portion of the quadriceps femoris muscle , as close as possible to its insertion point in the knee.
-
3.
Attach the pin to the platform, stabilizing and fixing the joint, also at an approximate angle of 130°.
-
4.
Place one hook end of the stainless steel rod under the corresponding distal tendon of the target muscle, and attach the other to the force transducer (Fig. 4) (see Note 7 ).
Fig. 4 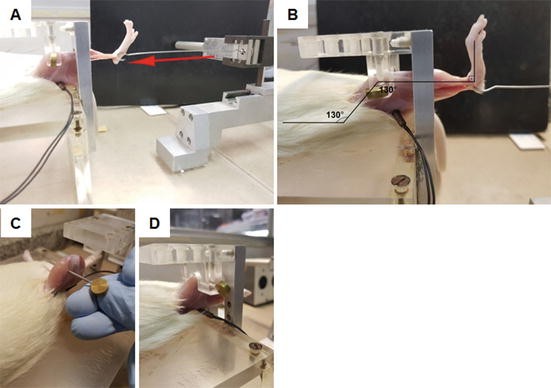
Animal setup for electrical stimulation. (a) Rod placement under the EDL muscle tendon, connecting the muscle to the force transducer. The arrow shows the direction the rod is pulled during contractions, transmitting the force that will be measured by the transducer and recorded by the software. (b) Axis showing hip and knee articulations positioned at approximately 130° angle and ankle joint at 90° angle. The electrode is already connected to the sciatic nerve and the stainless steel rod is placed under the calcaneal (Achilles) tendon for electrical stimulation of the triceps surae muscle group. (c) Detail of pin placement under quadriceps femoris muscle and across the knee for joint stabilization. (d) Detail of pin placement showing how it fixes the knee joint to the acrylic platform

3.5 Adjustments of Electrical Stimulation Parameters and Pretest Assessment
-
1.
Perform NMES using symmetrical monophasic square waves produced by an electrical stimulation device connected to the electrode placed at the sciatic nerve (see Note 8 ).
-
2.
For pretest assessments, use an electrical stimulus to produce twitch contractions consisting of 500 μs pulse duration and 1 Hz frequency.
-
3.
Apply increasing voltage until maximum force production is reached (usually around 10–15 V) (see Note 9 ).
-
4.
Measure the electrophysiological parameters of excitability rheobase and chronaxie (or strength-duration time constant) before starting the protocol (see Note 10 ).
3.6 Protocol Execution and Examples
-
1.
Apply electrical stimulation impulses fixed at 500 μs pulse duration at a voltage found to elicit maximal force production (usually around 10–15 V) [1] (see Note 11 ).
-
2.
Manipulate frequency to produce twitch or tetanic contractions at 1 and 100 Hz, respectively [1] (Fig. 5).
Fig. 5 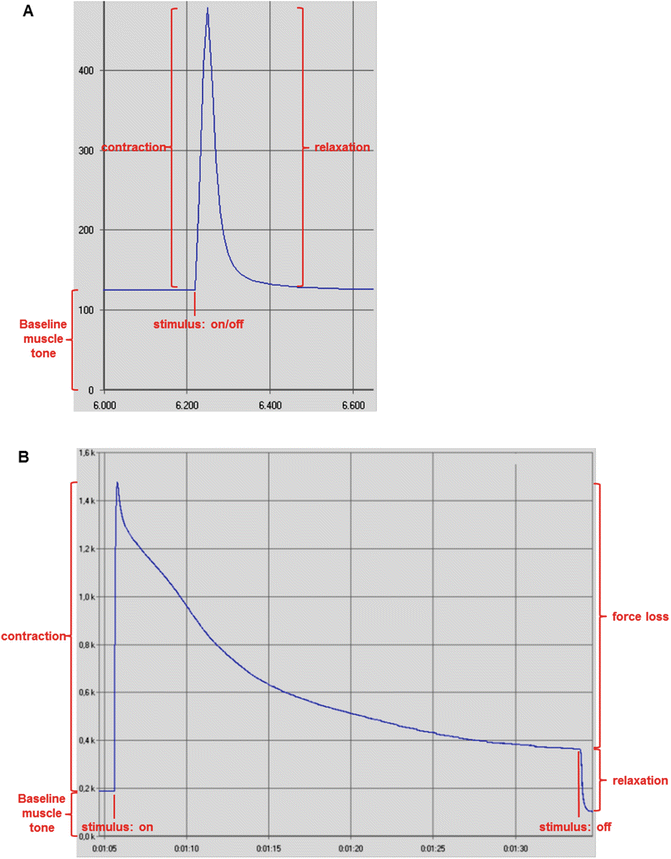
Screenshots of myograms depicting twitch and tetanic contractions from rat triceps surae muscle group. Force is presented in gram-force (1gf = 9.806 × 10⁻³ N). (a) Twitch contraction and force increase upon electrical stimulation, followed by muscle relaxation and force decrease when the stimulus was ceased. Pulse duration: 500 μs. Frequency: 1 Hz. Voltage: 10–15 V. Time is presented in s. (b) Tetanic contraction, force loss during persistent stimulation for approximately 30 s, and relaxation after stimulus was ceased. Pulse duration: 500 μs. Frequency: 100 Hz. Voltage: 10–15 V. Time is presented as min:s. Images acquired from the data analysis software AqAnalysis
-
3.
Normalize the obtained absolute twitch and tetanic forces to muscle wet mass, dry mass, or cross-sectional area (specific force).

3.7 Twitch Parameters
-
1.
Use a series of 5–10 twitch contractions at 1 Hz for estimation of maximal absolute twitch force, time to peak (TTP – time between the onset of force development until peak tension), rate of force development (RFD – amount of force generated per time unit during muscle shortening), half relaxation time (HRT – time of muscle relaxation halfway from peak tension), and late relaxation time (LRT – time of muscle relaxation between 50% and 25% of peak tension) [13] (Fig. 6).
Fig. 6 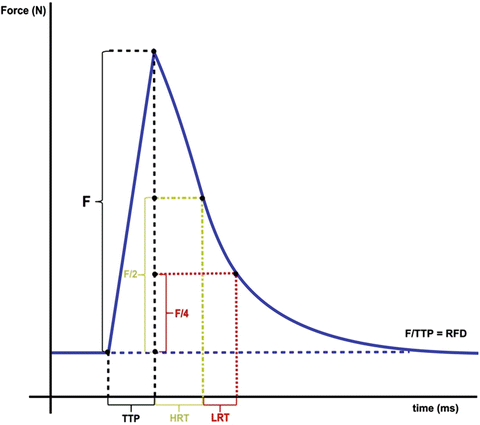
Summary of muscle contractile parameters . F, absolute force produced (N): measured from baseline muscle tone to achieved peak tension and may be normalized to wet muscle mass, dry muscle mass, or cross-sectional area of the muscle for calculation of specific muscle force (N/g or N/mm2). TTP, time to peak (ms): period between the onset of force development until peak tension. RFD, rate of force development (N/ms): amount of force generated per time unit (F/TTP) during muscle contraction. HRT, half relaxation time (ms): time of muscle relaxation halfway from peak tension. LRT, late relaxation time (ms): time of muscle relaxation between 50% and 25% of peak tension
-
2.
After at least 1 min recovery period, other protocols may be performed.

3.8 Long-Duration Low-Frequency Fatigue Protocol
-
1.
Elicit a series of twitch contractions at 1 Hz over 60 min of electrical stimulation, and measure decrease of force production and alteration of shortening and relaxation properties over time [11, 12] (see Fig. 7) (see Note 12 ).
Fig. 7 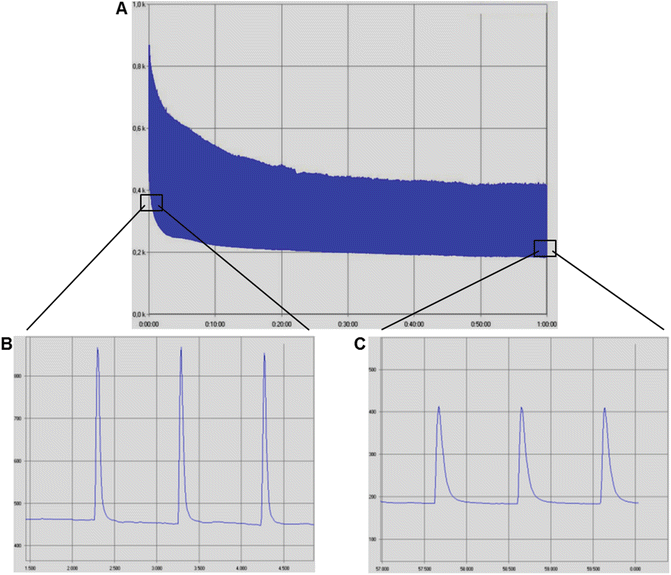
Screenshots of myograms from rat triceps surae muscle group during a long-duration low-frequency fatigue protocol, consisted of one maximal twitch contraction per second during 60 min. Pulse duration: 500 μs. Frequency: 1 Hz. Voltage: 10–15 V. Force is presented in gram-force (1gf = 9.806 × 10⁻³ N). (a) Overall image of the protocol showing twitch force decrease as the protocol progresses. Time is presented as h:min. (b) Zoomed-in image of a, showing twitch contractions in detail at the beginning of the protocol. Time is presented in s. (c) Zoomed-in image of a, showing that twitch contractions at the end of the protocol presented reduced force production (peak force decrease) and impaired shortening and relaxation (less steep shortening and relaxation curves) when compared to the initial contractions. Time is presented in s. Images acquired from the data analysis software AqAnalysis

3.9 Short-Duration High-Frequency Fatigue Protocol
-
1.
Elicit five to ten successive tetanic contractions at 100 Hz, with 1 s duration/each and 10 s of recovery between them, and measure decrease of force production over the course of the protocol [13, 14, 16] (Fig. 8) (see Note 13 ).
Fig. 8 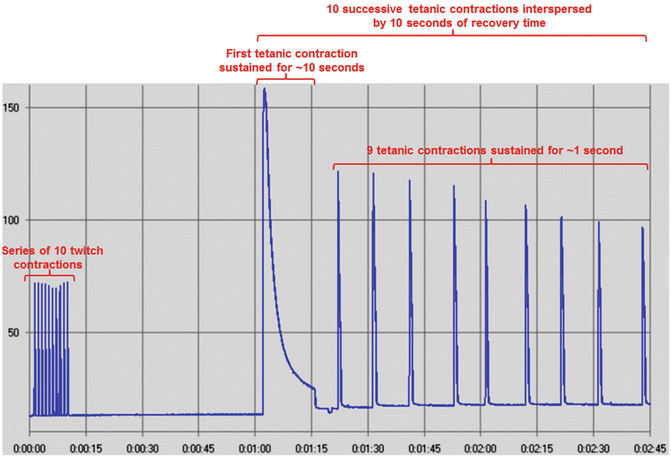
Screenshot of a myogram from rat soleus muscle during a short-duration high-frequency fatigue protocol. It consisted of a series of ten twitch contractions, a recovery period of 1 min, and ten successive tetanic contractions interspersed by 10 s of recovery time. The first contraction was sustained for 10 s, and the remaining ones were sustained for 1 s. Tetanic contractions had pulse duration of 500 μs, frequency of 100 Hz, and voltage of 10–15 V. Twitch contractions had the same parameters, except for frequency (1 Hz). Force is presented in gram-force (1gf = 9.806 × 10⁻³ N). Time is presented as min:s. Image acquired from the data analysis software AqAnalysis

3.10 Long-Duration High-Frequency Fatigue Protocol
-
1.
Elicit 6 series of 14 tetanic contractions with 2 s duration/each, with an interval of 20 s between contractions and 5 min between series.
-
2.
Measure decrease of force production during successive contractions and force recovery between series as the protocol progresses (Fig. 9) (see Note 14 ).
Fig. 9 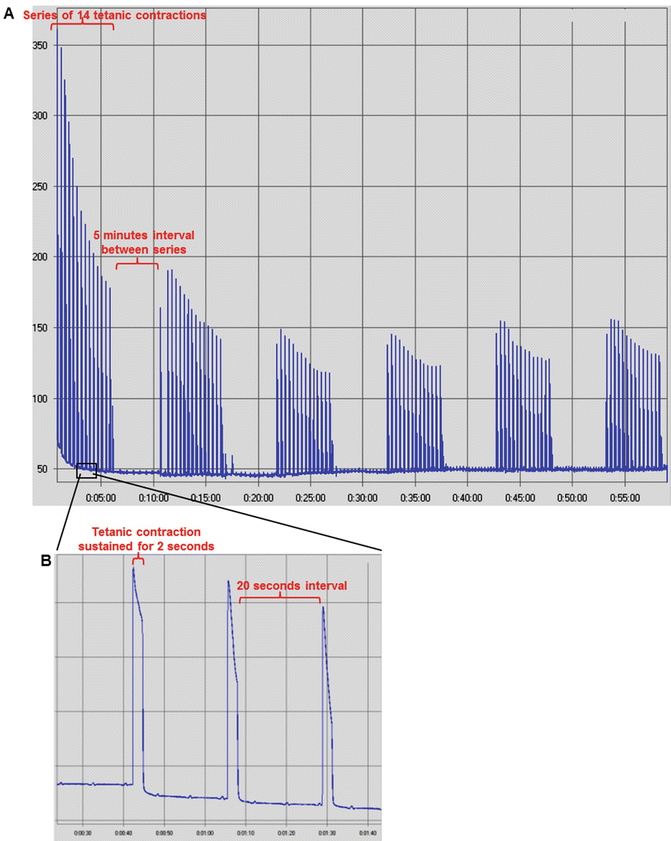
Screenshots of myograms from mice triceps surae muscle group during a long-duration high-frequency fatigue protocol. Pulse duration of 500 μs. Frequency of 100 Hz. Voltage of 10–15 V. Force is presented in gram-force (1gf = 9.806 × 10⁻³ N). (a) Overall image of the protocol, showing the tetanic force decrease during 6 series of 14 tetanic contractions separated by 5 min of recovery between series. Time is presented in min. (b) Zoomed-in image of the protocol showing further details about the contraction series, such as the tetanic contraction duration of 2 s, interspersed by 20 s of interval between contractions. Time is presented as min:s. Images acquired from the data analysis software AqAnalysis

4 Notes
-
1.
The electrical stimulation device and force transducer models and manufacturers may vary without significantly influencing the mentioned protocols.
-
2.
All procedures should be approved by institutional ethical committees and performed accordingly to international and local principles of care and use of laboratory animals.
-
3.
Alternative anesthetic regimens may be used [19], such as intraperitoneal injection of barbiturates, the addition of acepromazine (3 mg/kg b.w.) to the ketamine/xylazine solution for longer surgical procedures, or the use of inhalation anesthesia.
-
4.
Besides the regular parameters for assessment of anesthesia effectiveness, such as rate and depth of respiration and response to painful stimuli [19], this experimental setup provides a very sensitive monitoring of muscular tone and contraction. Any minimal alteration of baseline muscle tension or unintended muscle contraction can be detected by the force transducing software, and anesthesia can be promptly adjusted. The time of day for experimentation and preexperimental routines should be standardized, as muscle contractile function and anesthesia susceptibility may be affected by stress and circadian cycle. The anesthesia causes a rapid decrease in body temperature and may lead to hypothermia [19]. It also affects muscle temperature, potentially interfering with muscle force, contraction, relaxation , and fatigue [20]. Thus, the use of a heating lamp and/or heated platform is necessary for the maintenance of regular body and muscle temperatures throughout the protocol.
-
5.
The surgical procedures for accessing the sciatic nerve are usually performed while flexing the hip and knee joints of the animal.
-
6.
Activation of both plantar flexors and extensor muscles by sciatic nerve stimulation results in plantar flexion, as the former is stronger than the latter [4]. This stimulation results in concentric contraction (shortening) of the plantaris, gastrocnemius, and soleus muscles and eccentric contraction (lengthening) of the tibialis anterior and EDL muscles [21, 22]. Thus, it does not require muscle tenotomy and fascia removal, as it will consider the resulting action of all synergistic and antagonist muscles on plantar flexion.
-
7.
By manipulating the traction of the rod coupled to the tendon and the force transducer, the resting length (L0) of the muscle and the ankle joint angle are adjusted, until reaching approximately 90°, enough to enable achievement of maximum tension upon stimulation.
-
8.
The induced contraction tractions the rod placed between the distal tendon of the muscle and the force transducer. The resulting force is measured by the force transducer as the numerical and graphical information is transferred to the computer software and displayed on the screen.
-
9.
Small adjustments to muscle length and ankle joint angle might support the achievement of maximum force.
-
10.
The rheobase is the minimal voltage necessary on a stimulus with infinitely long duration to produce excitation, and chronaxie is the duration of the electrical stimulus to elicit a detectable muscle contraction, using twice the voltage of rheobase [23]. The first one can be estimated by setting pulse duration at the highest value allowed by the device and keeping frequency at 1 Hz while gradually increasing voltage from zero until occurrence of a minimal contraction. The second can be acquired by doubling the rheobase voltage and keeping the frequency at 1 Hz while gradually increasing pulse duration until a muscle contraction is detected.
-
11.
The described electrical stimulation parameters and protocols design were presented as examples. They may be altered according to the evaluated muscle and aims of the study and still be suitable for execution using the proposed experimental setup.
-
12.
This protocol also promotes contraction-induced muscle injury [11, 12] and oxidative stress [12].
-
13.
The first tetanic contraction is used for evaluation of maximal tetanic force production [15].
-
14.
The initial contraction of the first series is used for assessment of maximal tetanic force. This protocol is able to activate signaling pathways and induce expression of genes associated to exercise adaptation.
References
Maffiuletti NA (2010) Physiological and methodological considerations for the use of neuromuscular electrical stimulation. Eur J Appl Physiol 110:223–234
Collins DF (2007) Central contributions to contractions evoked by tetanic neuromuscular electrical stimulation. Exerc Sport Sci Rev 35:102–109
Bergquist AJ, Clair JM, Lagerquist O, Mang CS, Okuma Y, Collins DF (2011) Neuromuscular electrical stimulation: implications of the electrically evoked sensory volley. Eur J Appl Physiol 111:2409–2426
Baar K, Esser K (1996) Phosphorylation of p70(S6k) correlates with increased skeletal muscle mass following resistance exercise. Am J Phys 276:C120–C127
Brown MD, Cotter MA, Hudlicka O, Vrbova G (1976) The effects of different patterns of muscle activity on capillary density, mechanical properties and structure of slow and fast rabbit muscles. Pflugers Arch 361:241–250
Donselaar Y, Eerbeek O, Kernell D, Verhey BA (1987) Fibre sizes and histochemical staining characteristics in normal and chronically stimulated fast muscle of cat. J Physiol 382:237–254
Laughlin MH, Armstrong RB (1983) Rat muscle blood flows as a function of time during prolonged slow treadmill exercise. Am J Phys 244:H814–H824
Eken T, Elder GC, Lomo T (2008) Development of tonic firing behavior in rat soleus muscle. J Neurophysiol 99:1899–1905
Eken T (1998) Spontaneous electromyographic activity in adult rat soleus muscle. J Neurophysiol 80:365–376
Binder-Macleod SA, Snyder-Mackler L (1993) Muscle fatigue: clinical implications for fatigue assessment and neuromuscular electrical stimulation. Phys Ther 73:902–910
Bassit RA, Pinheiro CH, Vitzel KF, Sproesser AJ, Silveira LR, Curi R (2010) Effect of short-term creatine supplementation on markers of skeletal muscle damage after strenuous contractile activity. Eur J Appl Physiol 108:945–955
Pinheiro CH, Vitzel KF, Curi R (2012) Effect of N-acetylcysteine on markers of skeletal muscle injury after fatiguing contractile activity. Scand J Med Sci Sports 22:24–33
Pinheiro CH, Gerlinger-Romero F, Guimaraes-Ferreira L, de Souza AL Jr, Vitzel KF, Nachbar RT et al (2012) Metabolic and functional effects of beta-hydroxy-beta-methylbutyrate (HMB) supplementation in skeletal muscle. Eur J Appl Physiol 112:2531–2537
Pinheiro CH, de Queiroz JC, Guimaraes-Ferreira L, Vitzel KF, Nachbar RT, de Sousa LG et al (2012) Local injections of adipose-derived mesenchymal stem cells modulate inflammation and increase angiogenesis ameliorating the dystrophic phenotype in dystrophin-deficient skeletal muscle. Stem Cell Rev 8:363–374
Fortes MA, Pinheiro CH, Guimaraes-Ferreira L, Vitzel KF, Vasconcelos DA, Curi R. (2015) Overload-induced skeletal muscle hypertrophy is not impaired in STZ-diabetic rats. Physiol Rep 3(7): pii: e12457. doi:10.14814/phy2.12457.
Abreu P, Pinheiro CH, Vitzel KF, Vasconcelos DA, Torres RP, Fortes MS et al (2016) Contractile function recovery in severely injured gastrocnemius muscle of rats treated with either oleic or linoleic acid. Exp Physiol 101:1392–1405
Wojtaszewski JF, Hansen BF, Urso B, Richter EA (1996) Wortmannin inhibits both insulin- and contraction-stimulated glucose uptake and transport in rat skeletal muscle. J Appl Physiol (1985) 81:1501–1509
Silveira L, Hirabara SM, Alberici LC, Lambertucci RH, Peres CM, Takahashi HK et al (2007) Effect of lipid infusion on metabolism and force of rat skeletal muscles during intense contractions. Cell Physiol Biochem 20:213–226
Gargiulo S, Greco A, Gramanzini M, Esposito S, Affuso A, Brunetti A et al (2012) Mice anesthesia, analgesia, and care, part I: anesthetic considerations in preclinical research. ILAR J 53:E55–E69
Allen DG, Lamb GD, Westerblad H (2008) Skeletal muscle fatigue: cellular mechanisms. Physiol Rev 88:287–332
Funai K, Parkington JD, Carambula S, Fielding RA (2006) Age-associated decrease in contraction-induced activation of downstream targets of Akt/mTor signaling in skeletal muscle. Am J Physiol Regul Integr Comp Physiol 290:R1080–R1086
Parkington JD, LeBrasseur NK, Siebert AP, Fielding RA (2004) Contraction-mediated mTOR, p70S6k, and ERK1/2 phosphorylation in aged skeletal muscle. J Appl Physiol (1985) 97:243–248
Nodera H, Kaji R (2006) Nerve excitability testing and its clinical application to neuromuscular diseases. Clin Neurophysiol 117:1902–1916
Acknowledgments
The authors are grateful to Adhemar Pettri Filho (in memoriam) for the excellent technical assistance and constant support for the establishment and improvement of the method.
Author information
Authors and Affiliations
Corresponding author
Editor information
Editors and Affiliations
Rights and permissions
Copyright information
© 2018 Springer Science+Business Media, LLC
About this protocol

Cite this protocol
Vitzel, K.F. et al. (2018). In Vivo Electrical Stimulation for the Assessment of Skeletal Muscle Contractile Function in Murine Models. In: Guest, P. (eds) Investigations of Early Nutrition Effects on Long-Term Health. Methods in Molecular Biology, vol 1735. Humana Press, New York, NY. https://doi.org/10.1007/978-1-4939-7614-0_26
Download citation
DOI: https://doi.org/10.1007/978-1-4939-7614-0_26
Published:
Publisher Name: Humana Press, New York, NY
Print ISBN: 978-1-4939-7613-3
Online ISBN: 978-1-4939-7614-0
eBook Packages: Springer Protocols