
Abstract
The mouse model characterized by spontaneous lung metastasis from JygMC (A) cells closely resembles the human triple negative breast cancer (TNBC) subtype. The primary tumors morphologically present both epithelial and spindle-like cells, but metastases in lung parenchyma display only adenocarcinoma properties. In the study of molecular signatures, laser capture microdissection (LCM) on frozen tissue sections was used to separate the following regions of interest: the epithelial–mesenchymal transition (EMT), mesenchymal–epithelial transition (MET), carcinoma, lung metastases, normal mammary gland and normal lung parenchyma. NanoString was selected for the study of molecular signatures in LCM targets as a reliable downstream gene expression platform allowing analysis of tissue lysates without RNA extraction and amplification. This chapter provides detailed protocols for the collection of tissue, LCM sample preparation and dissection, production of lysates, extraction, and quality control of RNA for NanoString analysis, as well as the methodology of Nanostring gene expression profiling experiment.
1 Introduction
LCM is a research tool used for molecular profiling of defined cell populations which can be cleanly separated from surrounding cells. LCM facilitated the discovery of biomarkers and genes responsible in the disease onset and progression [1,2,3,4,5,6,7,8,9,10]. The molecular analysis of complex tissues is not reliable for finding subtle changes in the molecular signature and the correlation of cellular molecular signatures with specific cell populations [9]. Frozen samples are considered to be the base for accurate molecular data, with established protocols for target collection, LCM slide, and lysis preparation [4, 6, 7, 11]. However, these procedures are not directly applicable to the input sample requirements of downstream targets assessment by NanoString nCounter gene expression analysis, which we used to study a clinically relevant mouse model. This model phenotypically and at the gene-expression level, resembles the human TNBC molecular subtype which metastasizes spontaneously to the lungs [12]. Combining LCM with NanoString technology we made it possible to focus on highly defined histological areas to clarify discrete molecular changes in gene expression at a greater level of resolution. LCM samples usually contain nanograms of total RNA and require RNA extraction and amplification steps to satisfy input requirements in micro array gene profiling platform. To consider the issue of RNA loss during extraction and possible bias during RNA amplification, we selected a hybridization-based gene profiling platform, Nanostring, where the lysates of LCM targets are used as a direct input to the downstream application. NanoString is a highly advantageous platform for the analysis of LCM samples, as it does not require RNA extraction and amplification, and uses feasible input amounts of RNA; 100 ng of total RNA lysed in 4 μl of RNA extraction buffer [13, 14]. When microarray analysis of RNA extracted from whole tumors is compared with NanoString analysis of LCM lysates from defined cell populations collected within those tumors, it shows that Nanostring is a reliable downstream platform for analyzing gene expression in LCM samples [12, 15]. In the present chapter, we describe the adaptation of LCM methodology for collecting samples suitable for NanoString analysis, which allows high-quality RNA lysates to be obtained from homogenous cell populations, as opposed to heterogeneous whole tissue samples. Our adaptation of LCM sample preparation and workflow to the requirements of the NanoString platform allowed acquiring samples with high RNA quality for sensitive detection of genes of interest during the study of spontaneous metastatic carcinoma mouse model [12, 15]. This workflow is suitable for the study of any mouse model warranting the use of LCM technology for the molecular characterization of specific cell populations.
2 Materials
2.1 Tissue Sample Collection for LCM
-
1.
Necropsy protocol (see Note 1 ).
-
2.
Necropsy station with RNase-free forceps, scissors, scalpels, razor blades (see Note 2 ).
-
3.
RNase AWAY™.
-
4.
Nuclease-free water.
-
5.
Kimwipes.
-
6.
Euthanasia chamber.
-
7.
CO2.
-
8.
Tissue-Tek OCT Compound (OCT) (Sakura Finetek USA, Inc., Torrance, CA, USA).
-
9.
Cryomolds.
-
10.
Adhesive Cryolabels (see Note 3 ).
-
11.
2-methylbutane.
-
12.
Dry ice.
-
13.
Styrofoam box.
-
14.
Ziploc bag.
2.2 Cryosectioning of OCT-Embedded Samples for LCM Slide Preparation and RNA Quality Control in OCT Blocks
-
1.
Items 3–5, 12 and 13 from Subheading 2.1.
-
2.
Cryostat.
-
3.
OCT tissue blocks.
-
4.
Razor blades.
-
5.
100% ethanol.
-
6.
Forceps.
-
7.
1.5 ml nuclease-free micro-centrifuge tube for high G-force.
-
8.
RNase-free glass histology slides.
-
9.
Metal frame PET membrane slides (frame membrane slide) (MMI Molecular Machines & Industries, Glattbrugg, Switzerland).
-
10.
MMI SupportSlide (SupportSlide) (MMI Molecular Machines & Industries Glattbrugg, Switzerland).
-
11.
Adhesive slide labels.
-
12.
Ultraviolet light chamber at 352 nm.
-
13.
RA Lamb Five-Slide Mailer (Five-Slide Mailer).
2.3 Determination of RNA Quality in Tissue Samples Collected for LCM
-
1.
AllPrep® DNA /RNA Micro Kit (Qiagen GmbH, Hilden, Germany).
-
2.
Vortexer.
-
3.
NanoDrop™ Spectrophotometer (NanoDrop).
-
4.
Agilent 2001 Bioanalyzer.
-
5.
Agilent RNA 6000 Pico Chip (Pico Chip) (Agilent Technologies, Santa Clara, CA).
-
6.
Agilent Bioanalyzer 2001 Expert software (Agilent Technologies, Santa Clara, CA).
2.4 Digital Images of H&E Slides for LCM Pathology Annotation Reference
-
1.
Item 5 from Subheading 2.2.
-
2.
Hematoxylin.
-
3.
Eosin Y.
-
4.
Bluing reagent.
-
5.
Xylene.
-
6.
Aperio Scan Scope®XT scanner.
-
7.
Image Scope™ software.
2.5 Staining of Metal Frame Membrane Slides for Laser Dissection
-
1.
Items 4, 5, 12 and 13 from Subheading 2.1; item 5 from Subheading 2.2; item 5 from Subheading 2.4.
-
2.
50 ml conical polypropylene tubes.
-
3.
ProtectRNA™RNase inhibitor (ProtectRNA) (Sigma, Saint Louis, MO, USA).
-
4.
Glacial acetic acid.
-
5.
MethylGreen (MG).
-
6.
Cresyl violet acetate: 1% solution in 100% ethanol aged for 6 months [11].
-
7.
Eosin Y.
-
8.
Desiccator.
-
9.
Desiccant.
2.6 Laser Microdissection and Pilot Study for the Determination of RNA Quality and Content in LCM Targets
-
1.
Item 9 from Subheading 2.2.
-
2.
MMI Cell Cut Plus Laser Microdissection System (MMI Cell Cut Plus) (MMI Molecular Machines & Industries, Glattbrugg, Switzerland).
-
3.
Computer with wide monitor for displaying LCM reference images from Aperio database.
-
4.
MMI IsolationCap® (0.5 ml and 0.2 ml) (IsolationCap).
-
5.
Metal frame slides with mounted sections.
-
6.
Conventional dissecting microscope.
2.7 Preparation of LCM Lysates for NanoString Analysis
-
1.
Item 5 from Subheading 2.1; items 3 and 5 from Subheading 2.2; item 6 from Subheading 2.6.
-
2.
RNase-free Inox #5 forceps (Roboz Surgical Instrument, Co., Dumont, Switzerland).
-
3.
Nuclease-free PCR tubes.
-
4.
Buffer RLT (Qiagen GmbH, Hilden, Germany).
-
5.
Centrifuge.
-
6.
Wet ice.
-
7.
RNaseOut™ RNase inhibitor (RNaseOut) (Invitrogen, Carlsbad, CA, USA).
-
8.
RNase-free barrier long tips for 20-PT pipette.
2.8 NanoString Analysis of LCM Samples
-
1.
NanoString technology consumables (NanoString Technologies, Seattle, WA, USA).
-
2.
nCounter Custom Gene Expression Assay (Reporter Codeset and Capture Probeset).
-
3.
Total RNA lysates of LCM samples in buffer RLT.
-
4.
NanoString nSolver Analysis Software version 1.1 (NanoString Technologies, Seattle, WA, USA).
-
5.
NanoString Analysis protocol.
3 Methods
3.1 Tissue Sample Collection for LCM
For the study of a spontaneous metastatic mammary carcinoma mouse model we used female Balb/c athymic nude mice that were 8 weeks of age (National Cancer Institute), which were injected bilaterally into the fourth mammary fat pad with JygMC(A)-GFP/Luc cells under analgesia by isoflurane/O2 (to effect) [12]. We adopted the following approach for the animal sample collection (see Note 4 )
-
1.
Select eight tumor-bearing mice for the collection of two primary mammary carcinoma masses and two lung metastases from each mouse. Select three untreated animals of the same age for the collection of normal mammary gland and lung parenchyma from each animal (see Note 5 ).
-
2.
Conduct necropsy procedures under conditions approved by your institute and ACUC study protocol (see Note 6 ).
-
3.
Following RNase-free conditions, prepare the following items: necropsy station, labeled cryomolds, slurry of dry ice and 2-methylbutane in a covered Styrofoam box or ice bucket, a Styrofoam box with dry ice (Fig. 1).
Fig. 1 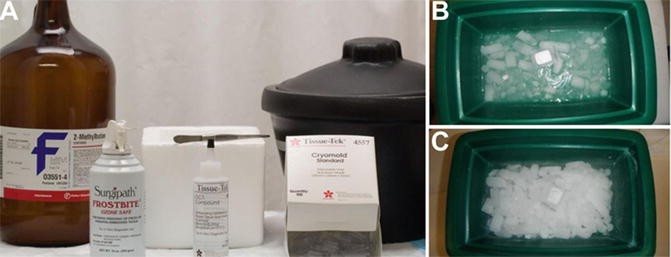
Tissue embedding in Tissue-Tek® OCT Compound . (a) Materials and equipment for embedding. (b) Incubation of cryomold with tissue embedded in OCT on the slurry of dry ice and 2—methylbutane. (c) Solidified block is transferred to dry ice for complete evaporation of 2-methylbutane prior to storage
-
4.
Perform euthanasia by exposure to compressed CO2 gas at a fill rate of 20% of the chamber volume per minute, with one animal per chamber in its home cage. After 10 min of exposure, observe the animal for signs of unconsciousness (lack of respiration and pedal reflex, faded eye color).
-
5.
Subject animal to bilateral thoracotomy, secure the animal with the pins to the dissecting board, and blot any blood with kimwipes (see Note 7 ).
-
6.
Wet the mouse with 70% ethanol, cut the abdominal skin open, and pin it to the board along the body to avoid contamination of target organs with hair (see Note 8 ).
-
7.
Use separate RNase-free instruments for dissection of each organ type (see Note 9 ).
-
8.
Embed each organ in OCT media on slurry of dry ice and 2-methylbutane (Fig. 1), positioning the organ in the middle of the cryomold (see Note 10 ).
-
9.
Make sure to embed and freeze the target organs within 6 min after euthanasia [11].
-
10.
Keeping bags on dry ice, seal prepared OCT blocks in a plastic bag with a sealer, or place them in a double Ziploc bag and transfer to the −80 °C storage prior to cryosectioning (see Note 11 ).

3.2 Cryosectioning of OCT Embedded Samples for LCM Slide Preparation and RNA Quality Control in OCT Blocks
During cryosectioning, RNase-free conditions were maintained throughout the procedure, as described previously [11]. Cryosectioning was performed in two steps. In the first step, sections were cut from each block for RNA quality control in the prepared tissue block (three replicates per block) (see Note 12 ).The last section from each block was mounted on glass slide and stained with hematoxylin and eosin (H&E) for initial pathology evaluation. In addition, for the pilot study, we cut ten serial sections from one random block of normal tissues (mammary gland and lung), primary tumor and lung metastasis . Section number six was mounted on glass slide and stained with H&E for LCM target reference, and the remaining sections were mounted on frame membrane slides for LCM target dissection. In the second step, we cut an estimated number of sections per tissue block and mounted them on frame membrane slides for LCM target dissection.
-
1.
Label frame membrane slides with solvent resistant adhesive labels on the “window” side, and incubate in a UV chamber at 352 nm for 30 min for RNase-free conditions and better adherence of frozen sections to the membrane.
-
2.
Prepare lab marker pen, RNase-free SupportSlide, and a box with dry ice lined up with kimwipes. Place labeled Five-Slide Mailers on dry ice inside the box.
-
3.
Set the cryostat at −16 °C for the object and −17 °C for the chamber.
-
4.
Wipe all the surfaces inside and outside the cryostat, brushes, forceps and pencils with 100% ethanol, place three labeled 1.5 ml nuclease-free micro-centrifuge tubes in a small container with dry ice inside the cryostat.
-
5.
Use a new blade for each tissue block.
-
6.
Move OCT blocks, one at a time, from dry ice into the cryostat chamber, and wait for 30 min before mounting the block on the chuck (see Note 13 ).
-
7.
Place a small amount of OCT on the chuck, and immediately mount the tissue block. Wait for 10 min prior to sectioning.
-
8.
Face the block, cut three 10 μm sections and put them in a tube kept on dry ice inside the cryostat chamber. Move the tube into the box with dry ice (see Note 14 ).
-
9.
Cut and mount the next section on a glass slide to be used as initial H&E. Cut the required number of serial sections for LCM , mounting them on sequentially labeled frame membrane slides, and mounting each 6th section in the sequence on a glass slide. Prepare two extra frame membrane slides to be used as test slides for the setup of laser and camera parameters during laser dissection (see Note 15 ).
-
10.
Prechill frame membrane slide in the cryostat chamber for 2 min, cut the section, insert SupportSlide into the “window” of frame membrane slide (Fig. 2), and mount the section onto the membrane. Remove SupportSlide and put frame membrane slide on dry ice always keeping the lid on the box. Keep SupportSlide at room temperature (RT) for mounting the next section.
Fig. 2 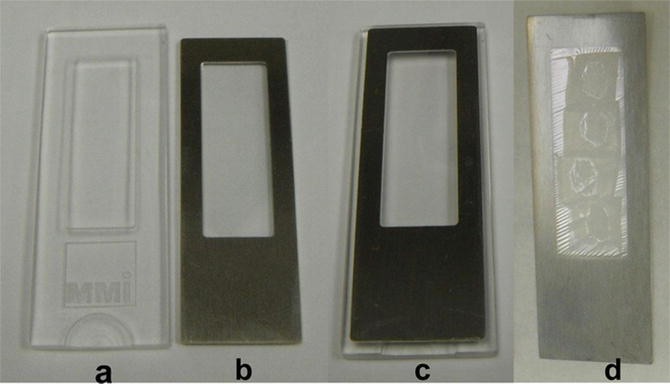
Sectioning of OCT tissue blocks for LCM . (a) MMI SupportSlide, (b) Frame membrane slide, (c) SupportSlide and frame membrane slide assembly, (d) Multiple serial sections mounted on frame membrane slide after trimming of OCT block
-
11.
After the acquisition of a required number of slides for the sample, detach the block from the chuck, wrap in aluminum foil and return to the Ziploc bag on dry ice. Transfer the slides into the appropriately labeled Five-Slide Mailers (see Note 16 ) and place them in a Ziploc bag.
-
12.
Transfer the slides and blocks to −80 °C storage out of the box with dry ice.

3.3 Determination of RNA Quality in Tissue Samples Collected for LCM
-
1.
Prepare all the required components of AllPrep® DNA/RNA Micro Kit for RNA extraction.
-
2.
Transfer the tubes with frozen sections from −80 °C storage into the box with dry ice.
-
3.
Working with each tube one at a time, warm up the tube lid with your fingers keeping the tube in dry ice. Open the lid, add 350 μl of buffer RLT to the frozen sections, vortex the tube for 2 min at maximum setting, then place in wet ice. Process the rest of tubes for the entire extraction batch in the same manner.
-
4.
Transfer the tubes from wet ice to the tube rack and incubate for 5 min at RT.
-
5.
Vortex the tubes for 30 s and proceed with total RNA extraction according to the manufacturer’s instructions.
-
6.
Determine RNA concentration in the samples using NanoDrop.
-
7.
Dilute the samples with RNase-free water to the concentration below 5000 pg/μl and load them on Agilent PicoChip.
-
8.
Determine RNA Integrity Number (RIN) in RNA samples based on Agilent Bioanalyzer run [16].
3.4 Digital Images of H&E Slides for LCM Pathology Annotation Reference
-
1.
Stain sections on glass slides with H&E stain (see Note 17 ).
-
2.
Scan the slides on Aperio Scan Scope®XT scanner and transfer images into the study folder for annotation of LCM targets by a study pathologist.
-
3.
Record image IDs of the sections containing the following targets—EMT, MET, carcinoma, lung metastases, normal mammary gland and normal lung parenchyma—for quick reference during LCM.
3.5 Staining of Frame Membrane Slides for Laser Dissection
Staining of LCM slides was conducted in the fume hood under RNase-free conditions in 50 ml conical polypropylene tubes, containing 45 ml of solution, one slide at a time, as previously described [11].
-
1.
Change the solution after each batch of six slides.
-
2.
Prepare the following items: (a) solution of 3% glacial acetic acid in 100% ethanol—place in Styrofoam box with dry ice for 1 h, (b) MG with ProtectRNA —add 4 μl of ProtectRNA to 1 ml of MG, mix by vortexing, (c) Cresyl violet acetate/eosine Y mix (CVAE) —combine 75 μl of 1% alcoholic cresyl violet acetate solution, 25 μl of eosin Y, 250 μl of RNase-free water and 250 μl of 100% ethanol, mix by vortexing, (d) 100% ethanol, (e) xylene, (f) desiccator with desiccant.
-
3.
When fixative is chilled, transfer the LCM slide from dry ice into the tube with fixative on dry ice and incubate for 30 s.
-
4.
Apply 1 ml of MG/ProtecRNA mix to the slide using barrier pipette tip, and incubate for 20 s. Drain the slide and repeat the procedure.
-
5.
Rinse the slide in 100% ethanol for 10 s with up and down movement.
-
6.
Apply 300 μl of CVAE to the slide using barrier pipette tip and incubate for 30 s.
-
7.
Dehydrate the slide in two changes of 100% ethanol for 30 s each.
-
8.
Incubate the slide in two changes of xylene for 2 min each.
-
9.
Dry xylene off the slide in a fume hood and place it in a desiccator at least for 15 min prior to laser dissection (see Note 18 ).
3.6 Laser Microdissection and Preparation of LCM Lysates for NanoString Analysis
Dissections were performed on MMI CellCut Plus instrument at 10× magnification with UV laser, within 30-min dissection time per slide, following RNase-free conditions.
-
1.
Power the MMI Cell Cut Plus instrument and start the software.
-
2.
Power the on-network computer, start Image Scope™ software, open the folder with annotated images, and upload the selected image on the screen.
-
3.
Wipe the base of the regular dissecting microscope with RNase AWAY.
-
4.
Prepare the following items for the LCM session: (a) forceps, (b) Styrofoam box with wet ice, (c) Styrofoam box with dry ice, (d) RNase-free glass slides, (e) RLT buffer, (f) PCR tubes filled with mixture of 5 μl of buffer RLT, prepared according to the manufacturer’s instructions, and 0.3 μl of RNaseOut, (g) IsolationCaps, (h) RNase-free barrier tips for PT-20 pipette with the tip cutoff to a 3 mm stump with the barrier, (i) stained test frame membrane slides, (j) 100% ethanol.
-
5.
Place the tubes with lysis buffer in wet ice.
-
6.
Load the glass support slide on the dissecting stage and position test slide on the top of the glass slide, with the slide label facing up. Make sure that the sandwiched slides leveled inside the holder.
-
7.
Select 4× objective and set up slide limits in the software tool panel.
-
8.
Change objective to 10×, bring tissue in focus, adjust illumination with the camera controls, and adjust laser focus and line width with power and speed sliding controls (see Note 19 ).
-
9.
Disable “AutoShape” and “Collect with Cap UP” function, and select “Auto New Cap.”
-
10.
Change to 4× objective, remove the test slide together with the glass slide, and insert the new glass slide and the first serial frame membrane slide stored in a desiccator. Start the timer set for 30 min.
-
11.
Create an overview of a tissue section and change to 10× objective.
-
12.
Load IsolationCap in the cap lift, select “Cap Up position.”
-
13.
Using Image Scope™ image registration software match the position and magnification of H&E reference slide on the overhead reference monitor to the image of the tissue on LCM dissecting screen.
-
14.
Using slide overview, move the area of the section with the first target in the middle of the dissecting screen, and reflect the annotations from Aperio image to the dissecting screen with the drawing touch pen.
-
15.
Check the laser position, press the “Cut” button and collect the target cutout with the IsolationCap.
-
16.
Collect the rest of the targets, overlapping cutouts on the IsolationCap (Fig. 3) and stop collection when the timer goes off (see Note 20 ).
Fig. 3 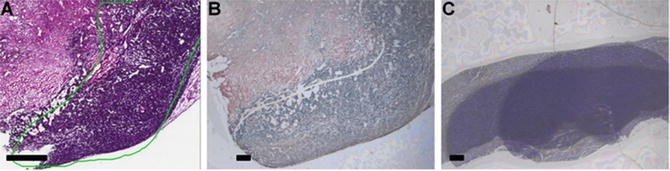
LCM target collection for NanoString analysis with “Auto New Cap” setup. (a) Target area annotated by study pathologist on a digital image of reference H&E section of mammary gland. (b) Dissecting screen view of the target area with the laser cut path. (c) View of LCM cap with three overlapped collected targets. (a) Scale bar corresponds to 650 μm; (b, c) Scale bars correspond to 300 μm
-
17.
Remove the cap from the cap lift and transfer it under the conventional dissecting microscope with 1.5× magnification.
-
18.
Detach the overlapped tissue in bulk from the IsolationCap with fine tip forceps and transfer it to the PCR tube with lysis buffer (see Note 21 ).
-
19.
Vortex the tube for 15 s, spin down, check that the cutouts are submerged in lysis buffer, and return the tube on ice.
-
20.
Repeat dissections for the next serial slide adding the cutouts to the same tube with lysis buffer until the collection of required amount of cutouts is completed. Then incubate the tube at RT for 20 min, vortex for 30 s, and spin down (see Note 22 ).
-
21.
Insert the stump of the barrier pipette tip into the new PCR tube, and transfer the lysate onto the filter barrier. Spin down the tube with the remaining lysate, gather cutouts in a lump with the pipette tip and transfer them to the bottom of the filter barrier not touching the sides (see Note 23 ).
-
22.
Centrifuge the filter-tube assembly at 6000 × g for 30 s, and repeat as needed until all the lysate passed through the filter barrier. Discard the stump with cutouts.
-
23.
Measure the lysate volume and adjust it with original lysis buffer to 4.5 μl.
-
24.
Place the tube on dry ice and transfer to −80 °C storage up to 4 weeks prior to NanoString analysis (see Note 24 ).

3.7 Pilot Study for the Determination of RNA Quality and Content in LCM Targets
We found out that a pilot study is an important part of any LCM project that needs to be tailored to the tissue type. We selected a block with the largest target areas from the set of samples dedicated to the LCM study and cut 10–20 extra sections prior to final LCM of the whole set. These sections were used for: (a) evaluation of LCM workflow design for preservation of RNA integrity in LCM targets, (b) evaluation of approaches to sample collection and preparation, (c) estimation of RNA content per area of LCM target, (d) estimation of target area/number of sections/slides needed to satisfy the requirements of the downstream input.
-
1.
Based on annotation data in Aperio Image Scope software, calculate the combined areas of several annotated targets (in mm2) for each of three replicates for RNA isolation, and make sure that each set of selected targets can be dissected and lysed within 30 min.
-
2.
Perform LCM and prepare lysates as describes in Subheading 3.6.
-
3.
Add 350 μl of buffer RLT to the Nanostring lysate, vortex and put the tube on dry ice.
-
4.
Proceed with RNA extraction, quantification and RNA quality assessment as described in Subheading 3.3 (see Note 25 ).
-
5.
Calculate RNA yield in ng/mm2 of the target tissue as an average of three replicates. Adjust the number upward by 30% for the typical loss of RNA in column based extraction methods. Use this value for the estimate of target area (in mm2) which is required for the acquisition of 100 ng of total RNA (see Note 26 ).
-
6.
Conservatively estimate the number of slides needed for LCM of each target, based on the estimate of target area size and the annotation data of reference H&Es (see Note 27 ).
3.8 NanoString Analysis of LCM Samples
-
1.
Select genes of interest together with housekeeping genes for data normalization to create the Nanostring Probe Set for each gene of interest (Reporter CodeSet and Capture ProbeSet) for the nCounter® Custom Gene Expression Assay, or acquire the commercially available pathway panel of interest (NanoStrings Technologies, Seattle, WA) (see Note 28 ).
-
2.
Create a master mix containing 130 μl of the Report CodeSet and 130 μl of hybridization buffer, and add 20 μl of each solution into the prepared screw cap centrifuge tubes.
-
3.
Add 5 μl of LCM RNA lysate to each tube, and immediately before placing the reaction at 65 °C, add 5 μl of Capture ProbeSet to each tube following the nCounter Gene Expression Assay Manual instructions.
-
4.
Incubate hybridization assays for at least 12 h, and, following the manufacturer’s instructions, immediately proceed to post-hybridization processing with the nCounter Prep Station which detects the targets with molecular barcodes.
-
5.
Collect and tabulate the data by the Digital Analyzer.
-
6.
Using nSolver Analysis Software, import the RCC file with the nCounter data.
-
7.
Make sure that the completed run satisfies the quality control requirements of NanoString platform: (a) Imaging performance—600 FOV (fields of view per sample), (b) sample saturation-binding density between 0.05 and 2.25 across the samples, (c) positive controls—linearity with corresponding dilutions, (d) negative controls—values in a range from 0 to 10 (see Note 29 ).
-
8.
Proceed to normalization of the data: (a) correct the raw counts by subtracting the average value of negative controls, (b) normalize the data by the average values of the set of housekeeping genes using nSolver Analysis Software.
-
9.
Perform ANOVA test between normalized data attributed to different LCM cell populations with chosen p-value and fold change value (see Note 30 ).
-
10.
Use unsupervised hierarchical clustering method for grouping and segregation of samples (see Note 31 ).
4 Notes
-
1.
Necropsy protocol should be designed in a way that the target tissue would be stabilized by freezing in 6 min after animal death [17, 18].
-
2.
Materials from the unopened packaging are RNase-free; with consequent use, avoid materials exposed to the environment. Tools can be cleaned for RNase-free conditions with RNase AWAY and rinse in nuclease-free water.
-
3.
It is important to have clear identification for collected samples. Hand writing on the plastic molds with a laboratory marker is not recommended due to instability of the marker ink during handling of the sample. It is advisable to affix the adhesive cryo labels to the molds before transferring them to −80 °C.
-
4.
All the samples collected with our approach contained high-quality RNA: RINs 9.6–9.8 from mammary primary tumor and lung metastasis blocks, and 9.1–9.7 from blocks of normal tissues (Fig. 4). Since RNA is subjected to some degradation during staining steps of LCM, it is crucial to have sample of high molecular integrity for LCM experiment for unbiased gene profiling results.
Fig. 4 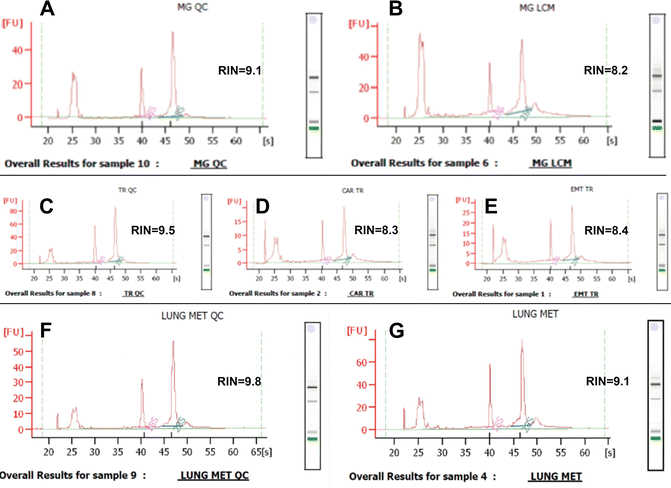
Representative Agilent electropherograms of high quality RNA retrieved from the control sections and corresponding LCM targets. (a, c, f) Frozen section of normal mammary gland (a), primary mammary tumor (c) and lung metastasis (f) placed directly in lysis buffer for RNA extraction. (b) LCM sample of normal mammary tissue. (d, e) LCM cell populations of primary mammary tumor: carcinoma (d) and EMT (e). (g) LCM sample of lung metastasis (reproduced from Open Access ref. 15)
-
5.
Consult with statistician about the sample set size for the study. Considering the cost and length of animal experiments, statistically sound planning is crucial to address sample variation and obtain reliable results.
-
6.
We conducted all animal procedures under conditions approved by the Frederick National Laboratory for Cancer Research, an AAALAC accredited institution that follows the Public Health Service Policy for the Care and Use of Laboratory Animals outlined in the “Guide for Care and Use of Laboratory Animals” [19]; Frederick National Laboratory for Cancer Research ACUC 11-067 approval on 03/16/2012. All the animals were sacrificed with tumor sizes below two centimeters in diameter, and maximum weight loss below 20% of initial total body weight.
-
7.
Blood is enriched with RNases and triggers RNA degradation in contaminated samples. In case of contamination, blood should be blotted off the target organ before embedding it in OCT media.
-
8.
Samples with hair are often unsuitable for LCM because of compromised cryosectioning and laser dissection.
-
9.
Cross contamination of samples compromises molecular profiling especially when the traces of RNA-rich organ are accidentally introduced in the sample with low RNA content.
-
10.
To facilitate mounting of OCT embedded tissue on a slide and provide flexibility for block trimming and facing, the tissue should be positioned in the middle of the cryomold with the thin layer of OCT on the bottom of the mold. Put the mold on slurry and immediately fill it with OCT, avoiding bubbles.
-
11.
We routinely start sectioning for LCM experiments within 2 weeks of sample collection. However, in our experience RNA quality in properly collected, embedded and stored OCT blocks of mouse tissue remains the same up to 4 years from the time of necropsy.
-
12.
Knowledge of initial RNA quality in the tissue is necessary for the evaluation and troubleshooting of sample collection and LCM workflow. Samples of low RNA quality should be excluded from the sample set, or grouped with the other samples of similar quality to avoid biased results in downstream analysis.
-
13.
Thirty minutes of OCT block equilibration to cryostat temperature is crucial for the morphological quality of the section.
-
14.
When cutting extra sections from the block in the second step, discard the first 20 μm from the face of the block because the surface layer of tissue exposed to the atmosphere usually has degraded RNA and sub-optimal morphology.
-
15.
Since sectioning in the second step is based on the H&E reference slide, the block can be trimmed in a way that facilitates acquisition of multiple sections on the slide (Fig. 2). This approach allows timely collection of a sufficient number of LCM targets on IsolationCap without refocusing the laser.
-
16.
Storing slides for one sample in several Five-Slide Mailers, versus the 25 or 50 slot slide box, allows handling five slides at a time during LCM session and keeping the rest of the slides at constant −80 °C temperature for preservation of RNA integrity. The prepared LCM slides were stored for 2 weeks prior to LCM.
-
17.
We use a modified manual staining protocol for LCM reference sections: air drying -10 min, 10% neutral buffered formalin -10 min, tap water-5 min, dH2O-1 min, Hematoxylin-2-2 min (filtered), tap water-10 min,70% ethanol-1 min, 95% ethanol-1 min, eosin Y-10 s, 100% ethanol-1 min (four changes), xylene-3 min (three changes). If an autostainer is used for H&E stain, after fixation load the slides on the stainer in distilled water and start from hematoxylin step.
-
18.
Drying in a desiccator improves laser focusing. Slides with sections of primary tumors, lung metastasis and normal mammary gland and lungs did not show any sign of RNA degradation during the 5-h storage in a desiccator prior to dissection [15].
-
19.
We carried all the dissections with laser speed at 37%, laser focus at 78% and laser power at 41%.
-
20.
We prefer to load three serial slides simultaneously, and dissect the targets sequentially from all slides with the same IsolationCap in a 30-min time period. The speed of dissection can be estimated in a pilot study using a test slide.
-
21.
Forceps method works well for the cutouts of 200 μm or larger. Smaller targets should be collected with 0.2 ml IsolationCap. Dislodge smaller cutouts from the cap by the following procedure: (a) dispense 2 μl of 100% ethanol in the lid of the PCR tube, (b) bring the cutouts on the IsolationCap in contact with the drop of ethanol, (c) observe the IsolationCap under a dissection microscope to make sure that all cutouts were dislodged, (d) close the lid of the PCR tube, centrifuge at 16,000 × g for 15 s, then keep the tube on ice, (e) add more dissected targets to the tube in the same manner, (f) at the completion of dissection, evaporate ethanol, add 5 μl of lysis buffer into the tube, and continue with the lysis procedure.
-
22.
Accumulation of dissected targets for 2.5 h in lysis buffer on wet ice did not cause degradation of RNA in any of our samples (Fig. 4). Longer times have not been tested.
-
23.
Small cutouts often obstruct the pipette tip during pipetting, causing variability among input volumes in the NanoString hybridization reaction. Our filtering technique eliminates this problem. Barrier tips for PT-200 pipettes can be used in the same way with 0.5 ml centrifuge tubes.
-
24.
Four-week storage of RNA lysates at −80 °C prior to NanoString analysis and 1 week storage of RNA purified from the whole tissue samples for microarray analysis is acceptable; we observed high concordance of genes selected for the study of spontaneous carcinoma model between the platforms [15].
-
25.
LCM material should be collected and extracted with the minimal elution volume recommended by the manufacturer to measure RNA concentration by NanoDrop. Measurements starting from 20 ng/μl can be reliably used for the estimation of RNA content in LCM targets of the same sample set.
-
26.
It is impossible to obtain uniform (by RNA concentration) LCM samples due to variability during RNA extraction; the average of three technical replicates of RNA content per mm2 can differ by 30–40%. However, such a range among the samples is accounted for by the normalization algorithm of the NanoString platform [13].
-
27.
On some occasions, the dissected annotated target area may be larger than required to obtain 100 ng of RNA. In these cases, increase the default volume of lysis buffer (5 μl) proportionally to the size of the dissected area calculated by MMI Cell Cut Plus Software prior to sample incubation and cutouts removal. Monitor the sum of dissected areas in MMI software during LCM of serial sections. If possible, collect more material then needed because it is easier to work with volumes larger than 5 μl during lysis and following the removal of cutout membranes from the tubes. We prefer adding on average, two to four extra sections to the estimated number. The excess of RNA lysate can be used for other types of analysis.
-
28.
We selected 103 mRNA genes and controls classified as embryonic stem cell (ESC), epithelial–mesenchymal transition (EMT), and mesenchymal—epithelial transition (MET) markers based on published data [15].
-
29.
All the LCM samples in our study satisfied imaging quality control metrics for nCounter data analysis (Fig. 5).
Fig. 5 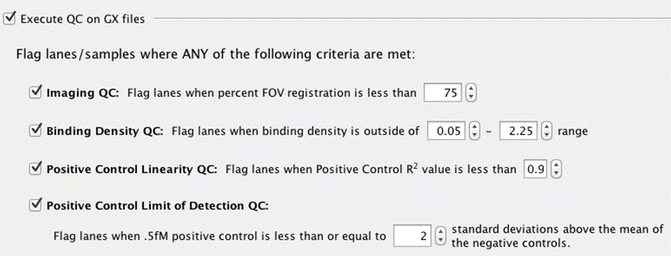
nSolver QC parameters. The table represents numerical parameters used in this study to access LCM samples quality control for NanoString gene profiling (reproduced from Open Access ref. 15)
-
30.
An ANOVA test conducted between LCM samples of epithelial-like cells (6 carcinoma samples) and spindle-like (8 EMT samples) cells identified 17 differentially expressed genes (fold change 1.5 and p-value <0.05) [15].
-
31.
The unsupervised hierarchical clustering was based on the expression pattern of epithelial-like cell gene sets and spindle-like gene sets. The clustering reveled two main branches , segregating the samples into distinct groups (Fig. 6); overexpression of Klf4, Wt1 and Msi1 was observed in the EMT (spindle-like areas), whereas overexpression of the Epcam, T, Foxc2, and CD24a was observed in carcinoma areas [15].
Fig. 6 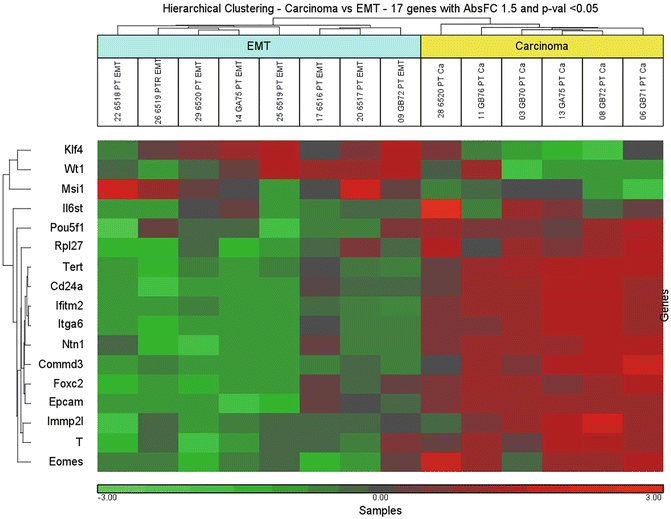
Unsupervised hierarchical clustering of carcinoma versus EMT. Scaled down representation of the entire cluster is based on 17 genes differentially expressed between carcinoma (epithelial-like areas) and EMT (spindle-like areas). Each row represents a single gene and each column represents a sample. Red color indicates upregulation, green color—downregulation, and black color—no change in expression level, compared with the reference sample. EMT: Epithelial–Mesenchymal transition (reproduced from Open Access ref. 15)


References
Wulfkuhle JD, Speer R, Pierobon M et al (2008) Multiplexed cell signaling analysis of human breast cancer applications for personalized therapy. J Proteome Res 7:1508–1517
Melis M, Diaz G, Kleiner DE et al (2014) Viral expression and molecular profiling in liver tissue versus microdissected hepatocytes in hepatitis B virus–associated hepatocellular carcinoma. J Transl Med 12:230
Nakazono M, Qiu F, Borsuk LA et al (2003) Laser–capture microdissection, a tool for the global analysis of gene expression in specific plant cell types: identification of genes expressed differentially in epidermal cells or vascular tissues of maize. Plant Cell 15:583–596
Espina V, Wulfkuhle JD, Calvert VS et al (2006) Laser–capture microdissection. Nat Protoc 1:586–603
Ma XJ, Dahiya S, Richardson EA et al (2009) Gene expression pro fi ling of tumor microenvironment during breast cancer progression. Breast Cancer Res 11:R7
Emmert-Buck MR, Bonner RF, Smith PD et al (1996) Laser capture microdissection. Science 274:998–1001
Erickson HS, Albert PS, Gillespie JW et al (2009) Quantitative RT–PCR gene expression analysis of laser microdissected tissue samples. Nat Protoc 4:902–922
Murray GI (2007) An overview of laser microdissection technologies. Acta Histochem 109:171–176
Baldelli E, Haura EB, Crino L et al (2015) Impact of upfront cellular enrichment by laser capture microdissection on protein and phosphoprotein drug target signaling activation measurements in human lung cancer: Implications for personalized medicine. Proteomics Clin Appl 9(9–10):928–937
Jacquet R, Hillyer J, Landis WJ (2005) Analysis of connective tissues by laser capture microdissection and reverse transcriptase–polymerase chain reaction. Anal Biochem 337:22–34
Golubeva Y, Rogers K (2009) Collection and preparation of rodent tissue samples for histopathological and molecular studies in carcinogenesis. Methods Mol Biol 511:3–60
Castro NP, Fedorova-Abrams ND, Merchant AS et al (2015) Cripto-1 as a novel therapeutic target for triple negative breast cancer. Oncotarget 6:11910–11929
NanoString Technologies (2009) NanoString technical note: sample flexibility for gene expression analysis with the nCounter™ analysis system; in v.20091113. NanoString Technologies, Seattle, WA
Geiss GK, Bumgarner RE, Birditt B et al (2008) Direct multiplexed measurement of gene expression with color-coded probe pairs. Nat Biotechnol 26:317–325
Castro NP, Merchant AS, Sayler K et al (2016) Adaptation of laser microdissection technique for the study of a spontaneous metastatic mammary carcinoma mouse model by nanostring technologies. PLoS One 11(4):e0153270. https://doi.org/10.1371/journal.pone.0153270
Imbeaud S, Graudens E, Boulanger V et al (2005) Towards standardization of RNA quality assessment using user-independent classifiers of microcapillary electrophoresis traces. Nucleic Acids Res 33(6):e56
Ross J (1995) mRNA stability in mammalian cells. Microbiol Rev 59:423–450
Kabnick KS, Housman DE (1998) Determinants that contribute to cytoplasmic stability of human c–fos and beta–globin mRNAs are located at several sites in each RNA. Mol Cell Biol 8:8–13
Institute of Laboratory Animal Resources CoLS, National Research Council (1996) Guide for the care and use of laboratory animals. National Academy Press, Washington, D.C., p 125
Acknowledgments
This Research was supported (in part) by the Intramural Research Program of the NIH, National Cancer Institute, Center for Cancer Research. This project has been funded in whole or in part with federal funds from the National Cancer Institute, National Institutes of Health, under Contract No. HHSN261200800001E. The content of this publication does not necessarily reflect the views or policies of the Department of Health and Human Services, nor does mention of trade names, commercial products, or organizations imply endorsement by the U.S. Government.
Author information
Authors and Affiliations
Corresponding author
Editor information
Editors and Affiliations
Rights and permissions
Copyright information
© 2018 Springer Science+Business Media, LLC
About this protocol

Cite this protocol
Castro, N.P., Golubeva, Y.G. (2018). Adaptation of Laser Microdissection Technique to Nanostring RNA Analysis in the Study of a Spontaneous Metastatic Mammary Carcinoma Mouse Model. In: Murray, G. (eds) Laser Capture Microdissection. Methods in Molecular Biology, vol 1723. Humana Press, New York, NY. https://doi.org/10.1007/978-1-4939-7558-7_6
Download citation
DOI: https://doi.org/10.1007/978-1-4939-7558-7_6
Published:
Publisher Name: Humana Press, New York, NY
Print ISBN: 978-1-4939-7557-0
Online ISBN: 978-1-4939-7558-7
eBook Packages: Springer Protocols