
Abstract
Although mutations of the dystrophin gene are the causative defect in Duchenne muscular dystrophy (DMD) patients, secondary disease processes such as inflammation contribute greatly to the pathogenesis of DMD. Genetic and histological studies have shown that distinct facets of the immune system promote muscle degeneration or regeneration during muscular dystrophy through mechanisms that are only beginning to be defined. Although histological methods have allowed the enumeration and localization of immune cells within dystrophic muscle, they are limited in their ability to assess the full spectrum of phenotypic states of an immune cell population and its functional characteristics. This chapter highlights flow cytometry methods for the isolation and functional study of immune cell populations from muscle of the mdx mouse model of DMD. We include a detailed description of preparing single-cell suspensions of dystrophic muscle that maintain the integrity of cell-surface markers used to identify macrophages, eosinophils, group 2 innate lymphoid cells, and regulatory T cells. This method complements the battery of histological assays that are currently used to study the role of inflammation in muscular dystrophy, and provides a platform capable of being integrated with multiple downstream methodologies for the mechanistic study of immunity in muscle degenerative diseases.
The original version of this chapter was revised. An erratum to this chapter can be found at https://doi.org/10.1007/978-1-4939-7374-3_20
Key words
- Muscular dystrophy
- mdx
- Flow cytometry
- FACS
- Muscle inflammation
- Tregs
- ILC2
- Macrophages
- Eosinophils
- Immune system
- Inflammatory cells
1 Introduction
Duchenne muscular dystrophy (DMD) is an X-linked recessive muscle disorder caused by mutation of the dystrophin gene [1, 2]. The absence of dystrophin protein leads to contraction-induced injury [3], which triggers an inflammatory response that contributes to the progression and severity of muscular dystrophy [4]. Although patients are asymptomatic during the first 3–5 years of life, first clinical symptoms arise shortly thereafter and progressively worsen with age, leading to loss of ambulation by adolescence and death by the second to third decade. No cure exists for DMD and therapy is largely limited to corticosteroids that broadly suppress immunity, provide only a short delay in disease progression and are associated with side effects such as behavioral changes, weight gain, Cushingoid appearance, osteoporosis, and gastrointestinal side effects [5, 6]. The broad immunosuppressive function of glucocorticoids raises further concern, because of their potential to silence inflammatory responses that are required for muscle regeneration. While it is imperative that a cure is discovered for DMD, it is equally important to design treatments that suppress inflammatory responses that exacerbate muscle degeneration, but spare those that promote regeneration. Thus, defining the mechanisms that regulate the balance between muscle degenerative and pro-regenerative inflammatory responses , may lead to the development of novel therapies for muscular dystrophy that may be utilized as stand-alone treatments or in combination with future gene corrective therapies.
The mdx mouse model of DMD is a dystrophin null mutant mouse that shares many of the secondary disease processes present in human, including immune-mediated exacerbation of muscle injury [7, 8]. The power of mouse genetics and relative ease of manipulating immune cells in mice makes the mdx mouse an ideal animal model useful for investigating the cellular and molecular underpinnings of the immune system ’s role in DMD. Histological studies aimed at characterizing the immune cells present in dystrophic muscle have shown that CD4+ and CD8+ T cell, macrophage, mast cell, neutrophil and eosinophil numbers are elevated in mdx mice. The pathogenic role for immune cells in muscular dystrophy is supported by studies showing that depletion of many of these immune cell subsets decreases myofiber injury by 60–80% in mdx mice [9, 10]. The elevated number of leukocytes and increased expression of immune-function genes in human dystrophic muscle also supports a role for the immune system in the pathogenesis of muscular dystrophy in humans [11,12,13]. Furthermore, immune cells, like T cells, pose an obstacle that limits the efficacy of dystrophin corrective therapies currently under development, by inadvertently recognizing the dystrophin protein product as a foreign protein, targeting it for elimination. This growing concern is supported by recent studies by Mendell and colleagues, which showed that a substantial fraction of DMD patients harbor circulating dystrophin-reactive T cells before and after gene therapy [14, 15]. The DMD clinical and research community is confronted by the challenge of curbing the pathogenic inflammatory responses of DMD, as well as addressing the potential lack of immunological tolerance to dystrophin protein that is restored by gene corrective therapies.
Although some aspects of the immune system promote the pathogenesis of muscular dystrophy, the inflammatory response to injury is also critical in mediating muscle repair [16]. The duality of the immune system in muscle injury and repair can be partly explained by the coordinated recruitment of distinct immune cell subsets to injured muscle that cause further injury or promote regeneration . Alternatively, specific immune cell populations may acquire distinct states of activation that exist as a broad continuum in which cells transition from one state of activation to another in accordance with changes in the inflammatory environment of injured muscle [17, 18]. This process is best exemplified by pro-inflammatory (M1) and anti-inflammatory (M2) macrophages in muscle that are known to promote either injury or regeneration, respectively, during acute muscle injury and muscular dystrophy [17, 19]. Pro-inflammatory cytokines such as IFNγ, TNFα, and IL-1β promote the classical activation of M1 macrophages [20] that induce myofiber injury through an iNOS-dependent mechanism [19]. In contrast, cytokines such IL-4 and IL-13 induce M2 activation of macrophages [21], which are thought to antagonize the action of M1 macrophages via arginase-dependent mechanisms [19]. Regulatory cytokines like IL-10 deactivate M1 macrophages, but also induces a unique transcriptional program that shares a minimal overlap with M2 macrophages [22, 23]. The cell types in dystrophic muscle that orchestrate these changes in the inflamed environment or alter macrophages activation were largely unknown until recent studies showed that regulatory T cells (Tregs) are elevated in human and mouse dystrophic muscle and regulate the balance between M1 and M2 muscle macrophages [24].
Given the central role of Tregs in regulating peripheral immunological tolerance and the suppression of immunity, Tregs are prime candidate immune cells that have the functional capacity to regulate macrophage activation and resolve muscle inflammation [25, 26]. Treg development and function is highly dependent on forkhead box P3 (FoxP3), a transcription factor critical for the specification of this suppressive CD4+ T cell lineage [27, 28]. Tregs are a heterogeneous and acquire unique functional states adapted to the tissue they reside in [26]. In addition to expressing CD25, CTLA-4, GITR, and helios, muscle Tregs express exceptionally high levels of ST2, PD-1, and amphiregulin [29]. Moreover, muscle Tregs in dystrophic muscle express high levels of IL-10, a regulatory cytokine known to suppress muscle inflammation and M1 activation of muscle macrophages in mdx mice [24, 30]. Indeed, loss- or gain-of-function studies performed in mdx mice showed that Tregs exacerbated and ameliorated the severity of muscular dystrophy, respectively [24]. These studies showed that depletion of muscle Tregs during acute injury or muscular dystrophy shifted the balance between M1 and M2 activation in favor of M2 macrophages. It is important to note that Tregs are not the only immune cell population with the capacity to regulate macrophage activation. Additional immune cell populations that may regulate macrophage activation include, but are not limited to, effector T helper cells (i.e., Th1 and Th2 cells), eosinophils, and group 2 innate lymphoid cells.
Future research will be directed at mechanistically defining how distinct immune cell populations regulate muscle inflammation during muscular dystrophy, as well as assessing their therapeutic potential in this disease setting. The complexity and heterogeneous nature of immune cells such as Tregs and macrophages precludes the use of conventional histological methods, which are largely limited to their ability to analyze two to four markers at a time. Moreover, specialized subsets of immune cells that possess profound biological function in low numbers (i.e., Tregs) are subject to sampling bias with conventional histological methods. To prevent these sampling biases, a large number of sections collected at different planes along the length of a muscle would be required to accurately quantify the absolute number of immune cells , thus leading to costly increases in time and resources. Although we do not propose that histological assays are obsolete, we argue that they are complemented by the use of flow cytometry methods that enable the simultaneous analysis of multiple parameters (8 or greater) to study complex immune cell populations. This methodology will allow investigators to rigorously define the phenotypic characteristics of diverse immune cell populations present in dystrophic muscle, and study their functional complexity. Herein, we describe methods for the efficient isolation of immune cells from mdx muscle and their characterization using flow cytometry. We provide examples of antibody panels useful for identifying and studying immune cell populations in the skeletal muscle of mdx mice . Importantly, the methods described here are amenable to modifications that lead to optimization for user-specific needs and/or other downstream applications.
2 Materials
2.1 Preparation of Digestion Media
-
1.
Collagenase P (Roche, Sigma, 11213873001) stored at −20 °C (see Note 1 ).
-
2.
DNase I (Roche, Sigma, 10104159001) 20 mg/mL (1000×) in 20% glycerol/H2O (v/v). Store 200 μl aliquots at −80 °C.
-
3.
DMEM base media: High glucose DMEM supplemented with GlutaMAX and Na-pyruvate (Gibco, Thermofisher, 10569044) plus 1× Penicillin–Streptomycin–l-Glutamine (Corning, 30-009-Cl).
2.2 Whole Body Perfusion of Mice
-
1.
Carbon dioxide (CO2) with flow regulator (VWR Scientific, 55850-215).
-
2.
25 gauge (G) needles.
-
3.
60 ml syringes.
-
4.
70% ETOH.
-
5.
1× PBS: 10× PBS prepared in MilliQ water supplemented with 0.9 mM CaCl, 0.49 mM MgCl and 0.27 mM KCl.
2.3 Preparation of Single-Cell Suspensions from mdx Skeletal Muscle for Flow Cytometry Analysis
-
1.
10 cm polystyrene dish.
-
2.
Razor blades.
-
3.
Water bath.
-
4.
37 °C incubator.
-
5.
Benchtop rocker (Benchmark, BR2000).
-
6.
15 ml conical tubes.
-
7.
50 ml conical tubes.
-
8.
70 μm cell strainer.
-
9.
40 μm cell strainer.
-
10.
1× PBS: 10× prepared in MilliQ water supplemented with 0.9 mM CaCl, 0.49 mM MgCl, and 0.27 mM KCl.
-
11.
DMEM wash media: 2% bovine serum albumin [FBS] in DMEM base media.
-
12.
Histopaque-1077 (Sigma, H8889) (see Note 1 ).
2.4 Staining of mdx Skeletal Muscle Cells for Flow Cytometry Analysis
-
1.
Zombie NIR Fixable Viability Kit (Biolegend, 423105) diluted 1:1000 in 1× PBS.
-
2.
FACS buffer: 1% bovine serum albumin in 1× PBS.
-
3.
Fc-receptor blocking reagent (Fc-block): αCD16/32 (Clone 93, Biolegend, 101302) 1:50 in FACS buffer.
-
4.
U-bottom polystyrene 96 well plate.
-
5.
Autoclaved 65 μm nylon filter.
-
6.
Transcription factor staining buffer kit (eBioscience, 00-5523-00).
-
7.
FACS tubes: 5 ml round bottom polysterene tubes.
2.5 Surface and Intracellular Antibodies
2.6 Analysis of Single-Cell Muscle Suspensions by Flow Cytometry
-
1.
BD FACSAria Fusion with the following lasers: 405, 488, 561, and 640 nm.
-
2.
FlowJo.
3 Methods
3.1 Preparation of Digestion Media
-
1.
While avoiding repeat freeze–thaw cycles, DNAse I is thawed on ice and digestion media is prepared by combining Collagenase P (0.2 mg/ml) and DNase I (0.02 mg/ml) in chilled DMEM base media. Digestion media should be used soon after preparation. Thus, we recommend that it is prepared after step 3 in Subheading 3.3.
-
2.
Store the digestion media immediately on ice to preserve enzymatic activity.
3.2 Euthanasia and Whole Body Perfusion of Mice
-
1.
Mice are euthanized with carbon dioxide using a gradual fill method per American Veterinary Medical Association guidelines. This is achieved by using a CO2 tank with a flow meter allowing for a displacement rate from 10% to 30% of the chamber volume per minute. Euthanasia of mice is determined by the lack of response to toe and/or tail pinch. Mice are then immediately perfused and processed to prevent coagulation of blood in the microvasculature, which will impede the perfusion of skeletal muscle.
-
2.
The euthanized mouse is washed with 70% ETOH and rinsed with water. A midline incision is made with blunt scissors, exposing the intraperitoneal cavity. A small incision in made through the diaphragm, and extended along the entire rib cage to expose the plural cavity. To provide ample access to the ventricles of the heart, a sternal-lateral incision is made, allowing the rib cage to be pinned back with a 25 G needle (see Note 2 ).
-
3.
Once the left ventricle of the heart is optimally exposed, the inferior vena cava caudal to the heart is severed. Whole-body perfusion is performed by injecting 30 ml of 1× PBS into the left ventricle using a 25 G needle (see Fig. 1a).
Fig. 1 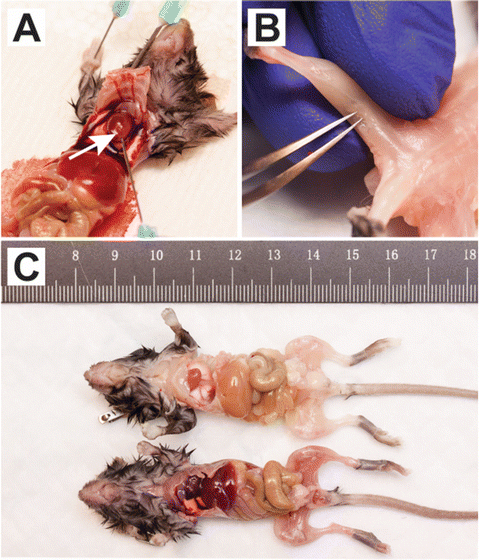
Perfusion and removal of mouse popliteal lymph node. (a) For clarity, an anterior view of a 4-week-old mdx mouse with partial rib cage removal is shown. Cardiac perfusion through the left ventricle (white arrow) is performed with 1× PBS. (b) A poster view of the hind limb of a perfused mouse, showing the removal of the popliteal lymph node with fine-tip forceps. (c) Representative mice before (bottom) and after perfusion (top) are shown
-
4.
The perfused mouse is rinsed with tap water, followed by 1× PBS to remove any residual blood or clots that may remain (see Fig. 1c).

3.3 Preparation of a Single-Cell Suspension from mdx Hind Limb Muscle for FACS Analysis
-
1.
Following perfusion, avulse the skin from the hind limbs. The popliteal lymph node, located posterior to the tibiofemoral joint (see Fig. 1b) is removed to avoid contamination of the muscle single cell suspension with non-muscle resident immune cells .
-
2.
Hind limb muscles are dissected, taking special care not to sever the bones of the hind limbs, which could further lead to contamination. Excess fat (which contains resident immune cells), connective tissue and the sciatic nerve are removed from the skeletal muscle.
-
3.
Dissected muscles are placed in a pre-weighed petri dish containing 1 ml of DMEM base media and then weighed to determine the mass of muscle obtained.
-
4.
Muscle is minced to a homogeneous consistency that allows the tissue to flow through the tip of a 25 ml serological pipette. Over-mincing the muscle may result in over-digestion and reduce the viability of the liberated muscle cells.
-
5.
The minced tissue is transferred to a 15 or 50 ml conical tube depending on the amount of muscle obtained per mouse. Sufficient void volume should be maintained to allow efficient movement of the suspension when the samples are rocked at 37 °C (step 6).
-
6.
Prepare digestion media (see Subheading 3.1) and transfer (10 ml/g of muscle) into the conical tube containing the minced muscle (see Note 3 ). To warm the digestion media, the suspension is pre-incubated in a 37 °C water bath for 5 min, then transferred to a 37 °C degree incubator for 30 min. Tubes are agitated throughout the 30-min digestion period on a Benchmark 2D rocker set at a speed that prevents muscle tissue from becoming stagnant (30 RPM with a 30° tilt angle).
-
7.
Following the first round of digestion, the muscle suspension is triturated by pipetting the suspension through a 10 ml serological pipette, aiding in the liberation of single cells. The muscle suspension is allowed to settle for 30 s to enable the undigested muscle to collect at the bottom of the tube (see Note 4 ).
-
8.
The suspension of liberated cells is transferred to a new 50 ml conical tube. 5 ml of DMEM wash media is added to the tube and raised to a final volume of 50 ml with 1× PBS.
-
9.
The suspension is pelleted by centrifugation (870 × g for 2 min), decanted and resuspended in 5 ml of DMEM wash media and 20 ml of 1× PBS then stored on ice.
-
10.
The remaining undigested muscle is processed through another round of digestion as described above in steps 6 and 7 (see Note 5 ).
-
11.
The muscle suspension from the second digestion is pooled with the first-round muscle suspension. The combined suspensions are pelleted by centrifugation (870 × g for 2 min), resuspended in 5 ml of DMEM wash media and brought to a final volume of 50 ml with 1× PBS. The combined muscle cell suspension is then filtered through a 70 μm cell strainer.
-
12.
After filtration, the combined muscle suspension is centrifuged (870 × g for 2 min), resuspended in 5 ml DMEM wash media and raised to a final volume of 50 ml with 1× PBS. A second round of filtration is conducted by passing the combined suspension through a 40 μm filter.
-
13.
The filtered muscle suspension is pelleted by centrifugation (870 × g for 2 min), raised with 5 ml of room temperature DMEM wash media and transferred to a fresh 15 ml conical tube.
-
14.
Undigested muscle, tissue debris and dead cells are removed from the combined muscle suspension using gradient centrifugation. The filtered muscle suspension is floated over an equal volume (5 ml) of room temperature Histopaque-1077 that is gently delivered to bottom of the cell suspension using a 5 ml serological pipette (see Note 6 ).
-
15.
The prepared gradient is spun at 315 × g for 30 min at room temperature. Disable the brake on the centrifuge to prevent turbulence of the sample while the spin comes to a complete stop.
-
16.
Following centrifugation, cells at the interface between the DMEM wash media and the Hisotapque-1077 are carefully removed using a P1000 pipette and transferred to a new 15 ml conical tube. This single cell suspension is raised to 15 ml with 1× PBS, centrifuged (870 × g for 2 min) and resuspended with 1 ml of 1× PBS. The single cell suspension is now ready for counting and staining.
3.4 Cell Surface Staining of mdx Skeletal Muscle Single Cells for Flow Cytometry Analysis
-
1.
To discriminate between live and dead cells, cells are resuspended in 100 μl of Zombie NIR viability dye (1:1000 in 1× PBS) for 30 min on ice while protected from light. Residual protein that could interfere with the Zombie staining, such as FBS, is sufficiently removed from the single cell suspension by washing with 1× PBS prior to staining.
-
2.
Cells are washed three times with FACS buffer, and are blocked in 50 μl of Fc-block for a minimum of 15 min while on ice protected from light.
-
3.
A 2× antibody cocktail for cell surface markers is prepared in FACS buffer using a dilution that is two times more concentrated then the dilutions listed in Tables 1 and 2. The staining of cells is performed in a 96-well plate where 50 μl of cells in Fc-block are combined with 50 μl of 2× antibody cocktail, resulting in a 100 μl staining volume and a final antibody cocktail concentration of 1×. Staining is performed for 30 min on ice protected from light.
-
4.
The 96-well plate is centrifuged (870 × g for 2 min), cell pellets are resuspended with 200 μl of FACS buffer, and repeated for a total of three washes.
-
5.
After the third wash, cells are resuspended in 200 μl of FACS buffer and filtered through a 60 μm nylon mesh into a 5 ml FACS tube. The volume is raised to 500 μl with FACS buffer.
-
6.
Cells are ready for flow cytometry analysis as described in Subheading 3.6 (see Note 7 ). If intracellular staining is being performed, then continue to Subheading 3.5.
3.5 Intracellular Staining of mdx Skeletal Muscle Single Cells
The transcription factor staining buffer kit (eBioscience) is used for the fixation, permeabilization, and staining of intracellular proteins using the following procedure:
-
1.
After Subheading 3.4, step 4, the 96-well plate is centrifuged (870 × g for 2 min) and cell pellets are resuspended in 100 μl of fixation/permeabilization working solution and incubated for 30 min on ice protected from light (see Note 8 ).
-
2.
The 96-well plate is centrifuged (870 × g for 2 min), and cells are washed a total of three times using 200 μl of 1× permeabilization buffer per well (see Note 9 ).
-
3.
Cells are resuspended in 100 μl of intracellular antibody staining solution (i.e., PE-conjugated, α-FoxP3 antibody diluted 1:100 in 1× permeabilization buffer). Staining is performed on ice for 30 min in the dark.
-
4.
Stained cells are washed a total of three times with 1× permeabilization buffer (200 μl/well).
-
5.
After the third wash, cells are resuspended in FACS buffer, filtered, and analyzed by flow cytometry .
3.6 Acquisition and Analysis of Stained mdx Muscle Using Flow Cytometry
-
1.
Samples are analyzed using a BD FACS Aria Fusion, equipped with a 70 μm nozzle and yellow-green (561 nm) laser . We have found that cytometers equipped with a yellow-green laser are necessary for optimal excitation and detection of PE and PE-Cy7-conjuted antibodies used above. Additional gating strategies are suggested in Figs. 2 and 3.
Fig. 2 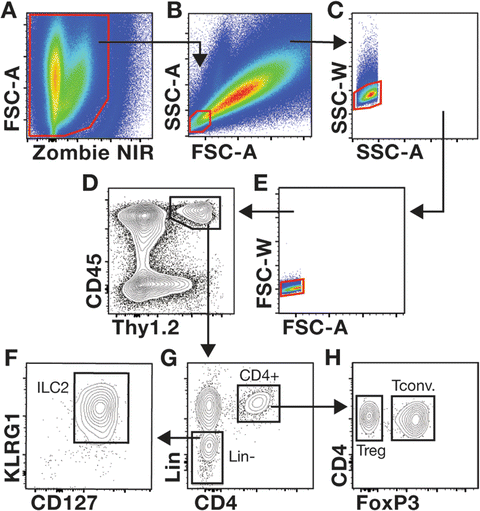
Gating strategies used to evaluate mdx skeletal muscle T cells and ILC2s. (a–h) The gating strategy used to interrogate Tregs and ILC2s in muscle is shown. The representative muscle single-cell suspension was prepared from a 4-week-old mdx mouse stained with the cocktail of antibodies described in Table 1. Samples are first gated on live cells (a, Zombie NIR negative cells) followed by gating on the SSC-AloFSC-Alo population, which contains lymphocytes (b). Discrimination of non-single cells (i.e., doublets and clumped cells) is accomplished by comparing the voltage pulse and pulse area for the SSC (c) and FSC parameters (e). Gating on CD45+Thy1+ cells defines lymphocytes within muscle (d). Gating of CD4+ and linage negative (Lin−) cells among CD45+Thy1+ cells is shown (g). ILC2s are further interrogated by examining the expression of KLRG1 and CD127 expression in Lin− cells (f). The gating of FoxP3− Tconv and FoxP3+ Tregs among CD4+ T cells is shown (h)
Fig. 3 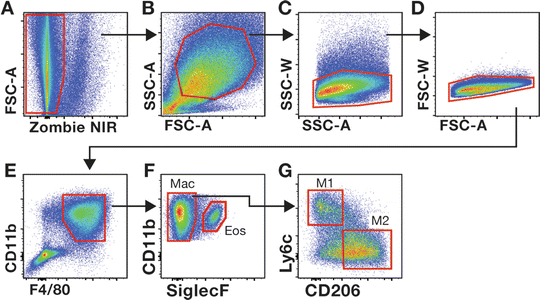
Gating strategies used to evaluate mdx skeletal muscle macrophages. Gating on viable (a), SSC-AhiFSC-Ahi (b) single cells (c, d) allows for the interrogation of CD11b+F4/80+ myeloid cells (e). Siglec F permits the discrimination between eosinophils (Eos) and macrophages (Mac) (f). The frequency of pro inflammatory (M1) and anti-inflammatory (M2) macrophages among total muscle macrophages (CD11b+F4/80+SiglecF−) is determined by the expression of Ly6c and CD206, respectively. (g). The gate for M2 macrophages was determined by comparing cells stained with the cocktail of antibodies listed in Table 2 to fluorescence minus one (FMO) control cells in which the CD206 antibody was omitted from the antibody cocktail (data not shown)
-
2.
To ensure proper acquisition of the cell populations of interest, voltage settings and area scaling should be adjusted to allow the visualization of the entire cell population in the muscle sample when SSC-A is plotted against FSC-A (see Figs. 2 and 3).
-
3.
With appropriate acquisition settings, lymphocytes are SSC-AloFSC-Alo cells (see Fig. 2b) whereas macrophages are larger cells that resided in the SSC-AhiFSC-Ahi region of the plot (see Fig. 3b).


4 Notes
-
1.
Collagenase P and Histopaque-1077 are equilibrated to room temperature before use.
-
2.
To ensure an optimal perfusion, use blunt-tipped scissors and non-serrated forceps during the dissection to avoid lacerations to the organs.
-
3.
The volume of digestion media should include a sufficient quantity needed for 10 ml per gram of muscle for two rounds of digestion, plus an extra 2 ml to account for any loss of volume during preparation and use.
-
4.
Following the first digestion, but prior to trituration and processing (steps 7 and 8) the digestion media should be pre-warmed in a 37 °C water bath.
-
5.
The second round of digestion does not require a 5 min pre-incubation in a 37 °C water bath as the digestion media was pre-warmed.
-
6.
It is important that the Histopaque-1077 is delivered without causing mixing of the muscle cell suspension with the Histopaque-1077, thus allowing the formation of a sharp interface between the muscle suspension and the Histopaque-1077. This practice optimizes the separation of live single cells.
-
7.
All stained samples should be stored on ice protected from light when not being analyzed to maintain the integrity of antibody fluorescence.
-
8.
Prepare fresh fixation/permeabilization working solution by combining 1 part fixation/permeabilization concentrate to three parts fixation/permeabilization diluent.
-
9.
1× permeabilization buffer is prepared by diluting 1 part 10× permeabilization buffer with nine parts distilled water.
References
Hoffman EP, Brown RHJ, Kunkel LM (1987) Dystrophin: the protein product of the Duchenne muscular dystrophy locus. Cell 51:919–928
Koenig M et al (1987) Complete cloning of the Duchenne muscular dystrophy (DMD) cDNA and preliminary genomic organization of the DMD gene in normal and affected individuals. Cell 50:509–517
Petrof BJ, Shrager JB, Stedman HH, Kelly AM, Sweeney HL (1993) Dystrophin protects the sarcolemma from stresses developed during muscle contraction. Proc Natl Acad Sci U S A 90:3710–3714
Rosenberg AS et al (2015) Immune-mediated pathology in Duchenne muscular dystrophy. Sci Transl Med 7:299rv4
Manzur AY, Kuntzer T, Pike M, Swan A (2008) Glucocorticoid corticosteroids for Duchenne muscular dystrophy. Cochrane Database Syst Rev CD003725
Merlini L et al (2003) Early prednisone treatment in Duchenne muscular dystrophy. Muscle Nerve 27:222–227
Bulfield G, Siller WG, Wight PA, Moore KJ (1984) X chromosome-linked muscular dystrophy (mdx) in the mouse. Proc Natl Acad Sci U S A 81:1189–1192
Spencer MJ, Tidball JG (2001) Do immune cells promote the pathology of dystrophin-deficient myopathies? Neuromuscul Disord 11:556–564
Wehling M, Spencer MJ, Tidball JG (2001) A nitric oxide synthase transgene ameliorates muscular dystrophy in mdx mice. J Cell Biol 155:123–131
Spencer MJ, Montecino-Rodriguez E, Dorshkind K, Tidball JG (2001) Helper (CD4(+)) and cytotoxic (CD8(+)) T cells promote the pathology of dystrophin-deficient muscle. Clin Immunol 98:235–243
McDouall RM, Dunn MJ, Dubowitz V (1990) Nature of the mononuclear infiltrate and the mechanism of muscle damage in juvenile dermatomyositis and Duchenne muscular dystrophy. J Neurol Sci 99:199–217
Pescatori M et al (2007) Gene expression profiling in the early phases of DMD: a constant molecular signature characterizes DMD muscle from early postnatal life throughout disease progression. FASEB J 21:1210–1226
Haslett JN et al (2002) Gene expression comparison of biopsies from Duchenne muscular dystrophy (DMD) and normal skeletal muscle. Proc Natl Acad Sci U S A 99:15000–15005
Flanigan KM et al (2013) Anti-dystrophin T cell responses in duchenne muscular dystrophy: prevalence and a glucocorticoid treatment effect. Hum Gene Ther 24:797. doi:10.1089/hgtb.2013.092
Mendell JR et al (2010) Dystrophin immunity in Duchenne’s muscular dystrophy. N Engl J Med 363:1429–1437
Tidball JG (2005) Inflammatory processes in muscle injury and repair. Am J Physiol Regul Integr Comp Physiol 288:R345–R353
Arnold L et al (2007) Inflammatory monocytes recruited after skeletal muscle injury switch into antiinflammatory macrophages to support myogenesis. J Exp Med 204:1057–1069
Varga T et al (2016) Highly dynamic transcriptional signature of distinct macrophage subsets during sterile inflammation, resolution, and tissue repair. J Immunol 196:4771–4782
Villalta SA, Nguyen HX, Deng B, Gotoh T, Tidball JG (2009) Shifts in macrophage phenotypes and macrophage competition for arginine metabolism affect the severity of muscle pathology in muscular dystrophy. Hum Mol Genet 18:482–496
Mosser DM, Edwards JP (2008) Exploring the full spectrum of macrophage activation. Nat Rev Immunol 8:958–969
Gordon S (2003) Alternative activation of macrophages. Nat Rev Immunol 3:23–35
Mosser DM, Zhang X (2008) Interleukin-10: new perspectives on an old cytokine. Immunol Rev 226:205–218
Makita N, Hizukuri Y, Yamashiro K, Murakawa M, Hayashi Y (2015) IL-10 enhances the phenotype of M2 macrophages induced by IL-4 and confers the ability to increase eosinophil migration. Int Immunol 27:131–141
Villalta SA et al (2014) Regulatory T cells suppress muscle inflammation and injury in muscular dystrophy. Sci Transl Med 6:258ra142
Tang Q, Bluestone JA (2008) The Foxp3+ regulatory T cell: a jack of all trades, master of regulation. Nat Immunol 9:239–244
Panduro M, Benoist C, Mathis D (2016) Tissue tregs. Annu Rev Immunol 34:609–633
Fontenot JD, Gavin MA, Rudensky AY (2003) Foxp3 programs the development and function of CD4+CD25+ regulatory T cells. Nat Immunol 4:330–336
Hori S, Nomura T, Sakaguchi S (2003) Control of regulatory T cell development by the transcription factor Foxp3. Science 299:1057–1061
Burzyn D et al (2013) A special population of regulatory T cells potentiates muscle repair. Cell 155:1282–1295
Villalta SA et al (2011) Interleukin-10 reduces the pathology of mdx muscular dystrophy by deactivating M1 macrophages and modulating macrophage phenotype. Hum Mol Genet 20:790–805
Acknowledgements
We thank Chairut Vareechon for critical reviewing of this chapter, and for his insightful comments.
Author information
Authors and Affiliations
Corresponding author
Editor information
Editors and Affiliations
Rights and permissions
Copyright information
© 2018 Springer Science+Business Media LLC
About this protocol
Cite this protocol
Kastenschmidt, J.M., Avetyan, I., Villalta, S.A. (2018). Characterization of the Inflammatory Response in Dystrophic Muscle Using Flow Cytometry. In: Bernardini, C. (eds) Duchenne Muscular Dystrophy. Methods in Molecular Biology, vol 1687. Humana Press, New York, NY. https://doi.org/10.1007/978-1-4939-7374-3_4
Download citation
DOI: https://doi.org/10.1007/978-1-4939-7374-3_4
Published:
Publisher Name: Humana Press, New York, NY
Print ISBN: 978-1-4939-7373-6
Online ISBN: 978-1-4939-7374-3
eBook Packages: Springer Protocols