
Abstract
Fibrosis is the excessive accumulation of extracellular matrix components due to chronic injury, with collagens as predominant structural components. Liver fibrosis can progress to cirrhosis, which is characterized by a severe distortion of the delicate hepatic vascular architecture, the shunting of the blood supply away from hepatocytes and the resultant functional liver failure. Cirrhosis is associated with a highly increased morbidity and mortality and represents the major hard endpoint in clinical studies of chronic liver diseases. Moreover, cirrhosis is a strong cofactor of primary liver cancer. In vivo models are indispensable tools to study the cellular and molecular mechanisms of liver fibrosis and to develop specific antifibrotic therapies towards clinical translation. Here, we provide a detailed description of select optimized mouse models of liver fibrosis and state-of-the-art fibrosis readouts.
1 Introduction
Fibrosis is defined as excessive deposition of extracellular matrix (ECM) components resulting from a protracted wound-healing response. Fibrosis is the default response to continuing tissue injury and associated with most chronic inflammatory diseases. Advanced fibrosis leads to replacement of functional by scar tissue, a distortion of the normal vascular architecture and organ dysfunction or even demise. Moreover, advanced fibrosis is a predisposition for the development of cancers, especially in epithelial organs. Therefore fibrotic diseases are responsible for up to 45 % of overall mortality worldwide [1, 2]. Liver fibrosis and its advanced stage cirrhosis are characterized by vascular architectural distortion and liver dysfunction resulting from chronic liver injury [3]. Major etiologies of liver fibrosis and cirrhosis are chronic viral hepatitis B or C, toxic (e.g., alcoholic) liver disease, autoimmune and biliary diseases, e.g., primary biliary cirrhosis (PBC) and primary sclerosing cholangitis (PSC), and increasingly nonalcoholic steatohepatitis (NASH), which is linked to obesity, type 2 diabetes, and metabolic syndrome [2–5].
Notably, even advanced fibrosis is not considered any longer static and irreversible, but rather a dynamic process due to a dysbalance of fibrolysis (removal of excessive ECM) tilted in favor of enhanced ECM synthesis and deposition (fibrogenesis). Thus longterm suppression of the hepatitis B virus or elimination of the hepatitis C virus by effective antiviral therapies have shown that even (clinically still compensated) cirrhosis can reverse to a noncirrhotic liver over several years [6, 7]. Combined with the increasing understanding of the cellular and intercellular signaling underlying fibrogenesis or fibrolysis, a relevant focus of translational research is now aimed at (organ specific) antifibrotic therapies that do not only inhibit progression but also induce reversal of advanced fibrosis. Here not only the fibrogenic effector cells that produce the excess ECM (mainly activated myofibroblasts), but also injured epithelia, activated immune cells, and vascular cells, and their molecular specifics have become important pharmacological targets [1–5, 8]. In basic and translational research the use of rodent models of liver fibrosis has become indispensable. There exist more fibrosis models for liver than for other organs, and several of these mirror important facets of human pathology. Importantly, it appears that the fibrotic responses in humans can be replicated fairly well by a good selection of rodent (mainly mouse) models, and that differences of involved downstream effector cells (mainly myofibroblasts) and ECM molecules between species are less obvious than for example for immune cells and cyto/chemokines [2, 4, 5, 9, 10].
Here we present a selection of rodent liver fibrosis models that we optimized for mechanistic studies and especially for testing and validation of antifibrotic therapies, as an important step before clinical translation [8, 9]. Among a variety of rodent models [11] we prefer to use mouse models that incur much lower costs for maintenance and reagents, and that permit broad mechanistic studies due to the broad availability of transgenic animals. Here we describe Mdr2 (Abcb4, bile canalicular phospholipid flippase) knockout mice as a model of spontaneously progressive secondary biliary fibrosis [12, 13], and the refined models of toxin-induced parenchymal liver damage and fibrosis, induced by carbon tetrachloride (CCL4) and thioacetamide (TAA) [14]. When performed properly, the latter two models can be used to study both fibrosis progression and its regression (after discontinuation of the toxin). A combination of three of these models (Mdr2−/− and toxin-induced progression as well as regression) is a fairly good predictor of fibrosis scenarios that occur in human livers, despite the usually more aggressive and faster evolution of fibrosis in the experimental models [1, 9]. Moreover, in our experience their combination is a good predictor of antifibrotic drug effects in patients (own unpublished data). These (optimized) models have been characterized extensively by us and key readouts related to fibrosis, fibrogenesis, and fibrolysis are well established [2, 9, 12–21]. While mechanism and phenotype underlying fibrosis in the Mdr2−/− knockout (accumulation of toxic bile acids in hepatocytes and initiation of a profibrogenic cholangiocyte response) are well defined and have a human correlate (progressive familial intrahepatic cholestatasis type 3, PFIC-3; resembling also secondary sclerosing cholangitis, PSC) [13, 22, 23], the mechanisms of fibrosis induced by CCL4 and TAA have not been fully elucidated. CCL4, like other haloalkanes, is activated by oxidases to yield the trichloromethyl (CCl3) radical, which initiates lipid peroxidation and can react with the sulfhydryl groups of proteins leading to hepatocyte necrosis, apoptosis, and necroapoptosis [24, 25], with defective repair and liver fibrosis that increases with the intensity and duration of toxin exposure. Notably, fibrosis starts from the hepatic centrilobular zone 3 and progresses towards the portal tracts of zone 1, opposite to the biliary fibrosis in Mdr2−/− mice. Likewise, the thiono-sulfur-compound TAA is oxidatively bioactivated in hepatocytes leading to reactive S and S-S oxides that react with amine-lipids and amino groups of proteins. They are likely to be responsible for TAA hepatoxicity [26], yielding a liver damage and fibrosis pattern similar to the CCL4 , model, but with a more prominent zone 1 injury. Importantly, the advanced toxin models as performed by us do not show a significant fibrosis regression (despite a favorable architectural remodeling) after toxin discontinuation over up to 36 weeks, which makes them excellent predictors of “true antifibrotic drug effects” for translation towards human studies. In this chapter, we provide an indepth description of these models including detailed experimental protocols for state-of-the-art fibrosis related readouts including liver collagen quantification, general histomorphometry, and qRT-PCR.
2 Materials
2.1 Mouse Models
2.1.1 Model of Hepatotoxin (CCL4 or TAA)-Induced Panlobular Fibrosis Progression and Fibrosis Regression
-
1.
7–8-week-old sex- and weight-matched C57BL/6 or BALB/c mice (see Note 1 ).
-
2.
Hepatotoxic reagent: Carbon tetrachloride (CCL4) or thioacetamide (TAA), mineral oil and distilled water as vehicle for CCL4 or TAA, respectively.
-
3.
1 ml syringe and gavage needle.
2.1.2 Model of Portal/Periductular Fibrosis (Mdr2−/− Mice )
-
1.
6 week old female (male) Mdr2−/− mice (C57BL/6) and their wild type controls (see Note 2 ).
2.2 Mouse Anesthesia and Organ Collection
-
1.
Anesthetics (e.g., isoflurane, ketamine–xylazine mixture), injection needle, and devices for mouse autopsy.
-
2.
Balance.
-
3.
Liquid nitrogen.
2.3 Hydroxyproline (HYP) Assay
All solutions are made with ultrapure water (using deionized water with a resistance of 18 MΩ cm at 25 °C) and analytical grade reagents. Preparation and storage of all reagents at room temperature (RT) (unless indicated otherwise).
2.3.1 Large Volume Assay
-
1.
Hand homogenizer or tissuelyser.
-
2.
Dry oven.
-
3.
Spectrophotometer.
-
4.
6 N HCl.
-
5.
50 % isopropanol.
-
6.
0.84 % chloramine-T: 42 mM sodium acetate, 2.6 mM citric acid, 39.5 % (v/v) isopropanol, pH 6.0. Store at 4 °C.
-
7.
12 % Ehrlich’s reagent: 0.248 g of p-dimethylamino-benzaldehyde in 0.27 ml of 60 % perchloric acid and 0.73 ml isopropanol. Should be prepared immediately before use.
-
8.
High purity hydroxyproline (HYP) for standards: 0, 0.1, 0.2, 0.4, 0.6, 0.8, 1.0, and 1.6 μg HYP/ml water.
2.3.2 Microplate Assay
-
1.
Hand homogenizer or tissuelyser.
-
2.
Dry oven.
-
3.
Spectrophotometer.
-
4.
96-well microplate.
-
5.
6 N HCl.
-
6.
Citrate-acetate acid buffer: 5 % citric acid, 7.24 % sodium acetate, 3.4 % NaOH, 1.2 % glacial acetic acid, pH 6.0. Can be stored for several months at 4 °C, but should be used at RT before assay.
-
7.
1.3 % Chloramine-T: 32 ml citrate-acetate buffer pH 6.0, 4 ml distilled water, 4 ml isoropanol, 564 mg Chloramine-T hydrate (see Note 3 ). Store at 4 °C.
-
8.
14 % Ehrlich’s reagent: 4.5 g of p-dimethylamino-benzaldehyde, 7.8 ml of 70 % perchloric acid, and 18.6 ml isopropanol. Should be prepared immediately before use .
-
9.
High purity HYP for standards: 10, 20, 40, 60, 80, 100, and 200 μg HYP/ml water.
2.4 Histology
2.4.1 Preparation of Paraffin Sections
-
1.
Tissue processor.
-
2.
Tissue embedder.
-
3.
Microtome.
-
4.
Water bath.
-
5.
Glass slides and cover glass.
-
6.
Mounting medium.
-
7.
4 % formaldehyde, a series of graded isopropanol/water, xylene, paraffin wax.
-
8.
Histology cassette and metal mold.
2.4.2 Picrosirius Red Staining
-
1.
Mayer’s hematoxylin solution.
-
2.
Picrosirius Red solution: 0.5 g Sirius red, e.g., Direct Red 80, 500 ml of 1.3 % saturated aqueous solution of picric acid. The reagent can be stored at RT for at least 3 years.
-
3.
Acidified water: 5 ml glacial acetic acid, 1 l distilled water.
-
4.
Isopropanol and xylene.
-
5.
Xylene-based mounting medium.
-
6.
Light microscope, Image analyzer (ImageJ; NIH, Bethesda, MD).
2.4.3 Hematoxylin and Eosin Staining
-
1.
Mayer’s hematoxylin solution.
-
2.
0.25 % eosin Y solution: 250 ml eosin Y stock solution, 750 ml 80 % ethanol, 5 ml glacial acetic acid. 1 % stock solution: 10 g eosin Y, 200 ml distilled water, 800 ml 95 % ethanol.
-
3.
Ethanol and xylene.
-
4.
Xylene-based mounting medium.
3 Methods
3.1 Model of Hepatotoxin (CCL4 or TAA)-Induced Panlobular Fibrosis Progression and Regression
-
1.
Mice are maintained in specific pathogen-free conditions on a 12-h light–12-h dark cycle in an air conditioned room at 25 °C and provided water and standard mouse pellet chow ad libitum.
-
2.
Mice receive escalating doses of CCL4 (50/50 vol. mixed with mineral oil) three times per week via oral gavage, starting with 0.875 ml/kg (1st dose, week 1), 1.75 ml/kg (2nd to 9th dose, week 1–4), 2.5 ml/kg (10th to 23rd dose, week 4–8), and 3.25 ml/kg (after week 8). The working solution can be stored at RT (see Fig. 1).
Fig. 1 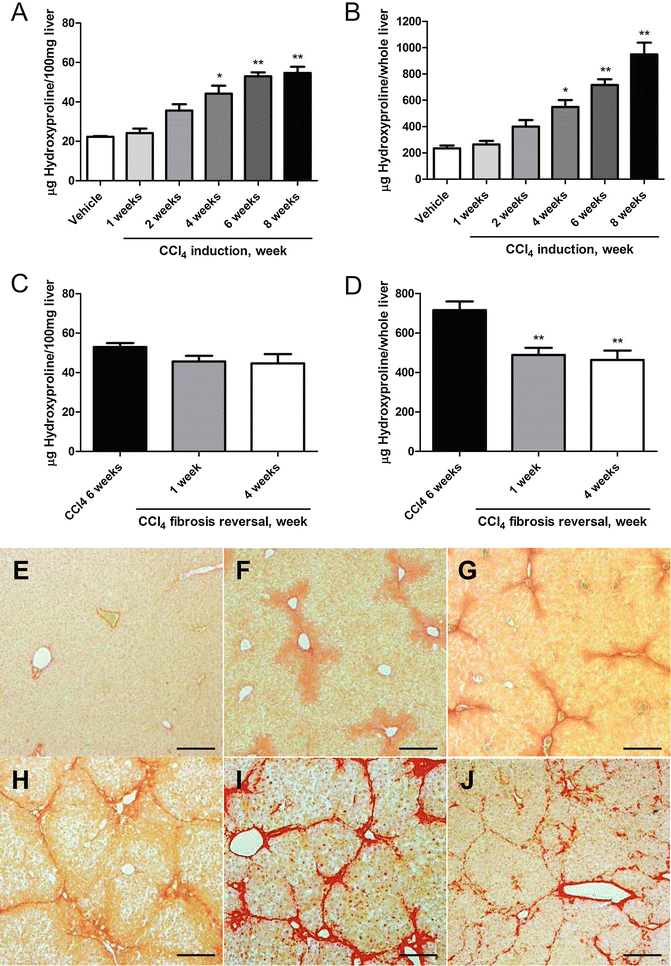
Changes of liver HYP content and Picrosirius Red stained area in the CCL4 -induced fibrosis progression and regression models in C57BL/6 mice. (a–d) HYP content per 100 mg liver and per whole liver. HYP content expressed as (a) relative (μg per 100 mg liver, derived from the left and median lobes) at week 1, 2, 4, 6, and 8 of fibrosis induction, and (b) total hepatic HYP expressed as μg per liver, at week 1, 2, 4, 6, and 8 of fibrosisFig. 1 (continued) induction. (c) Relative HYP content (μg per 100 mg liver) at week 1 and 4 after cessation of a 6-week treatment with CCL4 (fibrosis regression), (d) total hepatic HYP (μg per whole liver) at week 1 and 4 of regression. Results are expressed as means ± SEM (n = 6–10 per group). *p < 0.01, **p < 0.001 as compared to vehicle (a and b) and to 6 weeks fibrosis control (c and d) (ANOVA). (e–j) represent the respective Picrosirius Red stained livers during the course of fibrosis progression and regression. (e) Week 0 control (Ishak 0), (f) week 1 (Ishak 1), (g) week 2 (Ishak 2), (h) week 4 (Ishak 3), (i) week 8 (Ishak 4, with full developed septal fibrosis), (j) incipient degradation of septal fibrosis at 4 weeks of regression following 6 weeks of CCL4 induction. Magnification ×100, scale bar 100 μm
-
3.
Alternatively, fibrosis is induced by escalating doses of TAA dissolved in 200 μl PBS, intraperitoneally three times a week, starting with 50 mg/kg (1st and 2nd dose, week 1) (see Note 4 ), 100 mg/kg (2nd to 5th dose, week 1–2), 200 mg/kg (6th to 10th dose, week 2–4), 300 mg/kg (11th to 15th dose, week 4–5), and 400 mg/kg (16th dose onwards, after week 6). The working solution is stored at 4 °C. Prepare fresh solution every week (see Fig. 2).
Fig. 2 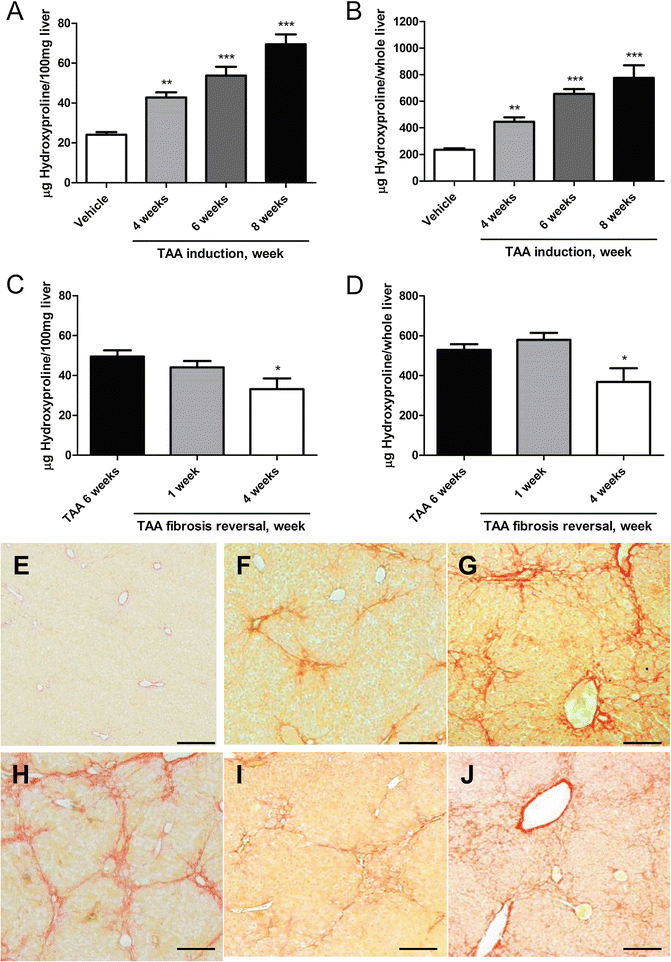
Changes of liver HYP content and Picrosirius Red stained area in the TAA-induced fibrosis progression and regression models in C57BL/6 mice. (a–d) HYP content per 100 mg liver and per whole liver. HYP content expressed as (a) relative (μg per 100 mg liver, derived from the left and median lobes) at week 4, 6 and 8 of fibrosis induction, and (b) total hepatic HYP expressed as μg per liver, at week 4, 6 and 8 of fibrosis induction.Fig. 2 (c) Relative HYP content (μg per 100 mg liver) at week 1 and 4 after cessation of a 6 week treatment with TAA (fibrosis regression), (d) total hepatic HYP (μg per whole liver) at week 1 and 4 of regression. Results are expressed as means ± SEM (n = 6–10 per group). *p < 0.05, **p < 0.01 and ***p < 0.001 as compared to vehicle (a and b) and to 6 weeks fibrosis control (c and d) (ANOVA). (e–j) Represent the respective Picrosirius Red stained livers during the course of fibrosis progression and regression. (e) Week 0 control (Ishak 0), (f) week 4 (Ishak 2), (g) week 6 (Ishak 3), (h) week 8 (Ishak 4, with full developed septal fibrosis), (i and j) incipient degradation of septal fibrosis at 1 week (i), and 4 weeks (j) of regression following 6 weeks of TAA induction. Magnification ×100, scale bar 100 μm
-
4.
For the generation of an advanced fibrosis progression model, mice are treated for at least 6 weeks, for induction of bridging fibrosis/cirrhosis treatment is given for 10–12 weeks (see Note 5 ). To study (advanced or cirrhotic) fibrosis regression, toxins are applied for 6 or 10–12 weeks, respectively, and the mice are followed for 2–4 or up to 36 weeks off the toxin, with little or no spontaneous regression , respectively [14] (see Figs. 1 and 2).
-
5.
Mice are sacrificed 1–2 days after the last CCL4 or TAA application by cervical dislocation under general anesthesia, livers and spleens (plus other organs of interest) are excised and weighed. Liver specimens from two lobes (e.g., left and right/median) are either fixed in 4 % buffered formalin or snap-frozen in liquid nitrogen for further analysis.


3.2 Model of Portal/Periductular Fibrosis (Mdr2−/− Mice)
-
1.
Mdr2−/− mice are maintained under specific pathogen-free conditions on a 12-h light–12-h dark cycle in an air conditioned room at 25 °C and provided water and standard mouse pellet chow ad libitum.
-
2.
These mice develop spontaneously progressive biliary fibrosis until 15–18 week of age, with a maximal progression rate from week 4–12 (see Fig. 3 and Note 6 ).
Fig. 3 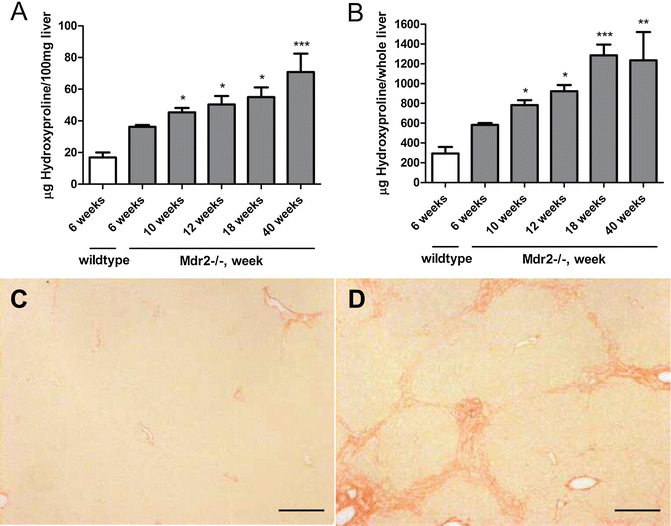
Mdr2−/− mice develop spontaneous progressive hepatic collagen accumulation. (a) HYP content expressed as relative (μg per 100 mg liver, derived from the left and median lobes) at week 6, 10, 18, 24 and 40 of age, (b) total hepatic HYP expressed as μg per liver, as calculated by multiplication of individual liver weights with the relative HYP content. Results are expressed as means ± SEM (n = 6–10 per group). *p < 0.05, **p < 0.01 and ***p < 0.001 as compared to 6 weeks Mdr2−/− mice (ANOVA). (c) and (d) Represent the Picrosirius Red stained livers of FVB wildtype and FVB Mdr2−/− mice at age 6 (FVB wt, Ishak 0) and 10 weeks (FVB Mdr2−/−, Ishak 3, with proliferating bile ductular cells in the portal area). Magnification ×100, scale bar 100 μm
-
3.
Mice sacrifice and organ sampling are performed as described in Subheading 3.1.

3.3 Hepatic Collagen Quantification (HYP Assay) (See Note 7 )
3.3.1 Protocol for Large Volume Assay (See Note 8 )
-
1.
Homogenize the liver tissue (150–300 mg liver samples from two different lobes; these amounts of tissue are necessary for optimal reproducibility due to the inhomogeneity of the fibrosis) in 5 ml of 6 N HCl and hydrolyze at 110 °C for 16 h (see Note 9 ).
-
2.
After hydrolysis, let samples cool and filter the hydrolysate, then evaporate 50 μl aliquots under vacuum and remove residual HCl via evaporation after addition of methanol (see Note 10 ).
-
3.
Dissolve the sediment in 1.2 ml of 50 % isopropanol.
-
4.
Incubate with 0.2 ml of 0.84 % chloramine-T for 10 min at RT.
-
5.
Add 1.0 ml of 12 % Ehrlich’s reagent and incubate the mixture at 50 °C for 90 min.
-
6.
Place briefly on crushed ice to chill.
-
7.
HYP is then quantitated photometrically at 550 nm compared to a standard curve (see Note 11 ).
-
8.
Calculate the HYP content of the liver sample using the formula: [Absorption of sample/0.26] × 400 = μg HYP/g liver. Multiplication of this value by the whole liver weight in g yields the total HYP content per liver.
3.3.2 Protocol for 96-Well Plate Assay (See Note 12 )
-
1.
Homogenize liver tissue (150–300 mg) in 5 ml 6 N HCl, and hydrolyse samples at 110 °C for 16 h.
-
2.
After hydrolysis, let samples cool.
-
3.
Aliquot 5 μl of standards, samples and blanks into the wells of a 96 well plate in triplicate. Use water for blank.
-
4.
Add 50 μl citrate-acetate buffer to the wells.
-
5.
Add 100 μl chloramine-T solution to the wells, incubate at RT on an orbital shaker at medium-high speed for 20 min (see Note 13 ).
-
6.
Add 100 μl Ehrlich’s reagent to the wells, measure absorbance at 550 nm for pre-incubation reading (see Note 14 ).
-
7.
Incubate the plate at 65 °C for 20–30 min (see Note 15 ).
-
8.
Cool to RT and measure absorbance at 550 nm for post-incubation reading.
-
9.
Subtract the post-incubation from the pre-incubation reading for each well, including standards, and obtain mean value of the three wells.
-
10.
Plot the means into the equation for the standard curve. This yields the μg/ml of HYP in the hydrolysates.
-
11.
Multiply this value by the total volume of hydrolysate, then divide it by the tissue weight used. This is the relative HYP content of each sample (μg HYP per g liver). Multiply this by the whole liver weight. This is the total HYP content (μg HYP per liver).
3.4 Histology
3.4.1 Preparation of Slides
-
1.
The left and median (or right) liver lobes are fixed in 4 % formaldehyde at 4 °C for 48 h, after which tissues are moved into 70 % ethanol for long term storage or dehydrated through a series of graded alcohol, and finally infiltrated with paraffin wax. This is usually carried out by an automated tissue processor, e.g., with a programmed gradient of 40, 60, 80, 90 % isopropanol for 1 h each, 100 % two times for 1 h and once for 2 h, 100 % xylene three times for 1 h, and 100 % paraffin two times for 3 h each. The thus paraffinized tissues are pressed into a metal mold generally using a paraffin embedding machine. These blocks can be stored at RT for years.
-
2.
For histology the paraffinized tissue is sectioned using a microtome. Blocks to be sectioned are placed face down on ice for 10 min (or overnight). Trimming is done with 10 μm thick cuts, once cutting is smooth, proceed with 5–6 μm sections. Sections are floated on the surface of the 37 °C water bath and taken up on clean glass slides. Place the slide with paraffin section in a 65 °C oven for 20 min to bond the tissue to the glass.
-
3.
Paraffinized tissues must be rehydrated before the staining by deparaffination, i.e., after melting the paraffin in 65 °C in a dry oven for 30 min, the paraffinization procedure is reversed, using 100 % xylene two times for 3 min, 100 % isopropanol two times for 5 min, 90 % and 75 % for 5 min each, dipping in distilled water two times.
3.4.2 Sirius Red Staining (See Note 16 )
-
1.
Deparaffinize the tissue and stain in Picrosirius Red solution for 1 h and rinse in distilled water, and wash in acidified water two times for 5 min.
-
2.
Dehydrate the slides again, e.g., in 90 % isopropanol for 5 min, 100 % isopropanol two times for 5 min, 100 % xylene two times for 5 min. Drop the xylene-based mounting reagent on the tissue and cover with a cover glass.
-
3.
Collect the images using a light microscope (×100 magnification) (see Note 17 ). The red stained collagen area is calculated as the % stained area using an image analyzer , e.g., ImageJ (NIH, Bethesda, MD) (see Note 18 ).
3.4.3 Hematoxylin and Eosin (H&E) Staining (See Note 19 )
-
1.
Deparaffinize the tissue.
-
2.
Stain the tissue with Mayer’s hematoxylin for 3–5 min, and wash in running tap water until the water is no longer colored (5–10 min).
-
3.
Counterstain with Eosin Y working solution for 10–30 s (see Note 20 ).
-
4.
Place in 95 % ethanol for 30 s and rinse in four changes of distilled water.
-
5.
Dehydrate the slides, e.g., using 90 % isopropanol for 5 min, 100 % isopropanol two times for 5 min; 100 % xylene two times for 5 min. Drop the xylene-based mounting reagent on the tissue and cover with a cover glass.
-
6.
Capture images using light microscope observation (×200 magnification) (see Fig. 4 and Note 21 ).
3.4.4 Staging of Liver Fibrosis Using the Metavir Scoring System (See Note 22 )
The Ishak staging is simple but broadly validated in clinical samples, especially for viral hepatitis B and C, but is also used increasingly in rodent fibrosis studies. A major reason is that histological staging, although being semiquantitative, provides important additional information on the architectural derangement of the liver, which often does not correlate well with the mere accumulation of ECM. Ishak staging uses seven categories ranging from normal to cirrhosis based on collagen staining, such as the preferred Picrosirius Red staining. It correlates with another frequently used scoring system according to Metavir (five categories from normal to cirrhosis ). Both staging systems also include frequently used grading scores for inflammation, which are not discussed here [27, 28]. In the following the Ishak system is matched to the corresponding morphometrical collagen proportional area and the Metavir score;
-
Stage 0, No fibrosis (normal) (1.9 % stained; Metavir F0).
-
Stage 1, Fibrous expansion of some portal area, with or without short fibrous septa (3.0 % stained; Metavir F1).
-
Stage 2, Fibrous expansion of most portal areas, with or without short fibrous septa (3.6 % stained; Metavir F2).
-
Stage 3, Fibrous expansion of most portal areas with occasional portal to portal (P-P) bridging (6.5 % stained; Metavir F2).
-
Stage 4, Fibrous expansion of portal areas with marked bridging (portal to portal (P-P) as well as portal to central (P-C)) (13.7 % stained; Metavir F3).
-
Stage 5, Marked bridging (P-P and/or P-C), with occasional nodules (incomplete cirrhosis ) (24.3 % stained; Metavir F3).
-
Stage 6, Cirrhosis , probable of definite (27.8 % stained; Metavir F4).
All images of each tissue should be staged, like Picrosirius Red stain analysis, including more than 10 (–15) images per slide is recommended to minimize the errors (see Note 23 ).
3.5 Further Readouts
A rigorous fibrosis assessment requires further, refined readouts, such as (1) quantitative reverse transcription PCR for transcript levels related to fibrogenesis, fibrolysis, and inflammation, (2) immunohistochemistry on frozen or paraformaldehyde fixed sections, (3) fluorescence associated cell sorting, (4) bioactivity determinations, e.g., for proteolytic enzymes such as matrix metalloproteinases (MMPs) or for kinase activities. Moreover, any in vivo fibrosis study should be accompanied by determination of a set of routine (alanine aminotransferase, bilirubin, creatinine and others) specific (fibrosis or immune related markers) serum parameters and surrogates relevant to the study. These will not be detailed here but can be found in publications of our and of other groups [13–16, 21, 29–32].
4 Notes
-
1.
The susceptibility to CCL4 and TAA-induced fibrosis relies considerably on the genetic background of mouse strain. While FVB/N mice are less susceptible, BALB/c inbred mice are more responsive to CCL4 [26], displaying occasional mortality, and C57BL/6 mice develop intermediate levels of fibrosis. We mostly use C57BL/6 mice, due to the availability of knockout strains.
-
2.
Mdr2−/− mice begin to develop biliary fibrosis 4 weeks after birth [7]. Male FVB background Mdr2−/− mice develop less fibrosis compared to females (30 % less at 10 weeks). Therefore, also for easier cohousing we recommend to preferentially use females and to avoid using both males and females in a single experiment.
-
3.
This volume of reagent will suffice for two microplates. Chloramine-T is hardly dissolved by vortex mixing. If needed, the suspension can be heated to below 50 °C using a heat block or water bath to dissolve. This reagent needs to be prepared freshly before each experiment.
-
4.
The intraperitoneal application of TAA frequently results in higher mortality (<5 %) than oral CCL4 . This animal loss can be utmost avoided by applying lower dose(s) for adaptation (e.g., two doses of 50 or 25 mg/kg as a starting doses) especially in cases of excessive weight loss (greater than 10 %).
-
5.
With escalating doses of these hepatotoxins, incipient fibrosis (two to threefold increased liver collagen) is evident at 3 weeks, advanced fibrosis (three to fourfold increased liver collagen) at 6 weeks, and bridging fibrosis/cirrhosis (five to sixfold increased liver collagen) at 12 weeks [14]. For testing the effect of antifibrotics on fibrosis progression, the drugs are administered during either the whole period of fibrosis induction or (preferably) during the last 4 weeks before sacrifice. Hepatotoxin and drug treatment should be spaced apart at least 8 h if administered on the same day. In proof-of-concept studies for antifibrotics the test drug can also be given for shorter periods (1–2 weeks), with mainly qRT-PCR based fibrosis readouts [15, 18].
-
6.
For testing antifibrotics in Mdr2−/− mice, the test drug is administered preferably either from age of 4–8, or 6–10 weeks of age before sacrifice (see Fig. 3).
-
7.
Hydroxyproline (HYP) is an amino acid that is almost exclusively expressed in collagens, representing between 10 and 14 % in the predominant, fibril forming collagens (types I > III > V in liver) [33–35]. The biochemical determination of hepatic HYP content is the ‘gold standard’ to quantify collagen accumulation in fibrotic tissues, and an essential prerequisite to detect antifibrotic drug effects in animal models. Since the assay is based on the measurement of the HYP oxidized by Chloramine-T to permit a reaction with the chromophore of Ehrlich’s reagent [36], this method must be used with caution for tissues in which excessive free radicals have been produced. i.e., at least 1 day after the last dose of CCL4 or TAA.
-
8.
Reliable measurements can only be obtained with larger amounts of sample, especially in cases of biliary fibrosis . Exceptionally 30–50 mg of liver tissue can be used but results must be interpreted with care and higher numbers per group will be needed to achieve statistical significance. The large volume assay is a more reliable HYP quantification than the micro-well plate based assay [37–39].
-
9.
Hydrolysis can either be performed with wet (frozen) or dry (fixed and deparaffinized) tissue with similar results. The homogenization step can be omitted for small-sized samples, and replacement of room air in the reaction flask with nitrogen yields more reproducible results. Screw cap flasks are recommended and the cap should be tightly sealed before hydrolysis to prevent evaporation. Take caution right after the hydrolysis when handling the ‘boiling’ acid hydrolysate.
-
10.
Some charred residue is often produced during acid settling to the bottom once the sample is stored in the cold room for a few hours. After the assay, the rest of the acid hydrolysate can be stored at −20 °C or at RT after drying. However, in solution the HYP is slowly (within a few days to weeks) degraded at RT or at 4 °C.
-
11.
Liver hydrolysates with high absorptions that reach the nonlinear range of the standard curve need to be further diluted.
-
12.
This microplate assay is suitable for high throughput analysis for large numbers of samples [31, 40]. However, because this assay is quite sensitive to for example pipetting errors, the assay may need to be repeated to ensure the reading is stable and the back calculated values of standards match the expected values. Especially, generation of an accurate linear regression standard curve is essential. The result should be consistent with the result of the large volume assay, and also correlate with the results of the Picrosirius Red morphometry and for example procollagen mRNA expression.
-
13.
Only a few minutes before the incubation period ends Ehrlich’s reagent should be prepared. Mixing the reagents produces an exothermic reaction. Place briefly on ice to chill to RT as soon as the reagents are completely mixed. Wear a mask/gloves handling this toxic reagent and work in a fume hood.
-
14.
Take the reading right after the mixture stops looking opaque, which takes approximately 2–3 min.
-
15.
If incubated for >30 min, the standard curve becomes nonlinear and should not be used for the calculation.
-
16.
The Picrosirius Red stain is for the histological visualization of collagen. The strongly cationic dye binds to the [Gly-X-Y]n triple helical structure found in all types of collagens [41]. The advantage of this stain is the higher specificity for collagen binding than the Masson’s trichrome stain and the clearer delineation from other tissue structures. Moreover, it can be observed both in bright field and polarized light [42], with the color of the fibers under polarized light reflecting the density of the collagen fibrils.
-
17.
When collecting the images for morphometrical analysis, taking more than 10 (–15) images per slide is recommended. This will encompass almost the whole tissue area on the slide, which is critical to prevent biased selection of stained areas. Thus, the collagen-dense large portal tracts in fibrosis should be omitted or quantified separately from the parenchymal collagen deposits that are functionally more relevant and often represent the bulk of liver collagen. Unfortunately, in most publications, this is not analyzed separately.
-
18.
The results should be correlated and compared with the results of fibrosis scoring [28] and the gold standard of HYP quantification.
-
19.
Hematoxylin and eosin staining is commonly used as a principal stain in histology. It is commonly used for grading inflammatory infiltration, fatty changes (micro- and macro-vesicular), hepatocyte degeneration (necrosis and apoptosis), and for an assessment of fibrosis. The staining method involves application of hematoxylin which binds to basophilic substances (e.g., DNA/RNA) staining them blue. The nuclear staining is followed by counterstaining with eosin Y which binds to acidophilic substances (e.g., proteins) and stains them pink.
-
20.
The required staining time is determined by the thickness of the tissue, the age of the solution and the depth of the counterstain desired.
-
21.
In fibrotic livers the immune cell infiltration can be specified and semi-quantified (graded); at high magnification orange colored phagocytosized pigments are often observed in Kupffer cells; apoptotic hepatocytes are hypereosinophilic and angular with fragmented and condensed nuclear material within the cytoplasm; the apoptotic bodies in dark pink may be free or contained within Kupffer cells; collagen is colored in pale pink (see Fig. 4). However, for the precise identification of cell populations, immunohistochemistry or flow cytometry are needed.
Fig. 4 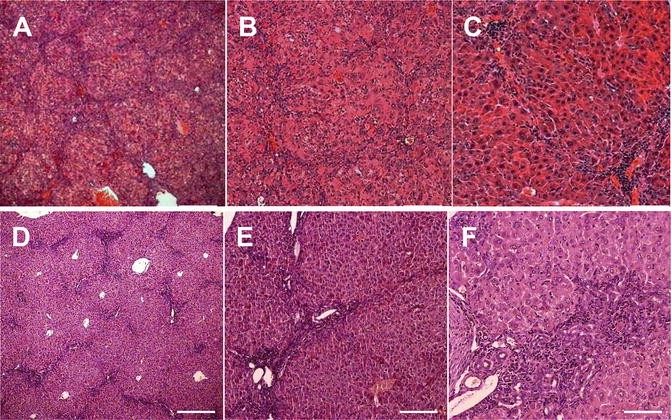
Hematoxylin and eosin stain of necroinflammation in fibrotic livers. (a–c) Panlobular liver fibrosis after 6 weeks of intraperitoneal TAA induction. (d–f) biliary fibrosis in 10 week old Mdr2−/− mice. (a) Infiltrating leukocytes (monocytes) as stained with hematoxylin appear in a septal pattern. Magnification: (a and d) ×50, (b and e) ×100, (c and f) ×200, scale bar 100 μm
-
22.
There are several histologic scoring systems developed for human livers, i.e., the Ishak, the Knodell and the related Metavir score, originally developed to assess the severity of chronic viral hepatitis, which includes descriptions of both necroinflammatory activity (grade) and the stage of fibrosis. The Knodell score assigns stages from one of four [43], the Metavir score from zero to four [28], and the Ishak score from one to six [27]. There are specific scoring systems for biliary liver diseases (e.g., the Scheuer score) and for nonalcoholic steatohepatitis (e.g., the Brunt and the NAS score). Scoring systems that include more stages for describing fibrosis are better able to document small changes in fibrosis over time. In this chapter, we describe the Ishak and Metavir stages with a focus on fibrosis.
-
23.
In principle at least two experienced pathologists should be involved in the scoring after a pre-trial consensus meeting to clarify the boundaries between the categories. Independent blinded assessment (without knowledge of sample information) of the complete samples should be performed by each of the pathologists. Assessments should be carried out in as short a time as possible. Stage scoring is not a measurement, but a categorical assignment; thus any statistical analysis should take this into account [28]. The results complement HYP and morphometrical (Picrosirius Red stained samples) measurements.

References
Mehal WZ, Schuppan D (2015) Antifibrotic therapies in the liver. Semin Liver Dis 35:184–198
Schuppan D, Kim YO (2013) Evolving therapies for liver fibrosis. J Clin Invest 123:1887–1901
Schuppan D, Afdhal NH (2008) Liver cirrhosis. Lancet 371:838–851
Friedman SL (2010) Evolving challenges in hepatic fibrosis. Nat Rev Gastroenterol Hepatol 7:425–436
Friedman SL, Sheppard D, Duffield JS et al (2013) Therapy for fibrotic diseases: nearing the starting line. Sci Transl Med 5:167sr161
D’ambrosio R, Aghemo A, Rumi MG et al (2012) A morphometric and immunohistochemical study to assess the benefit of a sustained virological response in hepatitis C virus patients with cirrhosis. Hepatology 56:532–543
Marcellin P, Gane E, Buti M et al (2013) Regression of cirrhosis during treatment with tenofovir disoproxil fumarate for chronic hepatitis B: a 5-year open-label follow-up study. Lancet 381:468–475
Schuppan D, Pinzani M (2012) Anti-fibrotic therapy: lost in translation? J Hepatol 56(Suppl 1):S66–S74
Popov Y, Schuppan D (2009) Targeting liver fibrosis: strategies for development and validation of antifibrotic therapies. Hepatology 50:1294–1306
Schuppan D (2015) Liver fibrosis: common mechanisms and antifibrotic therapies. Clin Res Hepatol Gastroenterol 39(Suppl 1):S51–S59
Liedtke C, Luedde T, Sauerbruch T et al (2013) Experimental liver fibrosis research: update on animal models, legal issues and translational aspects. Fibrogenesis Tissue Repair 6:19
Ikenaga N, Liu SB, Sverdlov DY et al (2015) A new Mdr2(−/−) mouse model of sclerosing cholangitis with rapid fibrosis progression, early-onset portal hypertension, and liver cancer. Am J Pathol 185:325–334
Popov Y, Patsenker E, Fickert P et al (2005) Mdr2 (Abcb4)−/− mice spontaneously develop severe biliary fibrosis via massive dysregulation of pro- and antifibrogenic genes. J Hepatol 43:1045–1054
Popov Y, Sverdlov DY, Sharma AK et al (2011) Tissue transglutaminase does not affect fibrotic matrix stability or regression of liver fibrosis in mice. Gastroenterology 140:1642–1652
Jimenez Calvente C, Sehgal A, Popov Y et al (2015) Specific hepatic delivery of procollagen alpha1(I) small interfering RNA in lipid-like nanoparticles resolves liver fibrosis. Hepatology 62:1285–1297
Patsenker E, Popov Y, Stickel F et al (2008) Inhibition of integrin alphavbeta6 on cholangiocytes blocks transforming growth factor-beta activation and retards biliary fibrosis progression. Gastroenterology 135:660–670
Patsenker E, Popov Y, Stickel F et al (2009) Pharmacological inhibition of integrin alphavbeta3 aggravates experimental liver fibrosis and suppresses hepatic angiogenesis. Hepatology 50:1501–1511
Popov Y, Patsenker E, Stickel F et al (2008) Integrin alphavbeta6 is a marker of the progression of biliary and portal liver fibrosis and a novel target for antifibrotic therapies. J Hepatol 48:453–464
Schattenberg JM, Nagel M, Kim YO et al (2012) Increased hepatic fibrosis and JNK2-dependent liver injury in mice exhibiting hepatocyte-specific deletion of cFLIP. Am J Physiol Gastrointest Liver Physiol 303:G498–G506
Sedlaczek N, Jia JD, Bauer M et al (2001) Proliferating bile duct epithelial cells are a major source of connective tissue growth factor in rat biliary fibrosis. Am J Pathol 158:1239–1244
Yoshida S, Ikenaga N, Liu SB et al (2014) Extrahepatic platelet-derived growth factor-beta, delivered by platelets, promotes activation of hepatic stellate cells and biliary fibrosis in mice. Gastroenterology 147:1378–1392
Fickert P, Zollner G, Fuchsbichler A et al (2002) Ursodeoxycholic acid aggravates bile infarcts in bile duct-ligated and Mdr2 knockout mice via disruption of cholangioles. Gastroenterology 123:1238–1251
Smit JJ, Schinkel AH, Oude Elferink RP et al (1993) Homozygous disruption of the murine mdr2 P-glycoprotein gene leads to a complete absence of phospholipid from bile and to liver disease. Cell 75:451–462
Shi J, Aisaki K, Ikawa Y et al (1998) Evidence of hepatocyte apoptosis in rat liver after the administration of carbon tetrachloride. Am J Pathol 153:515–525
Slater TF, Cheeseman KH, Ingold KU (1985) Carbon tetrachloride toxicity as a model for studying free-radical mediated liver injury. Philos Trans R Soc Lond B Biol Sci 311:633–645
Hajovsky H, Hu G, Koen Y et al (2012) Metabolism and toxicity of thioacetamide and thioacetamide S-oxide in rat hepatocytes. Chem Res Toxicol 25:1955–1963
Ishak K, Baptista A, Bianchi L et al (1995) Histological grading and staging of chronic hepatitis. J Hepatol 22:696–699
Standish RA, Cholongitas E, Dhillon A et al (2006) An appraisal of the histopathological assessment of liver fibrosis. Gut 55:569–578
De Meijer VE, Sverdlov DY, Popov Y et al (2010) Broad-spectrum matrix metalloproteinase inhibition curbs inflammation and liver injury but aggravates experimental liver fibrosis in mice. PLoS One 5:e11256
Kornek M, Lynch M, Mehta SH et al (2012) Circulating microparticles as disease-specific biomarkers of severity of inflammation in patients with hepatitis C or nonalcoholic steatohepatitis. Gastroenterology 143:448–458
Popov Y, Patsenker E, Bauer M et al (2006) Halofuginone induces matrix metalloproteinases in rat hepatic stellate cells via activation of p38 and NFkappaB. J Biol Chem 281:15090–15098
Popov Y, Sverdlov DY, Bhaskar KR et al (2010) Macrophage-mediated phagocytosis of apoptotic cholangiocytes contributes to reversal of experimental biliary fibrosis. Am J Physiol Gastrointest Liver Physiol 298:G323–G334
Neuman RE, Logan MA (1950) The determination of hydroxyproline. J Biol Chem 184:299–306
Schuppan D (1990) Structure of the extracellular matrix in normal and fibrotic liver: collagens and glycoproteins. Semin Liver Dis 10:1–10
Schuppan D, Ruehl M, Somasundaram R et al (2001) Matrix as a modulator of hepatic fibrogenesis. Semin Liver Dis 21:351–372
Prockop DJ, Udenfriend S (1960) A specific method for the analysis of hydroxyproline in tissues and urine. Anal Biochem 1:228–239
Boigk G, Stroedter L, Herbst H et al (1997) Silymarin retards collagen accumulation in early and advanced biliary fibrosis secondary to complete bile duct obliteration in rats. Hepatology 26:643–649
Cho JJ, Hocher B, Herbst H et al (2000) An oral endothelin-A receptor antagonist blocks collagen synthesis and deposition in advanced rat liver fibrosis. Gastroenterology 118:1169–1178
Gerling B, Becker M, Staab D et al (1997) Prediction of liver fibrosis according to serum collagen VI level in children with cystic fibrosis. N Engl J Med 336:1611–1612
Fujita M, Shannon JM, Irvin CG et al (2001) Overexpression of tumor necrosis factor-alpha produces an increase in lung volumes and pulmonary hypertension. Am J Physiol Lung Cell Mol Physiol 280:L39–L49
Junqueira LC, Bignolas G, Brentani RR (1979) Picrosirius staining plus polarization microscopy, a specific method for collagen detection in tissue sections. Histochem J 11:447–455
Whittaker P, Kloner RA, Boughner DR et al (1994) Quantitative assessment of myocardial collagen with picrosirius red staining and circularly polarized light. Basic Res Cardiol 89:397–410
Knodell RG, Ishak KG, Black WC et al (1981) Formulation and application of a numerical scoring system for assessing histological activity in asymptomatic chronic active hepatitis. Hepatology 1:431–435
Acknowledgments
This work was supported by NIH U19 AI066313-04 Hepatitis C Cooperative Research Centers, EU ERC Advanced Grant titled “Quantitative Imaging of Liver Fibrosis and Fibrogenesis,” and a grant within the EU Project “European Study of Steatohepatitis” to DS.
Author information
Authors and Affiliations
Corresponding author
Editor information
Editors and Affiliations
Rights and permissions
Copyright information
© 2017 Springer Science+Business Media LLC
About this protocol
Cite this protocol
Kim, Y.O., Popov, Y., Schuppan, D. (2017). Optimized Mouse Models for Liver Fibrosis. In: Clausen, B., Laman, J. (eds) Inflammation. Methods in Molecular Biology, vol 1559. Humana Press, New York, NY. https://doi.org/10.1007/978-1-4939-6786-5_19
Download citation
DOI: https://doi.org/10.1007/978-1-4939-6786-5_19
Published:
Publisher Name: Humana Press, New York, NY
Print ISBN: 978-1-4939-6784-1
Online ISBN: 978-1-4939-6786-5
eBook Packages: Springer Protocols