
Abstract
Activation of the type I interferon (IFN) response is an essential defense mechanism against invading pathogens such as viruses. This chapter describes two protocols to quantify activation of the chicken IFN response through analysis of gene expression by real-time quantitative PCR and by quantification of bioactive IFN protein using a bioassay.
You have full access to this open access chapter, Download protocol PDF
Key words
1 Introduction
The type I interferon response (IFN response) is an important part of the immune reaction against viruses. Interferon alpha and beta (IFNα and IFNβ) are the prototypical type I interferons and can be produced by most animal cells. Production of IFNα/β is triggered upon stimulation of pattern recognition receptors, such as Toll like receptors (TLRs) or Rig-I like receptors (RLRs). Upon production, IFNα and IFNβ are rapidly secreted to the extracellular compartment, where they can bind to the ubiquitously expressed IFN receptor. Binding of IFN to the receptor activates the JAK/STAT signaling pathway, leading to the formation of the ISGF3 transcription complex consisting of a STAT1, STAT2, and IRF9. In the nucleus, the ISGF3 complex induces transcription of hundreds of IFN-stimulated genes (ISGs) [1]. Many of these genes encode proteins that interfere with the replicative cycle of viruses at various stages (reviewed in ref. 2). The IFN response is a potent antiviral mechanism, and therefore, most viruses have been evolutionarily selected to counteract it and coronaviruses are no exception (reviewed by Zhong et al. [3]).
In this chapter we describe two protocols to quantify activation of the IFN response. We have found these protocols useful to study if and how viruses counteract the IFN response in chicken cells. The first protocol describes how to quantify activation of the IFN response at the transcriptional level using real-time quantitative PCR (RT-qPCR) on Ifn and IFN-stimulated genes. The second protocol describes quantification of bioactive type-I IFN protein (both IFNα and IFNβ) by the use of a reporter cell line. This bioassay can be used to quantify IFN secreted in response to virus infection and, when combined with transcription analysis of Ifnα and Ifnβ these assays can provide an integral picture of activation of the chicken IFN response.
1.1 Quantitation of Transcription of Chicken Ifn-Related Genes
Similar to most mammalian cell lines, activation of the interferon response in most chicken cells is characterized by upregulation of Ifnβ. Like the human genome, the chicken genome encodes only one copy of the Ifnβ gene, whereas at least ten isoforms of Ifnα are present [4, 5]. Similar to mammals, production of chicken IFNα is mainly mediated by monocytes; other cells mainly produce IFNβ in response to viral infection [6]. Because avian coronaviruses replicate mainly in epithelial cells, we monitor activation of the type I interferon response by quantification of Ifnβ. Similar to mammalian cells, Ifnβ is upregulated upon activation of either TLR or Rig-I like receptors (RLRs), but not in response to stimulation with IFN. Concomitant with Ifnβ, many ISGs are also upregulated, indicating that the term interferon stimulated genes is somewhat misleading [7]. Studying the expression of ISGs can be useful, therefore we have provided a list of avian-specific primers for use in real-time quantitative PCR (RT-qPCR; Table 1) [8–10]. Protocols for RNA isolation, cDNA synthesis and real-time PCR are plenty and every lab has its own protocols. In this chapter we describe briefly the methods used in our lab. For a detailed overview of RT-qPCR techniques and theoretical background, please refer to Forlenza et al. [11].
1.2 Quantitation of Chicken Type I IFN Protein Using a Bioassay
The chicken interferon bioassay was developed in the laboratory of Prof. P. Staeheli [12]. It is based on a quail cell line (CEC-32) that contains the luciferase gene downstream of a part of the inducible chicken mx promoter. Stimulation of these cells with type I interferon readily induces activation of the mx promoter and subsequent production of the firefly luciferase enzyme. Firefly luciferase can be easily quantified using commercially available luciferase assay kits. Here we provide a step-by-step protocol for measuring IFN concentrations using this bioassay.
2 Materials
2.1 RNA Isolation, cDNA Synthesis, and RT-qPCR on Avian Cells
-
1.
Cells and virus, as per experiment.
-
2.
RNeasy Mini Kit (QIAgen).
-
3.
RNase-free DNase set (QIAgen).
-
4.
Bioanalyser (Agilent Technologies) or agarose gel electrophoresis equipment.
-
5.
Spectrophotometer (NanoDrop or equivalent).
-
6.
DNase I, Amplification Grade.
-
7.
Reverse Transcriptase (Invitrogen SuperScript® III or equivalent).
-
8.
PCR machine (for cDNA synthesis).
-
9.
Nuclease-free water.
-
10.
Luciferase mRNA.
-
11.
Random hexamers.
-
12.
2× SYBR® Green I mix.
-
13.
Quantitative-PCR machine (Qiagen Rotor-Gene Q or equivalent).
-
14.
Primers (Table 1).
2.2 Quantitation of Chicken Type I IFN Protein Using a Bioassay
-
1.
Culture medium: DMEM, 10 % FCS, 100 U/ml penicillin, 100 μg/ml streptomycin.
-
2.
Stimulation medium: DMEM, 1 % FCS, 100 U/ml penicillin, 100 μg/ml streptomycin.
-
3.
CEC-32 chicken IFN reporter cells in 96-well plates at 70–90 % confluency (provided by P. Staeheli, see Note 1 ).
-
4.
Recombinant chicken interferon alpha (chIFNα; Labome).
-
5.
Multichannel pipet (8 × 200 μl).
-
6.
Firefly luciferase assay buffer (Promega Bright-Glo™ or equivalent).
-
7.
Luminometer.
3 Methods
3.1 RNA Isolation, cDNA Synthesis, and RT-qPCR on Avian Cells
-
1.
Perform the experiment in 24-well plates (see Note 2 ). Infect or treat cells as desired.
-
2.
When appropriate, cells are lysed by adding 350 μl RLT buffer spiked with 1 ng/sample of luciferase mRNA prior to RNA isolation (see Note 3 ).
-
3.
Total RNA is isolated using the RNeasy Mini Kit according to the manufacturer’s instructions, including an on-column DNase treatment with RNase-free DNase.
-
4.
Verify RNA integrity on a 1 % agarose gel or using a Bioanalyser.
-
5.
Determine RNA concentration using a spectrophotometer (NanoDrop or equivalent).
-
6.
Prior to cDNA synthesis, perform a second DNase digestion step using DNase I.
-
7.
Synthesis of cDNA is performed on 0.5–1 μg total RNA using Reverse transcriptase and random hexamers according to the manufacturer’s instructions. Incubation steps are performed in a regular PCR machine or, alternatively in a water bath.
-
8.
After cDNA synthesis, samples are diluted 1:50 in nuclease-free water before qPCR analysis.
-
9.
Per sample, prepare a master mix containing 7 μl 2× SYBR Green I Mix and 2 μl primer mix (2.1 μM forward and reverse primer).
-
10.
Combine 9 μl master mix and 5 μl diluted cDNA per PCR tube.
-
11.
Real-time quantitative PCR is performed on a qPCR machine, such as Rotor-Gene Q, 35–40 cycles, 60 °C annealing temperature, 20 s extension time.
-
12.
Cycle thresholds and amplification efficiencies are calculated using the software pertaining to the qPCR machine, such as Rotor-Gene 6000.
-
13.
Using Eq. 1, the relative expression ratio of the target gene is calculated using the average reaction efficiency for each primer set and the cycle threshold (Ct) deviation of sample vs. control at time point 0 h (see Note 4 ).
With:
R = fold change of the target gene relative to the control
Calibrator = control cells at time point 0 (zero)
E = average amplification efficiency for that set of primers
Ct = cycle threshold
3.2 Quantification of Chicken Type I IFN Protein Using a Bioassay
-
1.
If the samples contain virus, heat-inactivate at 56 °C for 30 min prior to performing the assay. This treatment inactivates coronaviruses but retains bioactivity of type I IFN (see Note 5 ).
-
2.
Fill a sterile 96-well plate with 50 μl stimulation medium/well.
-
3.
Add 50 μl chIFNα standard (50 U/ml) or test sample to the first row (vortex before adding).
-
4.
Make serial twofold dilutions in the plate using a multichannel pipet (Fig. 1, see Note 6 ).
Fig. 1 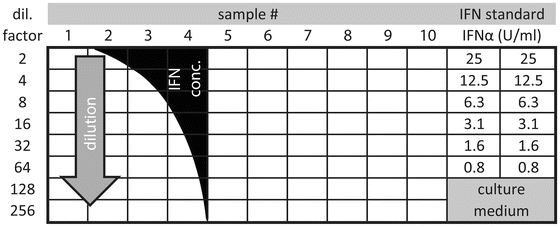
Layout of a 96-well plate to accommodate ten samples and an interferon standard
-
5.
Remove the medium from the CEC-32 cells which have been cultured in the 96-well plate (see Note 7 ).
-
6.
Transfer the content of the plate containing the diluted samples and standard to the CEC-32 cells (see Note 8 ).
-
7.
Incubate plates at 37 °C and 5 % CO2 for 6 h.
-
8.
Use a firefly luciferase assay kit to detect luciferase activity, according to manufacturer’s instructions.

3.3 Calculation of IFN Concentration from Luminescence Data
To calculate the units of interferon in the original sample, a workflow is provided in Fig. 2.

Workflow on how to calculate the concentration of IFN in the original sample from the readout of the luminometer
-
1.
Transfer the measurements from the luminometer to a spreadsheet program (Microsoft Excel or equivalent).
-
2.
Calculate the average value of the background luminescence and subtract this value from all wells (Fig. 2, point A).
-
3.
Calculate the average of the wells incubated with the diluted interferon standard and plot them in a scatter plot. This graph is the standard curve (B).
-
4.
Make a new graph using only the data points that fall within the linear range of the standard curve, usually 1–12.5 or 1–6 U/ml.
-
5.
Plot a linear trend line through these data points and display the equation on the chart (C).
-
6.
Next, all luminescence values that fall within the linear range of the standard curve are selected (here 2–12 U/ml).
-
7.
Calculate the IFN concentration in each well using the equation from the standard curve (D).
-
8.
Multiply by the dilution factor to obtain the concentration of IFN in the undiluted samples (E).
-
9.
Finally, calculate the average IFN concentration of the wells that fall within the linear range (usually two or three wells per sample). This value corresponds to the final concentration of type I interferon in the original sample (F).
4 Notes
-
1.
For more detail on the construction of CEC-32 chicken-IFN reporter cells, see ref. 12.
-
2.
To have enough RNA, each well of a 24-well plate should contain around 3 × 10⁵ avian cells.
-
3.
For normalization, a housekeeping gene such as GAPDH is generally used. It is advised to ensure that the reference gene selected is stable under the conditions of each experiment by performing stability analysis. When the mRNA level of the reference gene is not stable during the experimental procedure, such as during prolonged infection with a virus, we use an external reference gene for normalization. The external reference gene we use is luciferase, which is added as mRNA (commercially available) to the RLT lysis buffer (1 ng/sample) prior to RNA isolation and cell lysis. This guarantees that the external reference RNA and the host RNA are subject to the same treatment prior to cDNA synthesis.
-
4.
To calculate the fold change of IBV total RNA, Ct deviation is calculated versus a fixed Ct value (e.g., Ct = 30), because no IBV is present in the non-infected cells that are used as control in all the experiments.
-
5.
Interferon containing samples can be stored at 4 °C overnight. Storage at −20 °C ensures long time (>months) stability. One freeze–thaw cycle can reduce the IFN-activity of a sample by 40 %. To avoid repeated freeze-thawing of samples, avoid measuring the same sample twice. To achieve this, ensure that at least one of the dilutions of the samples falls within the linear range of the standard curve.
-
6.
To select the appropriate dilutions it is advisable to perform a pilot experiment. One can either make an extensive twofold serial dilution series (for example, 2–1,024 times dilution), or use tenfold pre-dilutions. In our hands IFN production by avian cells rarely exceeds 5,000 U/ml, and therefore, a maximum of 1,000 times pre-dilution should suffice.
-
7.
Medium is removed simply by emptying the 96-well plate in the waste and gently tapping it dry on a stack of tissues. Sterility is not an issue, the cells will only be incubated for another 6 h.
-
8.
CEC-32 cells should not be allowed to dry out! Make sure you transfer the samples to the cells within minutes. Drying of the monolayer will decrease the luminescence and thereby negatively influence the assay. When transferring the diluted samples to 96-well plate with CEC-32 cells, start with the lowest concentration and work your way up the dilutions. In this way the same tips can be used for multiple dilutions. Do not forget to add medium to the negative controls.
References
Rusinova I, Forster S, Yu S et al (2013) Interferome v2.0: an updated database of annotated interferon-regulated genes. Nucleic Acids Res 41:D1040–D1046
Ivashkiv LB, Donlin LT (2014) Regulation of type I interferon responses. Nat Rev Immunol 14:36–49
Zhong Y, Tan YW, Liu DX (2012) Recent progress in studies of arterivirus- and coronavirus-host interactions. Viruses 4:980–1010
Sick C, Schultz U, Staeheli P (1996) A family of genes coding for two serologically distinct chicken interferons. J Biol Chem 271:7635–7639
Sekellick MJ, Ferrandino AF, Hopkins DA et al (1994) Chicken interferon gene: cloning, expression, and analysis. J Interferon Res 14:71–79
Sick C, Schultz U, Munster U et al (1998) Promoter structures and differential responses to viral and nonviral inducers of chicken type I interferon genes. J Biol Chem 273:9749–9754
Sen GC, Sarkar SN (2007) The interferon-stimulated genes: targets of direct signaling by interferons, double-stranded RNA, and viruses. Curr Top Microbiol Immunol 316:233–250
Villanueva AI, Kulkarni RR, Sharif S (2011) Synthetic double-stranded RNA oligonucleotides are immunostimulatory for chicken spleen cells. Dev Comp Immunol 35:28–34
Li YP, Handberg KJ, Juul-Madsen HR et al (2007) Transcriptional profiles of chicken embryo cell cultures following infection with infectious bursal disease virus. Arch Virol 152:463–478
Daviet S, Van Borm S, Habyarimana A et al (2009) Induction of Mx and PKR failed to protect chickens from H5N1 infection. Viral Immunol 22:467–472
Forlenza M, Kaiser T, Savelkoul HF et al (2012) The use of real-time quantitative PCR for the analysis of cytokine mRNA levels. Methods Mol Biol 820:7–23
Schwarz H, Harlin O, Ohnemus A et al (2004) Synthesis of IFN-beta by virus-infected chicken embryo cells demonstrated with specific antisera and a new bioassay. J Interferon Cytokine Res 24:179–184
Acknowledgements
We would like to thank Peter Staeheli for supplying the CEC-32 chicken type I interferon reporter cell line.
Author information
Authors and Affiliations
Corresponding author
Editor information
Editors and Affiliations
Rights and permissions
Copyright information
© 2015 Springer Science+Business Media New York
About this protocol
Cite this protocol
Kint, J., Forlenza, M. (2015). Quantification of Interferon Signaling in Avian Cells. In: Maier, H., Bickerton, E., Britton, P. (eds) Coronaviruses. Methods in Molecular Biology, vol 1282. Humana Press, New York, NY. https://doi.org/10.1007/978-1-4939-2438-7_21
Download citation
DOI: https://doi.org/10.1007/978-1-4939-2438-7_21
Published:
Publisher Name: Humana Press, New York, NY
Print ISBN: 978-1-4939-2437-0
Online ISBN: 978-1-4939-2438-7
eBook Packages: Springer Protocols