
Abstract
With the market share of Android system becoming the first in the world, the security problem of Android system is becoming more and more serious. How to effectively detect Android malware has become a significant problem. Permissions and API calls in Android applications can effectively reflect the behavior patterns of an Android application. Most researchers have only considered a single permission or API feature, and did not consider associations and patterns inside the permission or API features. Some scholars have also tried to find the combination modes inside the permission features in malwares, but the detection of maliciousness according to this combination mode is too absolute. This paper proposes a malware detection method, which combines the advantages of frequent pattern mining and Naive Bayes to effectively identify Android malwares.
You have full access to this open access chapter, Download conference paper PDF
Keywords
1 Introduction
The Android operating system is based on Linux and is an open source operating system developed by Google. From the official release of Android 1.0 in 2008 to the first quarter of 2011, Android market share reached 48% in just three years, and surpassed Symbian to become the world’s first. As of August 2017, only the Android system has a market share of over 80% in China. According to the first Smart Phone Market Report [1] published by market research firm Gartner in 2018, Android’s market share has reached 85.9%, far exceeding the IOS market share of 14.1%. Android, which maintains such a huge advantage, benefited from the outstanding performance of Chinese brands such as Huawei, Xiaomi and OPPO in the worldwide mobile phone market. However, the rapid development of Android system not only brought about a rapid expansion of market share, but also made the security problem of Android system become more serious. The 2017 CVE Details report shows that the Android system ranked first in the number of product vulnerabilities with 842 vulnerabilities, an increase of 61.0% compared with 523 in 2016 [2]. According to a research report released by China’s largest Internet security company 360 in the first half of 2018 [3], as of December 2017, up to 93.94% of Android phones have security vulnerabilities, and 360 Internet Security Center has intercepted 7.573 million new malware samples on the Android platform, monitoring 214 million Android users infected with malware.
On the one hand, because Android is an open source operating system, major mobile phone manufacturers have deeply customized it, resulting in frequent loopholes; on the other hand, the security of a large number of third-party software cannot be effectively guaranteed. Android is based on the Linux kernel, but Android’s third-party software is quite different from Linux. Linux runs open source software that has been reviewed by the open source community, and security can be guaranteed. Android runs third-party closed source software, and because the Android system is too fragmented and free. In addition to Google Play, there is no authoritative audit platform for Android third-party software, especially in China. The software is closed source and there is no effective and reasonable auditing mechanism, that allows malware to run on Android. As the Android operating system quickly became the smartest operating system with the highest market share, the number of Android software has also grown rapidly. A recent report showed [4] that by September 2017, the number of Android software on Google Play has reached 3.3 million, and in addition to Google Play, there are many third-party app stores that also offer downloads of Android software. Due to the openness, open source and relatively simple checking mechanism of Android system, Android system has attracted many malicious application developers. So Android has become a main platform for malicious applications.
In order to help identify Android malicious applications effectively, this paper introduces a android malicious application detection method based on frequent pattern and weighted Naive Bayes, which performs frequent pattern mining on the extracted privilege features and API features of Android applications, and then use the frequent pattern as feature to identify and distinguish Android malicious applications through a weighted Naive Bayes algorithm. Frequent pattern mining [5] is an effective classification method in the field of data mining and machine. It searches for frequently occurring patterns (item sets, sub-sequences, sub-structures) in the data set, and then identifies and classifies the samples to be tested based on the frequent patterns of such in-line associations. But identifying and classifying the malware directly through the frequent patterns found in the rights and API features tends to have a high false positive rate. This is because a large number of normal Android applications often have frequent patterns of malicious Android applications. It is generally and irresponsible to classify malicious applications directly based on frequent patterns. Naive Bayes algorithm [6] is also an important classification method in the field of supervised learning, and it is also one of the few classification algorithms based on probability theory. The Naive Bayes principle is simple and easy to implement, and is mostly used for text categorization. But it is based on a simple assumption: the attributes are independent of each other. However, the permissions of the Android application and the API features are not independent of each other. They cooperate with each other to make the whole software run normally and have certain correlation. Therefore, it is not appropriate to simply use the Naive Bayes algorithm for the identification of Android malicious applications. Therefore, the detection method in the paper combines frequent pattern mining with Naive Bayes, and uses the characteristics of frequent pattern connotation to compensate for the unreasonable assumptions of Naive Bayes, and compensates for frequent pattern recognition with the probability of Naive Bayes. Through such improvement on Naïve Bayes, frequent patterns and Naive Bayes can be well coordinated.
The main contributions of this paper are as follows:
We introduce the approach that performs Android malicious application detection based on frequent patterns and weighted Naive Bayes. Firstly, filtering the feature feature and API call feature by the feature differentiation degree defined in the text, and then mine frequent pattern of malicious application and Benign App based on the filtered feature. Finally, combine the frequent permission & API call feature and weighted Naive Bayes method to classify Android apps.
Based on this Android malicious application detection method, we implement a detection tool that can effectively classify and identify whether an Android application is a malicious application or not.
2 Related Work
Many scholars have done a lot of work on the identification and detection of Android malicious applications. The current mainstream detection technologies are static detection technology, dynamic detection technology and hybrid detection technology. The static detection mainly analyzes the source code, and identifies the malicious application by extracting the relevant features of the analysis source code. Although this method is fast, it has a high false positive rate; the dynamic detection technology is generally executed in a sandbox environment. The program identifies the malicious application by extracting the running behavior of the analysis application. This method can effectively detect the known and unknown malware, but the detection time is slow. The hybrid detection technology combines the static detection technology and the dynamic detection technology to identify the malicious application, and use machine learning methods for classification.
A common method for static detection is to detect malicious applications based on signature features. Liang et al. [7] proposed to declare the order of permissions in the Android Manifest file to find out the permissions frequently requested by the malware but not by the normal software, thus automatically generating a set of rules, using for malware identification. Yang et al. [8] proposed the detection of malicious applications based on frequent pattern algorithms. This method relys on finding the combination modes of the permission features in malicious applications to detect malicious applications, but this method is too absolute, and combinations or patterns of these permissions often appear in normal applications, resulting in a lower accuracy rate-79.6%, sometimes only 73.8%. There is also a component-based detection method [9, 10], which decomposes the application and extracts important contents such as permissions, resources, and byte codes to evaluate the program security. Another mainstream static detection method, Apposcopy [11], uses static stain tracking, combined with internal component calls, to generate signatures through semantic extraction. However, their method is only effective for the detection of several malware families, and it is difficult to detect malware with new signatures.
Dynamic monitoring generally detects the behavior characteristics of the application during its operation, and has certain requirements for real-time and operating environment. The more mainstream dynamic monitoring methods are generally based on behavioral characteristics. TaintDroid [12] combines analysis to track malicious information by detecting the source of information and sensitive data, but many normal software also need to access sensitive data. Crowdroid [13] distinguishes between normal and malicious applications by collecting real-time system calls for individual applications in conjunction with machine learning. TaitDroid [14] captures malicious advertisements through sandbox detection attacks. Riskranker [15] studied malicious code in multiple markets, using risky behavior features such as attack signatures, code encryption, and sending and receiving data for identification.
Hybrid detection combines static detection and dynamic monitoring to combine the advantages of both to compensate for the shortcomings of both. AMDetector [16] applies the attack tree model to organize and develop behavior rules, and uses static analysis to mark attack tree nodes, filtering out most normal applications, and retaining them for application. In the dynamic analysis phase, the ability of the application and the ability to detect the selected behavior are analyzed for maliciousness, and a high detection accuracy is achieved. Mobile-Sandbox [17] uses static analysis results to guide dynamic analysis to extend the execution code coverage through the mobile phone sandbox, record API calls and combine machine learning methods for malicious application detection.
Since the static features of normal applications and malicious applications have many similarities, static detection based on the combination mode features such as permissions, API calls, and components often has a high false positive rate, while dynamic detection and hybrid detection not only are time-sensitive, but have high requirements for the operating environment. Therefore, the method proposed in this paper is based on static detection technology, using Naive Bayes algorithm to make up for the shortcomings of pattern matching in static detection, and using frequent pattern mining authority and API correlation to make up for Naive Bayes “features are independent” The preconditions of idealization. It has not only the advantages of timeliness of static detection technology, but also low false positive rate and high accuracy.
3 Our Approach
This paper proposes an Android malware detection method based on frequent patterns and weighted Naive Bayes, Fig. 1 shows the overall process of our approach, it works in the following step:

Overview of the Android malware detection method based on frequent pattern and weighted Naive Bayes
Permission and API extraction, extracting the permission features and API call features in Android applications, and filtering according to the degree of discrimination of these features, and selecting the top 40 features with the best discrimination.
Permission & API call frequent pattern mining, based on the top 40 features, perform frequent pattern mining on the Android application dataset to find the permission & API call modes that frequently appear in malicious samples.
The weighted Naive Bayes classification is characterized by the frequent permission & API call mode, and weighted the naïve Bayes by the reliability of the frequent pattern to establish a detection model.
3.1 Permission and API Extraction
The features used in the detection method of this paper mainly come from the permission information and API call information of Android application, then mining the frequent pattern based on the permission and API features, and further combines the weighted Naive Bayes algorithm to classify the Android application. So first step is extracting the initial features from the permission features and the API call features. Each Android application is mapped to a set consisting of the permission features and the API call features. The permission of Android is mainly used to control specific operations executable by the application. During the developing, all the permissions should be applied in the file named Manifest.xml. Android has 134 permissions, and also allowing users to customize permissions. However, among these 134 permissions, INTERNET, ACCESS_NETWORK_STATE, ACCESS_WIFI_STATE and other permissions are widely used in both benign applications and malware. Such features are often not good for detect malwares. But the frequency of permissions being requested in normal and malicious programs is quite different, such as WRITE_EXTERNAL_STORAGE, READ_SMS, WRITE_SMS, etc. These features tend to have a better effect on classification. The API call has the same situation. Runtime; -> exec, DataOutputStream; -> writeBytes, ActivityManager; -> getProcessMemoryInfo occur more frequently in malicious applications.
In this case, all the permissions of Android are represented using a set P. All the API call sets are represented using a set I, and the set A represents the Android application data set. Considering that many permissions and API calls do not have an obviously distinction in frequency between benign applications and malwares. Representatively, we do not directly map the Android application dataset A to the collection \( P \cup I \) composed by permissions and API calls. Because it not only has a bad classification effect, but also causes huge waste of computing resources. so we simplify the set \( P \cup I \) to \( P^{{\prime }} \cup I^{{\prime }} \) by discrimination, \( P^{{\prime }} \cup I \, ^{{\prime }} \subseteq P \cup I \).
The elements in the set \( P^{{\prime }} \cup I^{{\prime }} \) should be frequent occurrences in malwares and have a less frequency in non-malicious applications, or have a less frequency in malicious applications and frequently occurring in non-malicious applications. Represent the total number of malicious application samples to \( \left| {A_{mal} } \right| \), the total sample size of benign applications is \( \left| {A_{ben} } \right| \), the total number of all the malicious application samples with feature fi is \( \left| {f_{i,mal} } \right| \), and the total number of all the benign application samples with feature fi is \( \left| {f_{i,ben} } \right| \), the frequency of the feature fi in the malicious application \( F_{i,mal} = \frac{{\left| {f_{i,mal} } \right|}}{{\left| {A_{mal} } \right|}} \), the frequency that appears in normal applications is \( F_{i,ben} = \frac{{\left| {f_{i,ben} } \right|}}{{\left| {A_{ben} } \right|}} \).
Definition 1.
Measuring a feature’s discrimination for malicious applications and normal application by \( dis \left( {f_{i} } \right) \in \left[ {0,1} \right) \).
When \( {\text{dis}}\left( {{\text{f}}_{\text{i}} } \right) \) is 0, it means that the frequency of the feature fi in the normal application is equal to the malicious application, and has no discriminating; When \( {\text{dis}}\left( {{\text{f}}_{\text{i}} } \right) \) is close to 0, which means that the discrimination in the feature fi is worse; When \( {\text{dis}}\left( {{\text{f}}_{\text{i}} } \right) \) approaches 1 means that the feature fi has a best discrimination.
Calculate the distinguishing degree of each feature in the permissions & API calls which belong to the set P∪I. We collected 1,000 malicious apps from VirusShare [18] and 1000 benign apps from Google Store, averaging them into training set and test set. We calculated the discrimination of the permission and API call features in 500 malwares and 500 benign applications in the training set and sorted these features by discrimination from big to small. Then added the top 20 permissions with the highest degree of discrimination in the permission feature to the set P′, and the top 20 with the highest degree of discrimination in the API calls set I to set I′, which together form the reduced permissions & API call set P′∪I′. Some elements in set P′∪I′ are shown in Table 1.
3.2 Permission and API Call Frequent Pattern Mining
In the previous step, 40 permissions and API calls features were extracted to form a new feature set P′∪I′ But Naive Bayes classifier is directly applied this feature set for classification is not appropriate, because the permissions and the API calls requested by an Android application have a strong correlation, but the significant premise of Naïve Bayes is that all features are independent of each other. But the situation that using the permissions and the API calls as the features to recognition Android malicious application obviously does not meet this precondition. To deal with this problem, we further perform frequent pattern mining on the feature set P′∪I′. Android’s permissions and API calls reflect the behavior pattern of the application in a certain extent. Mining the recognition between permissions and API calls can effectively identify Android malicious applications. Moreover, the permissions and API call frequent pattern, rather than directly using the privilege and API calls as features of the Naive Bayes classifier, can compensate for the problem of non-independence between each permission and API call. It also overcomes the issue that Naive Bayes’ conditions conflict with classifying Android malwares.
Definition 2.
Feature itemset. The set of features for an Android application represented by \( F = \left\{ {f_{1} ,f_{2} , \ldots f_{n} } \right\},f_{i} \in P' \cup I' \).
Definition 3.
Transaction database. A collection of transactions, each transaction formed by an Android application’s feature items set and an identifier (APKID).
Definition 4.
Support degree. The availability of the permission & API call pattern mined by the frequency pattern mining, represents the percentage of Android APK transactions in the transaction database that contain a feature itemset, expressed by P(Itemsi).
Definition 5.
Minimum support degree threshold, if the support degree of the feature items set is bigger than the minimum support degree threshold, it is called a frequent feature itemset.
Definition 6.
Maximal frequent feature itemset, if the feature itemset Itemsi is frequent in the transaction database, and there is no frequent item set Itemsi’ belongs to the transaction database that Itemsi’ is a superset of Itemsi’.
Based on the above definition, we can use the Apriori algorithm [19] to perform frequent pattern discovery for the Android application transaction database. The feature set of each application constitutes the transaction of the application, and all application transactions constitute the transaction database, and the minimum support degree threshold is MIN_SUP. Find all frequent permission item sets that satisfy the support degree not less than MIN_SUP, and finally gets the maximal frequent feature itemsets. As shown in the Table 2, we use an example to explain how to use the Apriori algorithm mining the Permission & API call frequent pattern. For easy to understand, this example assumes that minimum support degree threshold is 2/9, and there are 5 permissions & API call features and 9 transactions in the Android application transaction database.
Then use the Apriori algorithm to find the frequent itemsets in the transaction database as follows:
-
(1)
Finding all the itemsets in the transaction database formed by only one item to constitute a set C1, and counting the number of occurrences in the transaction database that each element belongs to C1;
-
(2)
Determining the set of the frequent 1-items set L1 by the minimum support degree threshold MIN_SUP equals to 2/9;
-
(3)
Combining the elements in L1 with each other to itemsets formed by two items. And adding these 2-items itemsets into a set C2. Counting the number of times each element in C2 appears in the transaction database;
-
(4)
Determining the set L2 of frequent 2-item itemsets L2 by the minimum support degree threshold;
-
(5)
Combine the elements in L2 into a set C3 of the 3-items itemsets, and simplify C3 according to the Apriori rule: “If the subset of an element in C3 does not belong to L1 or L2, then remove the element”. For each element in C3, count the number of occurrences in the transaction database;
-
(6)
Determining the set L3 of frequent 3-item itemsets by the minimum support degree threshold;
-
(7)
Recursively generating the set \( L_{4} ,L_{5} , \ldots ,L_{n} \) of frequent n-item itemsets until Ln+1 = ∅ (Fig. 2).
Fig. 2. 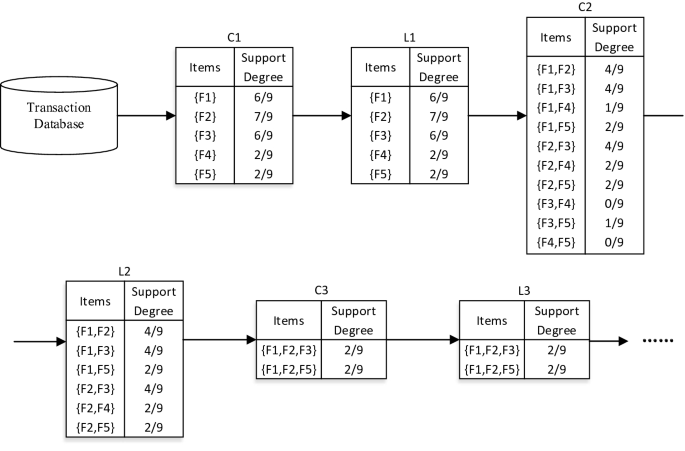
Process of frequency permission & API pattern mining

Then, according to the above method, all valuable frequent patterns Itemsi in the Android malicious application are acquired based on the permission & API calling feature to form the frequent pattern set D as the naïve Bayes’ features set.
3.3 The Weighted Naive Bayes Classification
Next step, we use the frequent permission & API call feature pattern Itemsi as the Naive Bayes feature to classify malwares. Bayes classification is very suitable for filtering a large number of application data sets, because it can be trained to perform fast classification, the computational cost is low. It can be known from the mining process of frequent patterns that the support degree P(Itemsi) of a frequent feature pattern Itemsi is the prior probability of the frequent feature pattern, which can be directly applied to the Naive Bayes algorithm. Thus frequent pattern mining has a good adaptability to Naive Bayes. However, in the process of frequent pattern mining, we find that the more the number of items in a frequent pattern Itemsi, the lower its support degree will be, so as to its class likelihood P(Itemsi|Malware) or class likelihood P(Itemsi|Normalware). But the more the number of items in a frequent pattern Itemsi, the more accurate and reliable the judgment which based on it, so we have a weighted improvement on Naïve Bayes.
For the reliability of frequent itemsets, the more items in a frequent itemset Itemsi, which belongs to the frequent feature item set D, the more reliable the classification is.
Definition 7.
The reliability is represented by reli(Itemsi), and are concentrated. The number of items in a frequent pattern is represented by |Itemsi|, then:
At the same time, according to the Naive Bayes algorithm, the probability of each feature in the training sample set under each category is calculated, which is represented by the prior probability \( P\left( {D|Malware} \right)\,{\text{and}}\,P(D|Benignware) \), that is \( P\left( {Items_{1} |Benignware} \right),P\left( {Items_{2} |Benignware} \right), \ldots ,P\left( {Items_{n} |Benignware} \right) \) and \( P\left( {Items_{1} |Malware} \right),P\left( {Items_{2} |Malware} \right), \ldots ,P\left( {Items_{n} |Malware} \right) \). Then calculating the posterior probability of each application classification according to Bayes’ theorem:
In formula (3) and (4), P(D) is constant for all categories, so we only need to consider the numerator \( P\left( {Malware} \right)P(D|Malware) \), \( P\left( {Benignware} \right)P\left( {D |Benignware} \right) \) as the maximum value. The Naive Bayes classification algorithm assumes that the features are independent to each other. This assumption indicates that the probability product of \( P\left( {Items_{1} |Benignware} \right),P\left( {Items_{2} |Benignware} \right), \ldots ,P\left( {Items_{n} |Benignware} \right) \) for the classification is exactly the probability of the feature \( P(D|Malware) \) for the category, so there are:
Therefore, we substitute formula (5) & (6) into formula (3) & (4) to get formula (7) & (8):
Since different frequent patterns have different reliability for classification, the weighted Naive Bayes formula is considered of the reliability in each frequent pattern, formula (7) & (8) are further changed to formula (9) & (10):
Finally, it is classified by comparing the probability that an application is classified as a malware \( P\left( {Malware |D} \right) \) with the probability of a benign application \( P\left( {Benignware |D} \right) \).
4 Implementation
In this section, we present the implementation details that readers may be interested in. The malicious application detection tool is mainly divided into two modules, namely the permission and API call feature extraction module and the Bayes classification module. The permission and API call feature module decompiles the Android application and extracts frequent permission & API call mode information, and the Bayes classification module classifies the Android application according to the information acquired by the feature extraction module (Fig. 3).

Process of detection tool
In this paper, the application’s permission information and sensitive API call information in the application are used as feature attributes to maliciously detect and identify the application. The feature extraction module mainly prepare the pre-model of the tool design, including the extraction of the authority and the sensitive API, and the feature processing after the extraction. Permission information in the static configuration file (AndroidManifest.xml), in the extracted content after decompressing the application package, see AndroidManifest.xml contains the name of the Android application package, Linux user ID, permissions, and the minimum API version required for this application. Sensitive API calls exist in the application source code. This article uses androguard, a powerful static analysis tool, which uses the DED decompile reverse tool to decompile by default. It uses get_permissions and get_apis in androguard to extract permission lists and sensitive API calls. For the Bayes classification module, we call the Naive Bayes algorithm in the scikit-learn library to see if there is some kind of frequent permission & API invocation pattern as the feature, and the characteristic attributes of Naive Bayes are attributed to the reliability of the frequent pattern. After weighting, the feature weighted Naive Bayes algorithm is finally obtained, and the detection model is established.
5 Evaluation
We systematically evaluated the approach and tool in this article to answer the following questions:
What is the effect of screening the initial permissions and API features based on the degree of discrimination?
After frequent pattern mining, using Naive Bayes for classification, is there any improvement compared with the direct application of separate permissions and API features?
Under the premise of applying the frequent permission & API calling mode, does the weighted Naive Bayes classification effect improve compared to the unweighted Naive Bayes classification?
Based on the above three questions, we conducted relevant experiments and evaluated them based on evaluation criteria such as accuracy, false positive rate, and running time. We collected 1,000 malicious apps from VirusShare and 1000 benign apps from Google Store, averaging them into training set and test set, and used the test set for method test evaluation.
First, for feature attributes, we use the degree of discrimination to filter, remove the feature attributes with poor discrimination, and reduce the impact of some feature attributes on the classification results. Therefore, Experiment 1 was used to test the performance of the feature processing method we used. We first compare the performance of the Naive Bayes algorithm without feature filtering and the performance of the Naive Bayes algorithm after feature filtering (Table 3).
From the above chart, we can see that the detection accuracy of Naive Bayes algorithm without feature screening is lower than that of feature screening, indicating that our feature processing method improves the detection performance of Naive Bayes algorithm to some extent. At the same time, we also deal with the random forest algorithm and the support vector machine algorithm, and compare the obtained detection results with the results of the random forest algorithm and the support vector machine algorithm without feature processing. Through the above vertical and horizontal comparisons of Naïve Bayes algorithm, random forest algorithm and support vector machine algorithm, it can be seen that the detection accuracy of feature screening is significantly lower than that of feature screening, and also shows our feature screening method has nothing to do with the type of algorithm applied, and it can generally improve the detection performance of the algorithm.
Second, in order to evaluate the performance of the weighted Bayes method based on frequent patterns, the second experiment is to compare the test results of Naïve Bayes based on pre-filtering permission & API features, Naïve Bayes based on post-filtering permission & API features, and Weighted Naive Bayes based on frequent permission & API patterns.
As can be seen from the Table 4, the accuracy of the method in this paper (88.69%) is better than the method’s mentioned in Chapter 2 (up to 79.6%), which is based on the combination mode of the permission features in malicious applications. And the detection accuracy of Naïve Bayes based on pre-filtering permission & API features and Naïve Bayes based on post-filtering permission & API features are both lower than that of weighted Naive Bayes based on frequent permission & API patterns. It shows that both the frequent pattern feature and the weighted Naive Bayes algorithm have further improved the detection performance.
6 Conclusion and Future Work
Android-based systems are becoming more and more exclusive in mobile phone systems, and malicious acts that use malicious applications to illegally obtain users’ information and interests are also increasing. The mainstream technologies for malicious application detection include static analysis detection technology and dynamic analysis detection technology. However, dynamic analysis detection is more technically demanding, consumes more resources, and is more demanding in real time. In this paper, the characteristics of static analysis are applied. The features are classified based on the degree of discrimination and the frequent feature patterns. The Naive Bayes algorithm is also used to improve the weighted attributes of frequent pattern reliability. Finally, this feature processing method and the improved Naive Bayes algorithm design is combined to implement a Android malicious application detection tool. The experimental results show that the feature screening method and the frequent feature pattern mining method can improve the detection performance of the algorithm to a certain extent. At the same time, for the Naive Bayes algorithm, the weighted property can be improved after reliability to achieve better results.
There are also some limitations and unfinished work in the approach of this paper. First of all, although the method considers the association between each permission and API call, it does not consider the correlation between frequent patterns. Since this method is still based on static detection technology, the detection effect on unknown malicious applications may not be ideal for detection of packed malicious applications: Because the author of malware uses obfuscation and encryption to make the code difficult to understand, some applications often cannot use this method to check for maliciousness. The method of this paper will be further developed and improved based on the above three points in the future.
References
Gartner Says Worldwide Sales of Smartphones Returned to Growth in First Quarter of 2018. https://www.gartner.com/newsroom/id/3876865. Accessed 29 May 2018
Android’s annual malware report (2017). (in Chinese) http://bbs.360.cn/thread-15355463-1-1.html
Android Security Environmental Research (2017). (in Chinese) http://zt.360.cn/1101061855.php?dtid=1101061451&did=210555695
Google Play. Number of available applications in the Google Play Store from December 2009 to September 2017. https://www.statista.com/statistics/266210/number-of-available-applications-in-the-google-play-store/
Park, J.S., Chen, M.S., Yu, P.S.: An effective hash-based algorithm for mining association rules. ACM (1995)
Domingos, P., Pazzani, M.: On the optimality of the simple Bayesian classifier under zero-one loss. Mach. Learn. 29(2–3), 103–130 (1997)
Liang, S., Du, X.: Permission-combination-based scheme for android mobile malware detection. In: IEEE International Conference on Communications (ICC), Sydney, Australia, New Jersey, 10–14 June 2014, pp. 2301–2306. IEEE (2014)
Yang, H., Zhang, Y., Hu, Y., et al.: Android malware detection method based on permission sequential pattern mining algorithm. J. Commun. 34(Z1), 106–115 (2013). (in Chinese)
Fuchs, A.P., Chaudhuri, A., Foster, J.S.: SCanDroid: Automated Security Certification of Android Applications. University of Maryland, Technical report CS-TR-4991 (2009)
Lu, L., Li, Z., Wu, Z., et al.: CHEX: statically vetting android apps for component hijacking vulnerabilities. In: Proceedings of the 2012 ACM Conference on Computer and Communications Security, Raleigh, NC, USA, 16–18 October 2012, pp. 229–240. ACM, New York (2012)
Feng, Y., Anand, S., Dillig, I., et al.: Apposcopy: semantics-based detection of android malware through static analysis. In: Proceedings of the 22nd ACM SIGSOFT International Symposium on Foundations of Software Engineering, (FSE-22), Hong Kong, China, 16–22 November 2014, pp. 576–587. ACM, New York (2014)
Enck, W., Gilbert, P., Han, S., et al.: TaintDroid: an information-flow tracking system for realtime privacy monitoring on smartphones. ACM Trans. Comput. Syst. (TOCS) 32, 1–5 (2014). (5)
Burguera, I., Zurutuza, U., Nadjm-Tehrani, S.: Crowdroid: behavior-based malware detection system for android. In: Proceedings of the 1st ACM Workshop Security and Privacy in Smartphones and Mobile Devices, Co-located with CCS 2011, Chicago, USA, 17 October 2011, pp. 15–26. ACM, New York (2011)
Wang, D., Dai, S., Ding, Y., et al.: POSTER: AdHoneyDroid – capture malicious android advertisements. In: Proceedings of ACM Conference on Computer and Communications Security, 2014, Scottsdale, Arizona, USA, pp. 1514–1516. ACM, New York (2014)
Michael, G., Zhou, Y., Zhang, Q., et al.: Riskranker: scalable and accurate zero-day android malware detection. In: The 10th International Conference on Mobile Systems, Applications and Services, Ambleside, United Kingdom, 25–29 June 2014, pp. 281–294. ACM, New York (2012)
Zhao, S., Li, X., Xu, G., et al.: Attack tree based android malware detection with hybrid analysis. In: The 13th IEEE International Conference on Trust, Security and Privacy in Computing and Communications (TrustCom), Beijing, China, 24–26 September 2014, pp. 380–387. IEEE, New Jersey (2014)
Spreitzenbarth, M., Schreck, T., Echtler, F., et al.: Mobile-Sandbox: combining static and dynamic analysis with machine-learning techniques. Int. J. Inf. Secur. 14(2), 141–153 (2015)
Virus Share Homepage. https://virusshare.com/
Agrawal, R., Imielinski, T., Swami, A.N.: Ming association rules between sets of items in large databases. In: Proceedings of the 1993 ACM SIGMOD the International Conference on Management of Data, Washington DC, USA, pp. 207–216 (1993)
Author information
Authors and Affiliations
Corresponding author
Editor information
Editors and Affiliations
Rights and permissions
Open Access This chapter is licensed under the terms of the Creative Commons Attribution 4.0 International License (http://creativecommons.org/licenses/by/4.0/), which permits use, sharing, adaptation, distribution and reproduction in any medium or format, as long as you give appropriate credit to the original author(s) and the source, provide a link to the Creative Commons license and indicate if changes were made.
The images or other third party material in this chapter are included in the chapter's Creative Commons license, unless indicated otherwise in a credit line to the material. If material is not included in the chapter's Creative Commons license and your intended use is not permitted by statutory regulation or exceeds the permitted use, you will need to obtain permission directly from the copyright holder.
Copyright information
© 2019 The Author(s)
About this paper

Cite this paper
Li, J., Wu, B., Wen, W. (2019). Android Malware Detection Method Based on Frequent Pattern and Weighted Naive Bayes. In: Yun, X., et al. Cyber Security. CNCERT 2018. Communications in Computer and Information Science, vol 970. Springer, Singapore. https://doi.org/10.1007/978-981-13-6621-5_4
Download citation
DOI: https://doi.org/10.1007/978-981-13-6621-5_4
Published:
Publisher Name: Springer, Singapore
Print ISBN: 978-981-13-6620-8
Online ISBN: 978-981-13-6621-5
eBook Packages: Computer ScienceComputer Science (R0)