
Abstract
Managers need to tread carefully between conflicting objectives of operational cost and customer service whilst they are designing and managing any logistics network. This case involves operational cost and customer service issues that Overseas Courier Services (OCS) encountered in year 2012. OCS is a major player in Pakistan’s parcel and cargo services industry providing 212 pick-up locations throughout Pakistan. Its services include parcel and cargo pickup and delivery for its private and business customers. The purpose of this teaching case is to expose class participants to strategic, tactical and operational aspects of network design and transport fleet planning within transportation and logistics industry. It involves analysis for route planning of transport fleet and selecting headquarter location for OCS’s central region.
Access this chapter
Tax calculation will be finalised at checkout
Purchases are for personal use only
Author information
Authors and Affiliations
Corresponding author
Editor information
Editors and Affiliations
Teaching Note
Teaching Note
Synopsis
While managing transportation and logistics operations, managers need to tread carefully between the conflicting objectives of operational cost and customer service. Often, these performance indicators are a result of strategic, tactical and operational decisions made by the managers. This case involves operational cost and customer service issues that OCS encountered in 2012. OCS is a major player in parcel and cargo services industry in Pakistan. Its services include parcel and cargo pickup and delivery for its private and business customers. The purpose of this teaching case is to expose class participants to the strategic, tactical and operational aspects of network planning and transport fleet planning within transportation and logistics industry. It involves analysis for route planning of transport fleet and selecting headquarter location for OCS’s central region.
Teaching Purpose and Objectives
This case can be used to highlight transport network design and planning issues at MBA, executive and undergraduate levels. It can be used in various courses such as supply chain management, transportation and logistics management, and distribution management. The network design problem presented in this case can also be used to highlight the use of mathematical programming techniques (such as mixed integer programming based network planning models) for design and analysis of transport networks.
Discussion Questions and Analysis
- Question 1::
-
Develop a route plan for customer pickup locations identified by Taimoor. What are the primary cost and customer service drivers in route planning?
- Question 2::
-
Should OCS keep using its current location in Icchra as a central region headquarter (HQ) or follow the example of industry leader (i.e. TCS) and shift its central region HQ?
- Question 3::
-
The case also indicates the use of Hybrid approach for network planning. What is it? Is it preferable? Why or why not?
Question 1:
Develop the route plan for customer pickup locations identified by Taimoor. What are the primary cost and customer service drivers in route planning?
Analysis:
This question involves establishing route plans for pick from identified customer locations and in doing so the objective is also to determine the performance drivers in route planning. Various heuristics are available in literature for route planning. As a first step, one needs to establish a baseline for comparison. For this purpose, we can use the data provided in Case Exhibit 5. The exhibit provides the distance and travel time information between Icchra and each customer. Case Exhibit 4 provides the current routes that are in place. OCS used four riders to arrange the pickup from each customer location. Given the route information in Case Exhibit 4 and travel time and travel distance information in Case Exhibit 5, one can deduce the travel time and travel distance for each route as shown in TN Table 1.
Case Exhibit 11 provides information on fuel consumption and fuel costs for riders. Using average fuel costs per km, one can also deduce as shown in TN Table 1. It is easy to argue that in place routes are inefficient by observing the graphical depiction of routes in Case Exhibit 4. Current routes overlap each other, thus inducing inefficiencies as more than one rider is being used to coverage similar regions. This discussion is likely to lead the participants to understand that in order to reduce costs, the riders total travel distance needs to be reduced.
Routing by Sweep Heuristic
Here, the instructor can point out a simple technique in route planning to include the customer locations in routes in clockwise or anticlockwise manner. This technique is called sweep. For example, to plan in an anticlockwise manner, we can start from +ive y-axis and include the closest customer location, which is closest to y-axis in an anticlockwise manner. The added location is deleted from the location set and the next closest location is added to the route, and in such a manner customer locations are added to the current route till rider’s capacity is exhausted. TN Table 2 depicts the routes constructed via sweep method. The analysis shows that considerable savings can be established if sweep method is followed. For example, total travel distance is reduced from 107 to 78.4 km. Similarly, travel costs are reduced significantly from Rs. 227.05 to 167.77.
Despite sweep being a very simple technique, the improvements are significant. It is evident that travel distances play a major role in deducing transportation costs and time efficiencies. At this point, the instructor may ask class regarding other methods to establish route plan. It is likely that some participants may point out that often transport companies try to segment their entire coverage area into smaller clusters and then develop the route plans for customer locations in each cluster.
Geographical Clustering and Routing by Nearest Neighbour Heuristic
How should the entire region be clustered into smaller region? A simple way is to observe the entire region visually and segment it into small clusters of perhaps approximately equal size and equal number of customers. TN Exhibit 1 shows one such clustering. The customers are clustered according to their geographical positioning. For example, the customers to the north of HQ are clustered together and so on. Once the clusters are available, routes can be derived for the customers in each cluster by considering the travel distance. A single technique here is often termed as nearest neighbour which involves selecting the nearest location to the current location for inclusion into the current route. For example, in northern cluster our current location is Icchra (starting HQ location). Here the nearest location in northern cluster is customer location 14 so it should be visited first. Now the current location has been updated and the next selection from remaining set is customer location 9 as it is the closest to customer location 14. In such a manner the routes can be constructed for each rider. The result of utilizing geographical clustering and nearest neighbour are shown in TN Table 3. The clustering and nearest neighbour method provides slightly superior results as opposed to sweep method. The negligible difference can perhaps be attributed to the use of a two-step approach.

Customer segments—clusters
Probing the class participants on limitations can help instructor deduce the following observations: Clustering technique used in the earlier text is rudimentary and does not involve any considerations of weight limitations of riders. In addition, it did not explicitly consider travel distance of customer locations and Icchra. Further probing may also reveal that the inter travel distances among all customers should also be considered for clustering and route planning as choosing the nearest location from the current location (i.e. nearest neighbour) may not be optimal. The optimal approach must therefore consider all travel distances before choosing the next customer. Here the instructor can introduce the concept of ‘Saving Matrix’ to deduce the clusters, while considering the inter travel distances of all customers.
Clustering by Saving Matrix and Routing by Nearest Neighbour Heuristic
The saving matrix technique helps to allocate customers to different clusters, while trying to minimize the total distance travelled. Being a heuristic technique, the savings matrix does not provide an optimal solution however gives a solution which is often close to optimal.
The saving matrix technique creates clusters while considering the impact of inter-travel distances of all locations. The main concept stems from the fact that joining two routes into one route may help reduce travel distances. For example if there is an existing route from the origin to a location-x, what shall be the potential savings if we include a location-y in this route as opposed to starting a new route from the origin to a location-y? Thus, in our case instead of the rider going straight from Icchra to customer location 14, we will need to investigate the savings resulting by adding any other customer location into the route. The expression used to construct the saving matrix is the following:
The calculated saving matrix for each customer location is shown in TN Exhibit 2. Larger the value, the more attractive it is to add two customer locations in a single route in terms of cost. TN Table 4 depicts the clusters constructed using the saving matrix:
The different regions formed are graphically depicted in the TN Exhibit 3. An example of how the 6, 12, 11 cluster has been formed is as follows: Looking at TN Exhibit 2, the largest saving is of 16.8 formed by combining customer locations 6 and 12. To get the next point we need to look at the largest savings adjacent to all customer locations corresponding to customer location 6 and 12, this is found to be 15.6 by combining customer location 6 and 11. These three customer locations require a total weight of 31 kg; hence, another customer location cannot be added into the current cluster. This method is then repeated until all the clusters have been formed. Route planning can now be performed among customer locations in each cluster. For example, we first show the use of nearest neighbour approach to establish routes. TN Table 5 depicts the routes established by Saving Matrix—Nearest Neighbour technique as associated performance indicators.

Clusters formed by using saving matrix technique
This method yields a total cost of 15,760 which is closer to the previous methods. The advantage of using this method is that the saving matrix forms all the clusters and no manual technique is required to form clusters. However, the nearest neighbour method is still difficult to manage with a large number of customers. This can be resolved by using a formal technique like farthest insert or nearest insert as opposed to nearest neighbour. In the remaining text we discuss the use of nearest insert heuristics for route planning for the clusters identified by using saving matrix technique.
Clustering by Saving Matrix and Routing by Nearest Insert Heuristic
We shall apply nearest insert routing technique on the clusters identified in TN Table 4. In nearest insert, for each route, a new customer location (from the un-routed customer set) with minimum increase in length from all potential points is inserted. Hence, the customer location closest to the current route is inserted and not from the current customer location. Thus, the main difference between farthest and nearest insert is that the former always inserts customers that give the highest distance in a given route. The following example summarizes the route for cluster 10, 4, 7 are established using nearest insert routes heuristic.
-
Step 1: For each customer location choose the one having the least distance to and from the warehouse. For example, from Ichhra (location 0), customer locations 7, 10 and 4 have a return distance of 13.2, 14.2 and 6.8 km, respectively. Customer location 4 has the least distance to and from the warehouse; hence the rider will visit it first
-
Step 2: Keeping customer location 4 fixed, each customer location is inserted next to find the minimum increase in length. For example, the total distance of route 0-4-10-0 is 16.3 km whereas the route distance of 0-4-7-0 is 14 km.
Hence, adding customer location 7 after customer location 4 gives the shortest distance, as only customer location 10 is now left it is added after customer location 7, giving a final route of 0-4-7-10-0.
The above steps are repeated for the rest of the clusters giving the routes shown in TN Table 6.
Summary
Thus far, we have compared the performance of various routing heuristics. It is clear from the analysis that in general the cost efficiencies in routing can be attained by travelling minimum distances with higher capacity utilization. During class discussion, the instructor does not need to discuss all of the above heuristics, but the focus should be to discuss more than one heuristic so the role of performance drivers (i.e. minimum travel distances and higher capacity utilization) can be highlighted.
Question 2:
Should OCS keep using its current location in Icchra as a central region headquarter (HQ) or follow the example of industry leader (i.e. TCS) and shift its central region HQ?
Analysis:
Before deciding the new location of the regional HQ, all the potential factors that would impact the decision have to be identified. It is clear that from the case discussion that OCS management is interested in an option that saves delivery times as well as overall operational costs.
In order to evaluate each viable location, first, a cost analysis needs to be performed. Currently, the main costs being incurred by OCS for a particular facility are:
-
1.
Capital Expenditure of facility—these costs will remain same as the investment from the current facility will be used to construct a new one.
-
2.
Operational Cost
-
(a)
Facility running costs—these costs will not change across facilities
-
(b)
Transportation cost—this cost will change across the location of each facility, and hence is the most important in determining new facility location.
-
(a)
This analysis will entail the transportation cost of each mode used. Currently, OCS uses runners and trucks for inter-city deliveries. For intra-city deliveries OCS only uses riders.
Hence, for each of the identified viable location the total cost of runners, riders and trucks will be computed for inter-city transportation costs. Riders’ costs analysis shall be performed for each viable HQ locations to ascertain intra-city transportation costs. This analysis will be done in two parts:
-
1.
InterCity Transportation Cost Analysis using Exit Points
Under this method, the total runner and truck cost will be computed for each of the exit points, and a step by step approach will be provided to arrive at the final cost.
-
2.
Intra-City Transportation Cost Analysis using Clusters
Under this method, Lahore will be divided in 5 different clusters, and for each cluster the total rider cost will be computed for the three viable locations.
InterCity Transportation Cost Analysis Using Exit Points
These exit points connect Lahore city to the wider central region. The exit points of Saghian, Motor way (MT), Grand trunk road (GT), Airport and Multan road are listed in the case. The viable HQ locations for analysis are Icchra (baseline option), Saghian, and Airport.
Case Exhibit 6 plots the different exit points against each of the three viable locations. In order to conduct an exit-point analysis, the cost for each mode of transportation from each exit point needs to be analyzed. Hence, we will calculate Total Runner Cost and Total Truck Cost.
In order to calculate the total runner cost we require distances to and from each exit point (Case Exhibit 8), Cost for each transport mode (Case Exhibit 9) and required number of annual runners for each exit point (Case Exhibit 10).
Using the data listed above, the cost is computed in a simple manner. An example for Airport to Icchra is given below:
-
On average 1 liter of diesel covers 9 km
-
The required distance to be covered as seen from Case Exhibit 8 is 25.8 km
-
Total amount if diesel required is 25.8/9 = 2.87
-
The diesel rate is 110
-
Cost from Airport to Icchra per route = 110 × 2.87 = 315.47
Using, the above method the Cost per Runner Matrix is computed in TN Exhibit 4. In order to get the total cost for runners, total numbers of runners travelling towards each exit point are multiplied with cost per runner towards each exit point. TN Exhibit 5 lists total costs per runners from each potential HQ location to each exit point.
Cost per truck and total truck costs are computed in a similar manner. Case Exhibit 8 lists distances to and from each exit point, Case Exhibit 9 lists fuel costs for each transport mode and number of annual trucks travelling towards each exit point are listed in Case Exhibit 11. The cost per truck for each exit point and total truck costs are provided in TN Exhibits 6 and 7 respectively.
Intra-city Transportation Cost Analysis Using Clusters
Earlier in the case study, routing for 14 customer locations were being studied, giving a very microscopic view for routing in Lahore. However, in reality OCS has a large number of customers encompassing the whole city, and hence routing analysis can no longer be done on a sample of clients. Thus, in our analysis Lahore has been divided into 5 different regions, and for each region the geographical mid-point has been taken giving their effective distances from each of the locations as shown in Case Exhibit 13. The only cost that needs to be calculated for intra-city is the rider cost, thus we will be using the same process as before, however the only difference will be that here clusters will be used instead of exit points.
The cost per rider has been given in Case Exhibit 12, this cost is fixed irrelevant of the route, and using this cost per rider needs to be calculated.
For example cost of a rider from Shadman using Icchra is done as follows:
-
On average 1 liter of diesel covers 50 km
-
The required distance to be covered as seen from Case Exhibit 13 is 6.3 km
-
Total amount if diesel required is 6.3/50 = 0.126
-
The diesel rate is 107
-
Cost from Shadman to Icchra per route = 107 × 0.126 = 13.482
Using, the above method the complete Cost per Rider is computed in TN Exhibit 8. This cost is only per rider, and in order to get the total cost the total numbers of riders are required. Case Exhibit 14 gives the annual number of riders required. We can calculate total rider cost by multiplying cost per rider with total riders. Total rider costs are depicted in TN Exhibit 9.
Comparison of Viable Options
Combining all the above solutions, we get a comparative cost analysis as shown in TN Exhibit 10. This analysis gives the total cost for each of the rider, runner and truck for Icchra, Airport and Saghian.
Keeping Icchra our base case, the airport’s cost is 1.87 times greater than Icchra whereas Saghian’s cost is only 1.09 times greater. Looking at these results alone, one may assume that if not Icchra, Saghian may be a better location to open a regional warehouse. However, in this analysis time is a crucial determining factor.
Moreover, the case study focuses on only relocating outbound deliveries to the Airport and using Icchra or Saghian for intra-city deliveries due to their central location. Hence, it is important to consider the hybrid analysis before making a final decision.
Question 3:
The case also indicates the use of Hybrid approach for network planning. What is it? Is it preferable? Why or why not?
Analysis:
The hybrid solution involves using different locations for intercity and intra-city transportation. The idea is to use either Airport or Saghian location as HQ location for central region where collection and sorting is performed. The intercity shipments originate from these two locations. For intra-city deliveries and pickups through riders, the plan is to use existing location at Icchra (which is in the center of Lahore city) for an origin and destination location. Thus the plan involves movement of Lahore bound deliveries and Lahore origin pickups (intra-city shipments) from Icchra and HQ location (either airport or Saghian) by using a runner.
Base Case
Before considering any other alternative solution we need to evaluate the current scenario. Case Exhibit 6 shows the outline of deliveries from Icchra to all its exit points:
Moving from the left, all deliveries coming from Karachi first arrive at the airport from where they are sorted at Icchra. Similarly, deliveries from Saghian, Motor Way, Grand Truck and Multan Road, which are located on the left of Icchra, are collected at Icchra. Once the sorting has been performed at Icchra, packages for different regions are made and are ready to be delivered. The exits are used for different cities are listed in Case Exhibit 7.
Hybrid Approach
Under the hybrid approach, Icchra will be the local warehouse, and either all deliveries will be collected at Saghian or the Airport. In order to evaluate an alternate solution, two scenarios need to be considered:
-
1.
Sorting all deliveries at the Airport, directly delivering outbound and sending all local deliveries to Icchra,
-
2.
Sorting all deliveries at Saghian, directly delivering outbound and sending all local deliveries to Saghian,
-
1.
All parcels collected at Airport and local parcels to Icchra—The figure in TN Exhibit 11 describes the new route.
TN Exhibit 11 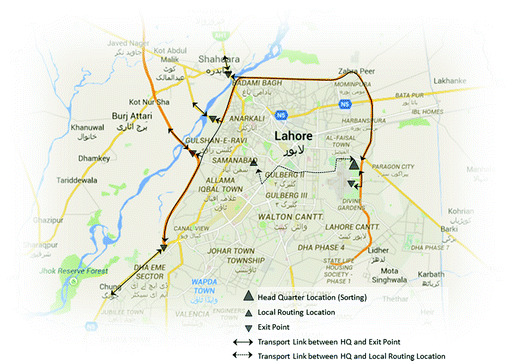
Hybrid approach option 1: Airport as HQ

Under this method, all outbound and inbound deliveries will first be collected at the airport. Once, this has been done, all deliveries to be made in Lahore will be sent to Icchra, whereas all deliveries to be made inter-city will directly leave from the airport, to their respective exit points via Ring Road. Thus, the only distance and time which will be changing will be when in Lahore, as once the deliveries reach their exit points the distance will remain the same.
If this method is implemented then to each route going towards Icchra 31 min will be added. These 31 minutes represent the time taken to travel from the Airport to Icchra, as all intra-city deliveries will first stop at Icchra and then be delivered from there. Thus, all outbound deliveries will no longer have to enter the heart of the city and therefore, saving time.
-
2.
All parcels collected at Saghian and local parcels sent to Icchra—The figure in TN Exhibit 12 describes the new route.
TN Exhibit 12 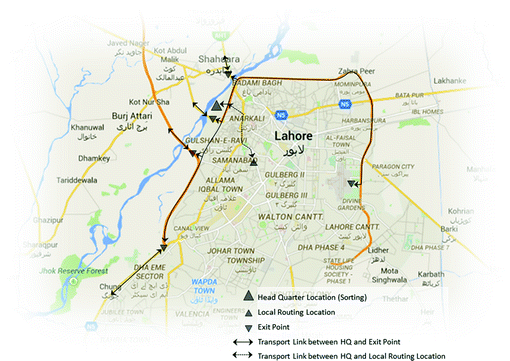
Hybrid approach option 1: Saghian as HQ

Under this method, all outbound and inbound deliveries will first be collected at Saghian. Once, this has been done, all deliveries to be made in Lahore will be sent to Icchra, whereas all deliveries to be made inter-city will directly leave from Saghian, to their respective exit points. Thus, the only distance and time which will be changing will be when in Lahore, as once the deliveries reach their exit points the distance will remain the same.
If this method is implemented then to each route going towards Saghian, 26 minutes will be added. These 26 minutes represent the time taken to travel from the airport to Saghian. The main reason to consider all routes from the airport is that this analysis is being done for Karachi parcels. Deliveries from Karachi and Lahore make 80% of the revenue hence; they are the core of our analysis. Once, all the deliveries have been accumulated at Saghian, all the parcels for Lahore will be sorted and sent to Icchra. Moreover, all outbound deliveries will be directly delivered from Saghian. Thus, all outbound deliveries will no longer have to enter the heart of the city and therefore, saving time.
Time Saving Analysis
Thus, to the actual time given before, for all routes towards OCS 31 minutes are added, whereas to all routes towards Saghian 26 minutes are added, as explained above. The main reason to adjust the time is that all deliveries within Lahore will be having a fixed element of travelling from the Airport due to the Karachi deliveries. The adjusted time is shown in TN Exhibit 13.
In order to find which option is better a time savings analysis needs to be done for sending outbound deliveries from Airport and Saghian. No time savings are incurred for the deliveries within Lahore, as in each case Icchra remains the delivery point (TN Exhibit 14)
In TN Exhibit 14 the column airport, represents the savings from only moving outbound deliveries from the airport and inbound deliveries from Icchra. Similarly, the column Saghian represents the savings of moving outbound deliveries from Saghian and inbound deliveries from Icchra.
For example for all deliveries going to Faisalabad, Saghian is used as the exit point—
-
If deliveries are directly made from the Airport, then 15 minutes are saved (45-30).
-
If deliveries are directly made from Saghian, then 26 minutes are saved (26-0).
As it can be inferred from the TN Exhibit 14, greater time savings are incurred by using the airport for sending all outbound deliveries.
Cost Comparison
If the hybrid solution is used, assuming maximum time savings at the airport, then each of the total runner and truck costs are taken for the airport. This is because all outbound deliveries will now be made from the airport. However, for local deliveries Icchra will be used and thus the rider costs will remain same. An additional runner cost will now be incurred, for sending all parcels from the airport to Icchra, and for bringing all parcels from Icchra to the airport. The detailed calculations are shown in TN Exhibit 15. This solution, results in a cost 1.43 times greater than the original cost, however the time savings are significant and cannot be overlooked.
Moreover, a similar cost analysis is also done for Saghian as the HQ and Icchra as the regional warehouse. This results in a cost of 3,069,993 which is 0.83 times of Icchra (TN Exhibit 16).
Qualitative Analysis
For each of the three viable locations a qualitative analysis should be performed, which will be an intuitive brain-storming process, as shown in TN Table 7.
Rights and permissions
Copyright information
© 2019 The Author(s)
About this chapter

Cite this chapter
Jalil, M.N., Shah, E. (2019). Overseas Courier Services, Pakistan: Logistics Operations at Central Region. In: Sikdar, A., Pereira, V. (eds) Business and Management Practices in South Asia. Palgrave Macmillan, Singapore. https://doi.org/10.1007/978-981-13-1399-8_10
Download citation
DOI: https://doi.org/10.1007/978-981-13-1399-8_10
Published:
Publisher Name: Palgrave Macmillan, Singapore
Print ISBN: 978-981-13-1398-1
Online ISBN: 978-981-13-1399-8
eBook Packages: Business and ManagementBusiness and Management (R0)