
Abstract
How will “population decline” change the shape of the “regions?” We examine how a declining population makes maintaining essential infrastructure increasingly difficult.
Access this chapter
Tax calculation will be finalised at checkout
Purchases are for personal use only
Notes
- 1.
MLIT 2014.
- 2.
IPSS 2013b.
- 3.
Made own projection beyond 2040 by extrapolation using the same assumptions, analyzed by Igarashi, Chikako, President, HIT (IPSS 2013b).
- 4.
MIC 2009.
- 5.
MHLW (2014).
- 6.
- 7.
AIRIA 2015.
- 8.
Analysis using 2040 Micro Population Data and 2010 Phone Directory DB Telepoints with Coordinates (provided by the University of Tokyo, CSIS, hereinafter referred to as “digital phone directory”).
- 9.
According to the digital phone directory.
- 10.
[Method of analysis] Micro population data uses mesh data to allocate the population at a building level using 2040 population projections and map information, the population estimates being performed by the Hokkaido Intellect Tank (HIT) and the map information data analysis by the University of Tokyo’s Center for Spatial Information Science (CSIS). Figure 3.13 is a flow chart on how the data was created. It should also be noted that because of the difficulty in predicting building distribution in 2040, it was assumed that the distribution and usage of buildings in 2010 would pertain (NB: The survey period of house mapping was 2008 to 2009).
Fig. 3.13 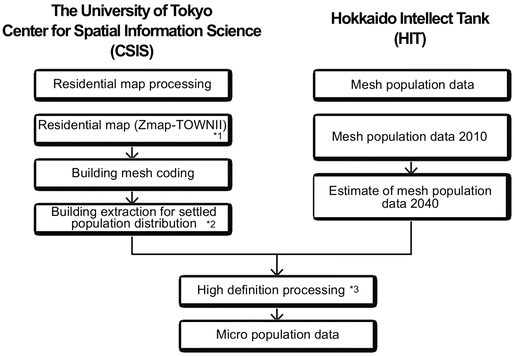
Flow chart of the method of analysis
(*1) Residential map building polygons carry attribute information, such as office, residential, shared building.
(*2) Buildings for settled population distribution are extracted. They are divided into residential, shared building or other. If they are none of these, they become candidate allocation destinations for businesses.
(*3) The total floor area of a building is determined by its floor space and the number of floors, with settled population allocated thereto.
(Note) The above technique is an application of part of the non-aggregate reduction and allocation method for existing demographics.
- 11.
In fact, a detailed trading area for each store has been set and in many cases, even in small municipalities, just because you are out of the 5-kilometer radius does not necessarily mean you are outside the trading area.
- 12.
Estimated from the microlevel population projection data produced by the CSIS, University of Tokyo, by combining the 2010 microlevel population data produced by Akiyama Yuki, assistant professor at CSIS, University of Tokyo, and the 500 m mesh aggregated population projection data (2010–2040) produced by HIT; general incorporated association and the 2010 Digital Phonebook (number of supermarket stores).
- 13.
JFA 2015.
- 14.
Estimated data produced in combination from CSIS, University of Tokyo, HIT and 2010 Digital Phonebook.
- 15.
ANRE 2014.
- 16.
MIC 2008.
- 17.
“Integrated community care” had existed as a concept since the bottom half of the 1970s. The system itself came under discussions in the Nursing Care Insurance Subcommittee of the Social Security Council in June 2010, and an aspirational provision was added to the law in 2011.
- 18.
Since integration of public primary and junior schools was announced in September 27, 1973 by Minister of Education, Culture, Sports, Science and Technology, the concept was passed onto and reflected in the new announcement in 2015 (MEXT 2015).
- 19.
More information on Akita International University can be found on their website: http://web.aiu.ac.jp/undergraduate
- 20.
More information on Hokkaido Mikasa High school can be found in their website: http://www.city.mikasa.hokkaido.jp/highschool/
- 21.
Otoineppu 2015.
- 22.
MLIT n.d.
- 23.
Kinki District Transport Bureau 2004.
- 24.
MLIT 2007.
- 25.
Tobetsu n.d.
- 26.
MLIT 2012.
- 27.
IPSS 2013a.
- 28.
IPSS 2013a.
- 29.
IPSS 2011.
- 30.
Cabinet Office 2010.

References
Automobile Inspection & Registration Information Association. (2015). 1.069 Automobiles per household—Ratio stays flat from previous year (Issetai atari 1.069 dai de zennendosuijun) (Press release, August). http://www.airia.or.jp/publish/file/r5c6pv0000003pun-att/r5c6pv0000003pv2.pdf, accessed on September 25, 2016 (in Japanese).
ANRE. (2014, July 8). Trends of volatile oil distributors and the number of gas stations based on registration (Kihatsuyu hanbaigyosha oyobi kyuyujo no suii). http://www.enecho.meti.go.jp/category/resources_and_fuel/distribution/hinnkakuhou/data/20140708_ss25fy.pdf, accessed on September 25, 2016 (in Japanese).
Cabinet Office, Government of Japan. (2010, July). Research of Social withdrawal (Wakamono ishikini kansuru chosa (hikikomori ni kansuru jittai chosa) hokokusho). http://www8.cao.go.jp/youth/kenkyu/hikikomori/pdf/gaiyo.pdf, accessed on September 25, 2016 (in Japanese).
Cabinet Office, Government of Japan. (2014, December). Headquarters for Overcoming Decline and Vitalizing Local Economy in Japan, Japan’s Long-term Vision and Comprehensive Strategy, http://www.kantei.go.jp/jp/singi/sousei/info/pdf/panf_eng.pdf, accessed on February 16, 2017.
IPSS. (2011). Attitudes toward marriage and family among Japanese singles: The fourteenth Japanese national fertility survey in 2010—highlights of the survey results on singles. http://www.ipss.go.jp/site-ad/index_english/nfs14/Nfs14_Singles_Eng.pdf, accessed on September 25, 2016.
IPSS. (2012). Japan’s population forecast (Nihon no shorai suikei jinko), January 2012. http://www.ipss.go.jp/syoushika/tohkei/newest04/sh2401top.html, accessed on August 14, 2017.
IPSS. (2013a). Future Projections of Household for Japan (National Estimate) (Nihon no setai su no shorai suikei zenkoku suikei), January 2013. http://www.ipss.go.jp/pp-ajsetai/j/HPRJ2013/t-page.asp, accessed on August 14, 2017
IPSS. (2013b). Japan’s population forecast by region (Nihon no chiiki-betsu shorai suikei jinko). http://www.ipss.go.jp/pp-shicyoson/j/shicyoson13/1kouhyo/gaiyo.pdf, accessed on 2016, September 22 (in Japanese).
JFA. (2015). Convenience store statistics data (Konbiniensu sutoa tokei deta). http://www.jfa-fc.or.jp/particle/320.html, accessed on September 25, 2016 (in Japanese).
Kinki District Transport Bureau. (2004, March). Community Bus Introduction Guide.
MEXT. (2015, January 27). Notice by Minister of education, culture, sports, science and technology. http://www.mext.go.jp/a_menu/shotou/shugaku/detail/1354768.htm, accessed on September 25, 2016 (in Japanese).
MHLW (2014). Vital Statistics of Japan. (2013-nen Jinkou Doutai Hakusyo kakutei chi no gaikyou, Hyou 3-2) http://www.mhlw.go.jp/toukei/saikin/hw/jinkou/kakutei13/index.html, accessed on August 8, 2017
MIC. (2009). Statistics Bureau, 2009 Economic census for business frame. http://www.stat.go.jp/english/data/e-census/, accessed on September 22, 2016.
MIC. (2008). Excellent business cases of year 2008 (Heisei 20-nendo yuryo jirei shu). http://www.soumu.go.jp/main_content/000063250.pdf, accessed on September 25, 2016 (in Japanese).
MIC. (2014). Statistics Bureau, Report on Internal Migration in Japan 2014, http://www.e-stat.go.jp/SG1/estat/ListE.do?lid=000001129143, accessed on February 16, 2017.
MIC. (2015). Future with ICT (Heisei 27nen hakusho, dainibu, ICT ga hiraku mirai). http://www.soumu.go.jp/johotsusintokei/whitepaper/ja/h27/html/nc231110.html, accessed on September 25, 2016 (in Japanese).
MLIT. (2007). On-demand bus service using taxi (Ippan no takusi wo riyoshita demando sabisu). http://www.mlit.go.jp/sogoseisaku/transport/pdf/010_shizukuishi.pdf, accessed on September 25, 2016 (in Japanese).
MLIT. (2012). Manual to sustain, maintain and improve regional public transportation (Chiiki kokyo kotsu kakuho iji kaizen ni muketa torikumi manyuaru). http://wwwtb.mlit.go.jp/kinki/kansai/program/manual.htm, accessed on September 25, 2016 (in Japanese).
MLIT. (2014). Grand design of national spatial development towards 2050, Japan—Creation of a country generating diverse synergies among regions (Kokudo no gurando dezain 2050). http://www.mlit.go.jp/common/001088248.pdf, accessed on September 22, 2016.
MLIT. (n.d.). Community bus (Komyuniti basu). http://www.mlit.go.jp/jidosha/anzen/01transit/communitybus.html, accessed on September 25, 2016 (in Japanese).
Otoineppu Village. (2015, March). Comprehensive plan of Otoineppu village, No.5 (Otoineppu mura sogo keikaku dai 5), http://www.vill.otoineppu.hokkaido.jp/gyousei/keikaku/files/otoineppu_general_plan.pdf, accessed on September 25, 2016 (in Japanese).
Tachibana, Toshiaki. (2011). Isolated Society—how networking of family, community and work has collapsed (Muenshakai no shotai ketsuen chien shaen wa ikanihokaishitaka). Tokyo: PHP.
Tobetsu. (n.d.). Tobetsu community bus (Tobetsu fureai basu). https://www.town.tobetsu.hokkaido.jp/site/fureai-bus/, accessed on September 25, 2016.
Author information
Authors and Affiliations
Editor information
Editors and Affiliations
Rights and permissions
Copyright information
© 2018 Rebuild Japan Initiative Foundation
About this chapter

Cite this chapter
Chikako, I., Yuki, A., Kenichi, K. (2018). A Collapse in Regional Infrastructure. In: Funabashi, Y. (eds) Japan’s Population Implosion. Palgrave Macmillan, Singapore. https://doi.org/10.1007/978-981-10-4983-5_3
Download citation
DOI: https://doi.org/10.1007/978-981-10-4983-5_3
Published:
Publisher Name: Palgrave Macmillan, Singapore
Print ISBN: 978-981-10-4982-8
Online ISBN: 978-981-10-4983-5
eBook Packages: Social SciencesSocial Sciences (R0)