
Abstract
In this chapter we show that the pattern of the direction of polarization of sunlit grasslands and sunlit tree canopies is qualitatively the same as that of the clear sky. Since the mirror symmetry axis of this pattern is the solar–antisolar meridian, the azimuth direction of the sun, occluded by vegetation, can be assessed in forests from this polarization pattern. This robust polarization feature of the optical environment in forests can be important for forest-inhabiting animals that make use of linearly polarized light for orientation. Here we also present an atmospheric optical and receptor-physiological explanation of why longer wavelengths are advantageous for the perception of polarization of downwelling light under canopies illuminated by the setting sun. This explains why the upward-pointing ommatidia of the dusk-active cockchafers, Melolontha melolontha, detect the polarization of downwelling light in the green part of the spectrum. We show that the polarization vision in Melolontha melolontha is tuned to the high polarized intensity of downwelling light under canopies during sunset. This is an optimal compromise between simultaneous maximization of the quantum catch and the quantum catch difference.
1 How the Azimuth of the Foliage-Occluded Sun Can Be Determined from the E-Vector Pattern of Sunlit Forest Canopies
Polarimetric remote sensing has numerous applications in the field of agriculture (Kong 1990), and many of the methods used exploit information of polarized light reflected from vegetation (Coulson 1988). The polarization signature of vegetated surfaces can be used to distinguish different types of crops and to indicate developmental states and possible stress factors (e.g. water deficiency, disease, excessive salinity) that could affect production (Brines and Gould 1982; Vanderbilt and Grant 1985; Vanderbilt et al. 1985a, b; Grant et al. 1987a, b, 1993). The optical environment in forests has complex spatial distributions of light intensity and colour (Endler 1993), and the polarized light field is equally complex. Brines and Gould (1982) hypothesized that under certain circumstances, biologically significant Rayleigh polarization patterns may exist against overhead vegetation at ultraviolet (UV) wavelengths. Using imaging polarimetry, Shashar et al. (1998) studied the linear polarization of light in a tropical rain forest. They found that the celestial polarization pattern remains visible underneath the forest canopy, provided patches of clear (blue) sky are visible through the overhead vegetation. They characterized some distinct light environments in the forest, each having a typical linearly polarized light field. They concluded that polarization-based animal navigation would be limited to spaces exposed to several extended portions of the blue sky and that other forms of orientation throughout the forest would include remote sensing of surface features, object detection and camouflage violations. Horváth et al. (2002a) measured the polarization patterns of some plant leaves by imaging polarimetry. They showed that these patterns are complex and strongly depend on the surface characteristics of the leaf, the orientation of the leaf blade and the illumination conditions.
Since polarization patterns in the entire upper hemisphere of the visual environment of forests could be important for forest-inhabiting animals that make use of polarization patterns for orientation, Hegedüs et al. (2007a) measured the 180° field-of-view polarization patterns of the overhead foliage in a variety of forest types by full-sky imaging polarimetry. From a hot air balloon, Horváth et al. (2002b) and Hegedüs et al. (2007a) measured the polarization patterns of grasslands lit by the rising sun (at a solar elevation angle of 4.5°) at heights of 100–200 m above ground. They found that the pattern of the angle of polarization α of the upwelling light from sunlit grasslands (Fig. 17.1) and that of the downwelling light from sunlit tree canopies (Fig. 17.2) are qualitatively the same as that of the corresponding sky with the same sun position (Fig. 17.3), independently of the solar elevation and the sky conditions. They also showed that contrary to an earlier assumption, the α-pattern characteristic of the sky (Fig. 17.3) always remains visible underneath overhead vegetation, independently of the solar elevation and the sky conditions (clear or partly cloudy with visible sun’s disc), provided the foliage is sunlit (Fig. 17.4) and not only when large patches of the clear sky are visible through the vegetation. Since the mirror symmetry axis of the α-pattern of the sunlit foliage is the solar–antisolar meridian, the azimuth direction of the sun occluded by vegetation can be assessed in forests from this robust polarization pattern. The α-patterns of skies and vegetations have the following characteristics (Hegedüs et al. 2007a):

Photograph and patterns of the angle of polarization α from the local meridian of a grassland lit by the rising sun measured by 180° field-of-view imaging polarimetry in the red, green and blue parts of the spectrum. The measurements were performed from a hot air balloon at an altitude of 100 m. The optical axis of the polarimeter’s fish-eye lens pointed towards the nadir, which is the centre of the circular patterns [after Fig. 2 on page 6025 of Hegedüs et al. (2007a)]

Photograph and patterns of the angle of polarization α from the local meridian of a clear sky with the overhead vegetation of a forest composed of birch trees lit by the setting sun measured by full-sky imaging polarimetry in the red, green and blue parts of the spectrum. In pattern b black shows the tree foliage and white indicates the sky [after Fig. 3 on page 6026 of Hegedüs et al. (2007a)]

Photograph and patterns of the angle of polarization α from the local meridian of a clear sky, measured by full-sky imaging polarimetry in the red, green and blue parts of the spectrum. The optical axis of the polarimeter’s fish-eye lens was vertical; thus, the horizon is the perimeter, and the centre of the circular patterns is the zenith. At the perimeter of the circular colour picture, the dark silhouette of trees can be seen. The sun near the horizon was occluded by a small black disc placed on a thin wire, which is seen radially in the circular patterns [after Fig. 1 on page 6023 of Hegedüs et al. (2007a)]

Photographs and patterns of the angle of polarization α of skies and tree canopies measured in the blue (450 nm) part of the spectrum. Quite similar α-patterns were obtained in the green and red spectral ranges [after Fig. 4 on page 6027 of Hegedüs et al. (2007a)]
-
The α of light from the clear sky has a typical pattern (Fig. 17.3): The isolines with α = constant are always 8 shaped with a cross-point at the zenith and an axis of mirror symmetry coinciding with the solar–antisolar meridian in such a way that the smaller loop of the figure-8 occurs consistently in the solar half of the sky. (The crossing of the α-isolines at the zenith is purely a geometrical artefact and the consequence of the definition of α rather than a true polarization singularity.) Depending on the wavelength, solar elevation and atmospheric turbidity, the noisiness n of α of the clear sky (n denotes how noisy is the α-pattern compared to the white noise: n = 0 %, no noise; n = 100 %, white noise) is 2 % ≤ n clear ≤ 7 %. If the sky is partly cloudy or overcast, the α-pattern remains qualitatively the same (apart from heavily overcast skies) as that of the clear sky. Depending on the degree of cloudiness and the wavelength, the noisiness n of α of partly cloudy and overcast skies is 5 % ≤ n cloudy ≤ 21 % and 14 % ≤ n overcast ≤ 35 %. Hence, as the cloudiness increases, the noisiness n of α increases, but the α-pattern remains qualitatively the same.
-
Depending on the wavelength, the noisiness n of α of the grass-reflected sunlight ranges from 11 to 16 %, but the α-pattern of the sunlit grassland is qualitatively the same as that of the clear sky: The α-pattern is characterized by the typical figure-8 pattern, the mirror symmetry axis of which is the solar–antisolar meridian (Fig. 17.1).
-
Depending on the wavelength, the sky conditions and the foliage ratio f (=percentage of vegetation in the celestial hemisphere), the noisiness n of the α-pattern of skies with overhead vegetation is 19 % ≤ n foliage ≤ 51 %. If the foliage is sunlit, the α-pattern of the overhead vegetation is qualitatively the same as that of the clear sky: The α-isolines have the typical figure-8 pattern with a mirror symmetry axis along the solar–antisolar meridian, independently of the solar elevation and the sky conditions (clear or partly cloudy with visible sun’s disc). Under the same sky conditions, the 8-shaped α-isolines of tree canopies (Figs. 17.2 and 17.4) are slightly expanded compared to the corresponding α-isolines of clear skies (Fig. 17.3), so that the Arago, Babinet or Brewster neutral points can disappear (Fig. 17.5): The α-pattern of the overhead vegetation resembles more the theoretical Rayleigh pattern than the real (measured) one or the theoretical pattern of Berry et al. (2004).
Fig. 17.5 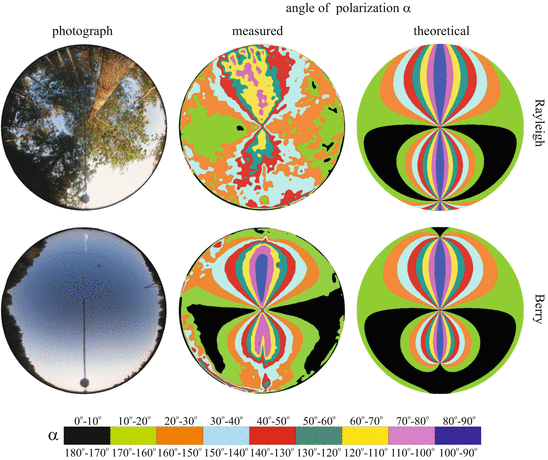
Left and middle columns: Photographs and the patterns of the angle of polarization α of a tree canopy and a clear sky measured by full-sky imaging polarimetry in the blue (450 nm) part of the spectrum under the same sky conditions. Right column: Theoretical α-patterns calculated on the basis of the single-scattering Rayleigh model and the model of Berry et al. (2004). For the sake of easier comparisons, the circular pictures and patterns were rotated so that the solar–antisolar meridian became vertical in both cases [after Fig. 6 on page 6030 of Hegedüs et al. (2007a)]
-
If the overhead vegetation is not sunlit, because the sun is below the horizon, or is occluded by clouds, then the α-pattern of the foliage is extremely distorted so that there is no trace of mirror symmetry (see skies S9, S10 and S11 in Fig. 17.4) and the noisiness of α is rather large (37 % ≤ n foliage ≤ 43 %).

The surface of leaves reflects, scatters and transmits the incident light (Woolley 1971). Leaf reflectance is an intermediate between that of a perfectly diffuse Lambert reflector (reflecting the incident light uniformly into all directions) and a perfectly specular Fresnel reflector (being a smooth interface between two different dielectric media, the polarizing ability of which is described by Fresnel’s laws of reflection). It is the sum of diffuse and specular components (Grant 1987). The diffuse component is unpolarized and varies little with changing angles, and its spectrum is characteristic to the (usually green) leaf tissue. The specular component is partially linearly polarized, is reflected from the outermost leaf surface (cuticle), spreads about the specular direction and has a spectrum that is practically the same as that of the incident light (Grant et al. 1993).
The physical reasons for the finding of Hegedüs et al. (2007a) that the pattern of the angle of polarization α (or the E-vector direction) of the sunlit foliage is qualitatively the same as that of the clear sky (Figs. 17.1, 17.2, 17.3 and 17.4), i.e. the direction of polarization of light from the sunlit overhead vegetation is approximately perpendicular to the plane determined by the observer, the sun and the leaf observed, are the following: Fig. 17.6 shows schematically the nine components (T-SU, T-SK, T-LE, S-SU, S-SK, S-LE, D-SU, D-SK, D-LE) of light from the foliage and their polarization characteristics. A particular leaf of the foliage is illuminated by sunlight (SU) and/or skylight (SK) and/or light from the neighbouring leaves (i.e. leaflight, LE). SU is unpolarized (with degree of linear polarization d = 0), while SK and LE are partially polarized (d > 0) due to scattering–polarization and reflection–polarization of sunlight in the atmosphere and at the leaf blades, respectively (Können 1985; Coulson 1988; Grant et al. 1993; Horváth et al. 2002a). The leaflight has two main components: light transmitted through the leaves (Fig. 17.6a) and light reflected from the leaves (Fig. 17.6b). The former possesses three further components: the sunlight (T-SU), skylight (T-SK) and leaflight (T-LE) transmitted through the leaves. T-SU, T-SK and T-LE are practically unpolarized (d ≈ 0) because of the diffuse scattering and multiple reflection of light (SU, SK, LE) within the leaf tissue (Können 1985; Coulson 1988; Grant et al. 1993; Horváth et al. 2002a) (Fig. 17.6a).

Schematic representation of the polarization characteristics of the different components (SU, S-SK, S-LE, D-SU, D-SK, D-LE, T-SU, T-SK, T-LE) of light transmitted (a) and reflected (b) by a leaf in the foliage lit by sunlight and skylight. Circles and ellipses with double-headed arrows represent unpolarized and partially linearly polarized light, respectively. SU: sunlight (unpolarized); SK: skylight (partially polarized); LE: leaflight (partially polarized); S-SU, S-SK and S-LE: specularly reflected sunlight, skylight and leaflight (partially polarized); D-SU, D-SK and D-LE: diffusely reflected sunlight, skylight and leaflight (unpolarized); T-SU, T-SK and T-LE: transmitted sunlight, skylight and leaflight (unpolarized) [after Fig. 5 on page 6029 of Hegedüs et al. (2007a)]
Light can be reflected from a leaf either diffusely by the leaf tissue and its rough outer surface (due to hairs or wax) or specularly from smooth leaf cuticle (Coulson 1988; Grant et al. 1993; Horváth et al. 2002a) (Fig. 17.6b). If the incident light (SU, SK, LE) penetrates into the leaf tissue, it can either be diffusely reflected into all directions after multiple scattering on and reflection from the plant cells (D-SU, D-SK, D-LE) or be transmitted diffusely through the leaf (T-SU, T-SK, T-LE). The diffusely reflected components D-SU, D-SK and D-LE are practically unpolarized (d ≈ 0) (Grant et al. 1993; Horváth et al. 2002a). The specularly reflected components S-SU, S-SK and S-LE are partially polarized (Coulson 1988; Grant et al. 1993; Horváth et al. 2002a). According to Fresnel’s laws of reflection (Azzam and Bashara 1992), the direction of polarization of specularly reflected light is perpendicular to the plane of reflection determined by the incident light, reflected light and the local normal vector of the reflecting surface. Thus, the direction of polarization of S-SU is perpendicular to the plane containing the observer, the sun and the observed point of a sunlit leaf. The direction of polarization of the other two specularly reflected components S-SK and S-LE is usually tilted to this plane, because the direction of the incident skylight (SK) and leaflight (LE) is generally different from that of the sunlight (SU).
From these it follows that among the nine components of leaflight, only the sunlight reflected specularly from the smooth cuticle of leaves (S-SU) can result in directions of polarization perpendicular to the plane of reflection passing through the observer, the sun and the observed sunlit leaf of the foliage. This S-SU component is the reason for the white gloss of shiny, smooth sunlit leaves. This highly or moderately polarized, cuticle-reflected gloss often overwhelms the unpolarized green light reflected diffusely from the leaf tissue. According to Können (1985), in the foliage there can be many leaves oriented in many different directions, but the gloss of the foliage as a whole is tangentially polarized with respect to the sun, i.e. perpendicular to the plane of reflection.
The above qualitative optical model also explains why under the same sky conditions the 8-shaped α-isolines of tree canopies expand relative to those of the clear sky, so that the neutral points may disappear (Fig. 17.5): Since the S-SU component, per definition, practically corresponds to the single scattering of light, the α-pattern of sunlit overhead vegetation resembles the Rayleigh pattern. The α-pattern of the clear sky more or less deviates from the Rayleigh pattern due to multiple scattering of light in the air (see Subchapter 18.2).
Thus, if the vegetation is sunlit, the E-vector pattern of the foliage is qualitatively the same as that of the clear sky. The same holds true for moonlit scenes at night, when the main source of light is sunlight reflected by the moon, if the latter is not occluded by clouds. The main reason for this phenomenon is the polarization effect of the S-SU component of leaflight. Consequently, the illumination of the foliage by direct sunlight plays an important role, while solar elevation and sky conditions (clear or partly cloudy with visible sun’s disc) are irrelevant. The deviations of the α-pattern of the sunlit vegetation from that of the clear sky are the consequences of the polarization characteristics of the other eight components T-SU, T-SK, T-LE, S-SK, S-LE, D-SU, D-SK and D-LE of leaflight. The larger the contribution of these eight components to the net leaflight, the greater these deviations. If the sun is occluded by clouds, the foliage is not sunlit; thus, the S-SU component does not exist, and consequently the α-pattern of the foliage differs considerably from that of the clear sky (see skies S9, S10 and S11 in Fig. 17.4).
Earlier, it has been shown that the E-vector pattern of the sky during full moon at night (Gál et al. 2001) and during the day under smoky (Hegedüs et al. 2007b), foggy (Hegedüs et al. 2007c) and partly cloudy (Brines and Gould 1982; Pomozi et al. 2001; Suhai and Horváth 2004; Hegedüs et al. 2007c) as well as total overcast conditions (Hegedüs et al. 2007d) is qualitatively the same as that of the clear, sunlit sky. The polarimetric results presented in this subchapter supplement these earlier findings, demonstrating that the distribution of the angle of polarization is a very stable pattern in the optical environment encompassing both sunlit and moonlit skies and including furthermore sunlit grassland and overhead vegetation.
Since the mirror symmetry axis of the E-vector pattern of the sunlit overhead vegetation is always the solar–antisolar meridian, the azimuth direction of the sun occluded by foliage in forests can be assessed from this polarization pattern. For instance, tropical honeybees (the ancestors of all recent bees), living and dancing on exposed limbs in tropical forests, are frequently confronted with the problem of orientation underneath sunlit overhead vegetation (Wilson 1971). Hegedüs et al. (2007a) proposed the following scenario for the evolution of polarization-based navigation in bees: In the ancient bees, living in forests, the ability to perceive downwelling polarized leaflight has evolved in the UV part of the spectrum in order to assess the azimuth direction of the invisible sun (occluded by foliage) from the E-vector pattern of the sunlit overhead vegetation for navigational purposes. Later, when the descendants of these ancient bees dispersed from the tropical forests into other regions, this ability was used to perceive polarization of the skylight in the UV even under cloudy conditions in order to determine the azimuth of the sun, hidden by clouds, for the purpose of orientation. According to this hypothesis, the perception of polarized leaflight in forests for navigational purposes preceded the detection of polarized skylight and the use of direct celestial polarization for orientation purposes.
2 Why Do Dusk-Active Cockchafers Sense Downwelling Polarization in the Green Spectral Range?
In insects, the linear polarization of downwelling light (skylight or light from the tree canopy) is detected by upward-pointing ommatidia in the so-called dorsal rim area (DRA) of the compound eye. These ommatidia are anatomically and physiologically specialized and contain two sets of monochromatic and highly polarization-sensitive photoreceptors with orthogonal microvilli directions (Labhart and Meyer 1999). The spectral type of the DRA receptors is ultraviolet (UV) in flies, honeybees, desert ants, certain scarab beetles and spiders, for example, while blue in crickets, desert locusts and cockroaches [Table 10.1 of Horváth and Varjú (2004), p. 54; Table 1 of Barta and Horváth (2004)].
Explanations for cricket preference of the blue spectral range for detection of skylight polarization have been discussed by Labhart et al. (1984), Herzmann and Labhart (1989), Zufall et al. (1989), Horváth and Varjú (2004) and Barta and Horváth (2004). The cricket Gryllus campestris, for instance, is active not only during the day but also during crepuscular periods (dusk and dawn) and at night, having highly polarization-sensitive blue receptors in its DRA. Horváth and Varjú (2004, pp. 53–73) and Barta and Horváth (2004) showed that the degree of linear polarization d cloudy of light from cloudy parts of the sky is always relatively high in the violet and blue (400 nm < λ < 470 nm), rendering the violet-blue the second optimal spectral range after the UV (in which d cloudy is maximal) for detection of skylight polarization under partly cloudy conditions. Using the blue portion of the spectrum has a significant advantage over using UV under clear skies, when the degree of skylight polarization is sufficiently high for all wavelengths (Fig. 17.7a). The intensity I of the UV component of sunlight (Fig. 17.7b, c) and light from the clear sky is low relative to that of the blue and green components. At twilight under clear sky, the light intensity is more likely to fall below the sensitivity threshold of a polarization-sensitive visual system operating in the UV rather than in the blue. According to Zufall et al. (1989), the combination of blue spectral and polarization sensitivity in the DRA may be a common adaptation of insects that are active at circumstances of very low light intensities, as opposed to day-active insects (e.g. honeybees, desert ants and flies) which predominantly use UV receptors as detectors for skylight polarization [see Table 10.1 of Horváth and Varjú (2004, p 54)]. However, the question is whether this argument also holds for cloudy conditions. On the one hand, detection of skylight may be more disadvantageous in the UV than in the blue, because under cloudy conditions the UV component of skylight is much weaker than under clear sky. On the other hand, perception of skylight polarization could be more advantageous in the UV than in the blue, because under cloudy skies d cloudy is the highest in the UV [see Fig. 4 of Barta and Horváth (2004)]. The question is, which effect is the stronger one?

(a) Degree of linear polarization d sc versus wavelength λ of scattered light from clear sky measured at 90° from the sun for a solar zenith angle θ = 80° (Coulson 1988, p. 285). (b) Relative irradiance IRRSun(λ, θ) of unpolarized direct sunlight for solar zenith angles θ = 30°, 50°, 70°, 80°, 85°, 86°, 87°, 88°, 89° and 90° (top to bottom), computed on the basis of the 1976 US Standard Atmosphere. (c) Relative solar photon flux I Sun(λ, θ) for solar zenith angles θ = 30°, 50°, 70°, 80°, 85°, 86°, 87°, 88°, 89° and 90° (top to bottom) [after Fig. 1 on page 232 of Hegedüs et al. (2006)]
The perception of skylight polarization in the UV by several insect species is surprising, because both the degree of polarization d (Fig. 17.7a) and the intensity I of light from the clear sky are considerably lower in the UV than in the blue or green. This is the so-called UV-sky-pol paradox. Horváth and Varjú (2004, pp. 53–73) and Barta and Horváth (2004) have presented a quantitative resolution to this paradox. They proved by model calculations that if the air layer between a cloud and a ground-based observer is partly sunlit at higher solar elevations, d of skylight originating from the cloudy region is highest in the UV [see Fig. 4 of Barta and Horváth (2004)], because in this spectral range the unpolarized UV-deficient cloudlight dilutes the polarized light scattered in the air beneath the cloud the least. Similarly, if the air under foliage is partly illuminated by a high sun, d of downwelling light from the canopied region is maximal in the UV [see Fig. 5 of Barta and Horváth (2004)], because in this spectral range the unpolarized UV-deficient green canopylight dilutes the polarized light scattered in the air beneath the canopy the least. Therefore, in daylight the detection of polarization of downwelling light under clouds or canopies is most advantageous in the UV, in which spectral range the risk is smallest that d is lower than the threshold d threshold of polarization sensitivity in animals. On the other hand, under clear skies there is no favoured wavelength for perception of celestial polarization, because d of skylight is sufficiently high (d > d threshold) at all wavelengths. Horváth and Varjú (2004) and Barta and Horváth (2004) have also shown that there is an analogy between the detection of UV skylight polarization and the polarotactic water detection in the UV. The atmospheric optical explanation and computational model of Barta and Horváth (2004) and Horváth and Varjú (2004, pp. 53–73)—to explain why is it advantageous for animals to detect celestial polarization in the ultraviolet—were experimentally corroborated by Wang et al. (2014), who used a sky-polarimetric approach and built a polarized skylight sensor that modelled the processing of polarization signals by insect photoreceptors in the UV, visible and near-infrared spectral ranges. They showed that light from the cloudy sky has maximal degree of polarization in the UV, and under both clear and cloudy skies the angle of polarization of skylight can be measured/detected with a higher accuracy in the UV than in the visible spectral range.
The above-mentioned atmospheric optical reasons explain why certain insects detect the polarization of downwelling light either in the UV or in the blue part of the spectrum. There are, however, at least two insect species in which the DRA receptors are green sensitive: In the DRA retina of the European cockchafer, Melolontha melolontha, polarization is detected by receptors with maximal sensitivity at λ max = 520 nm (Labhart et al. 1992), and in the tenebrionid desert beetle, Parastizopus armaticeps, at λ max = 540 nm (Bisch 1999). Hegedüs et al. (2006) gave an atmospheric optical and receptor-physiological model to explain why longer wavelengths (green and red) are advantageous in the perception of the polarization of downwelling light under canopies illuminated by the setting sun. Their explanation focused on illumination situations in a canopied optical environment at sunset, because cockchafers are active at dusk and fly predominantly under canopies during their swarming, feeding and mating periods (Schneider 1952).
Brines and Gould (1982), Pomozi et al. (2001) and Suhai and Horváth (2004) have experimentally shown that the E-vector (or direction or angle of polarization) pattern of clouded celestial regions is approximately the same as that of the corresponding clear sky regions (see also Chap. 18). Pomozi et al. (2001) have also demonstrated that in the visible part of the spectrum under partly cloudy conditions, the shorter the wavelength λ, the greater the proportion k of the celestial polarization pattern suitable for animal orientation. Hence, k is determined primarily by the degree of polarization d(λ) of skylight, for which Barta and Horváth (2004) have presented a quantitative estimation. Hegedüs et al. (2006) showed that the E-vector pattern under canopies illuminated by sunlight is nearly the same as that under clear sky at the same solar position (see Sect. 17.1). Consequently, d(λ) of downwelling light under canopy is what determines k. However, because the detectability of light polarization also depends on the light intensity I, the polarized intensity PI(λ) = d(λ)⋅I(λ) also has to be taken into account in the estimation of the spectral region that is optimal for orientation by means of the polarization of downwelling light under canopies.
Using three atmospheric optical models (Fig. 17.8), Hegedüs et al. (2006) computed the degree of polarization d(λ) (Fig. 17.9) and the polarized intensity PI(λ) = d(λ)⋅I(λ) (Fig. 17.10) of downwelling light under canopies. The at-ground direct-normal spectral solar irradiance, IRRSun(λ, θ) (Fig. 17.7b), was calculated from MODTRAN (MODerate resolution TRANsmittance code, Berk et al. 1983), where θ is the solar zenith angle (=0° for sun at the zenith and 90° for sun on the horizon). The solar irradiance spectrum IRRSun(λ, θ) gives the energy of solar radiation per unit time, per unit area and per unit wavelength interval. Since photoreceptors respond to photon flux rather than photon energy, IRRSun(λ, θ) was converted to solar photon flux I Sun(λ, θ) = λ⋅IRRSun(λ, θ)/hc, where h is the Planck constant and c is the velocity of light in vacuum. I Sun(λ, θ) (Fig. 17.7c) gives the number of photons of solar radiation per unit time, per unit area and per unit wavelength interval and is called the intensity of sunlight further on.

Schematic representation of the two components of light reaching a cockchafer under a canopy in the case of the three atmospheric optical models of Hegedüs et al. (2006). In all three models the first component, called canopylight (1), is the unpolarized green light transmitted through the canopy. The second component is the partially polarized sunlight (A) scattered in the air layer between the canopy and the cockchafer or (B) reflected from the leaf cuticle or (C) reflected by both the leaf tissue and cuticle [after Fig. 2 on page 234 of Hegedüs et al. (2006)]

Degree of polarization d(λ, a) of downwelling light under a canopy calculated from the atmospheric optical models A, B and C of Hegedüs et al. (2006) for control parameter a = 1 at solar zenith angle θ = 90°. The control parameter a is the ratio of the first (unpolarized) and second (partially polarized) components of downwelling light. Qualitatively similar results were obtained for other values of θ and a. Increasing a means increasing the proportion of partially polarized sunlight scattered underneath the canopy (model A), reflected from the leaf cuticle (model B) or reflected by both the leaf tissue and cuticle (model C) [after Fig. 3 on page 236 of Hegedüs et al. (2006)]

PI(λ)/a, where PI(λ) = d(λ)⋅I(λ) is the polarized intensity of downwelling light under a canopy and a is the control parameter, calculated from the atmospheric optical models A, B and C of Hegedüs et al. (2006) for solar zenith angles θ = 85° and 90°. Qualitatively similar results were obtained for other values of θ [after Fig. 4 on page 237 of Hegedüs et al. (2006)]
In the models of Hegedüs et al. (2006), the downwelling light under canopies illuminated by direct sunlight with solar spectrum I Sun(λ, θ) had two components with a weighting factor a (control parameter) describing the ratio of the first (unpolarized) and second (polarized) components (Fig. 17.8): (1) The first component, the unpolarized green canopylight transmitted through the foliage, was the same in all three models. (2) The models differed only in the second component describing different partially linearly polarized parts of the downwelling light under various illumination conditions: (A) sunlight undergoing the first-order Rayleigh scattering in the air layer between the ground observer and the foliage; (B) light reflected from the cuticle (outer surface) of leaves, the degree of polarization of which was practically independent of wavelength λ; and (C) combination of the cuticle-reflected light and the light returned by the leaf tissue below the cuticle (where the light transmitted through the cuticle underwent diffuse scattering and then left the leaf tissue by refraction at the cuticle). For all three models the wavelength range included the UV (300 nm ≤ λ ≤ 400 nm) and visible (400 nm < λ ≤ 700 nm) parts of the spectrum.
As a receptor-physiological approach, Hegedüs et al. (2006) calculated the quantum catches Q par(λ max) and Q perp(λ max) and the logarithmic quantum catch difference Δlog Q(λ max) = log Q par(λ max) − log Q perp(λ max) of DRA photoreceptors with orthogonal microvilli, where Q par and Q perp are the amounts of light absorbed by a DRA receptor (the quantum catch) if the E-vector of partially linearly polarized light is parallel (par) or perpendicular (perp) to the receptor microvilli and λ max is the wavelength where the receptor’s absorption spectrum is maximal. The greater the logarithmic quantum catch difference ΔlogQ(λ max), the better the detection of polarization. Thus, maximizing ΔlogQ(λ max) is optimal for DRA receptors. In the model, the photoreceptors were stimulated by downwelling light under canopies illuminated by sunlight as a function of the wavelength λ and the solar zenith angle θ as calculated by the above-mentioned three atmospheric optical models. Hegedüs et al. (2006) focused on high values of θ, because cockchafers are active at dusk. They estimated the spectral range in which a monochromatic DRA cross analyser detecting the polarization of downwelling light under canopies would function optimally.
Considering the maximization of d(λ), in all three atmospheric optical models (Fig. 17.9), the UV-blue and red are the first and second most advantageous spectral ranges, respectively, and green is the most disadvantageous part of the spectrum for the detection of polarization of downwelling light under canopies, independently of the solar zenith angle (Hegedüs et al. 2006). From this it follows that the green (520 nm) sensitivity of DRA receptors in cockchafers (Melolontha melolontha) cannot be explained by means of an adaptation to the wavelengths of maximal values of the degree of polarization d of downwelling light under canopies. High enough d of downwelling light is only one prerequisite of polarization vision under canopies. In addition, the intensity I also needs to be sufficiently high for detection of polarization, especially during sunset, when I considerably and rapidly decreases with increasing solar zenith angle. To decide whether d and I are simultaneously high enough at any given wavelength, the polarized intensity PI(λ) = d(λ)⋅I(λ) should be considered.
According to the three atmospheric optical models of Hegedüs et al. (2006), as the solar zenith angle θ increases from 0° to 90°, the wavelength where the polarized intensity PI(λ) is maximal shifts from violet-blue towards the red spectral range (Fig. 17.10). Hence, prior to sunset, PI is maximal in the green, and at sunset PI is sufficiently high in the green while at the same time being very much higher than in the short (blue, violet, UV) wavelength range. From these it can be concluded that the spectral sensitivity of DRA receptors in cockchafers is tuned to the maximal or sufficiently high polarized intensity PI of downwelling light in the green part of the spectrum under canopies during sunset.
A similar conclusion can be drawn by analysing the logarithmic quantum catch difference Δlog Q(λ) (Fig. 17.11) and the quantum catch Q(λ) (Fig. 17.12): Δlog Q(λ), which is the measure of the efficiency of polarization detection, is generally higher in the UV and blue than in the green. Thus, considering only the maximization of Δlog Q(λ), green-sensitive DRA receptors would be less advantageous than blue- or UV-sensitive ones under canopies (Fig. 17.11). During sunset, however, Q(λ) diminishes strongly with decreasing λ (Fig. 17.12); therefore, the quantum catch of UV- and blue-sensitive DRA receptors would certainly be too small, and only green-sensitive receptors have large enough quantum catch Q for the detection of polarization.

Logarithmic quantum catch difference Δlog Q(λ max, a) of polarization-sensitive model receptors with orthogonal microvilli calculated from the atmospheric optical models A, B and C of Hegedüs et al. (2006) for control parameter a = 1 at solar zenith angles θ = 30° and 90°. Qualitatively similar results were obtained for other values of θ and a [after Fig. 5 on page 238 of Hegedüs et al. (2006)]

Logarithm of the quantum catch Q par(λ max, a) of a polarization-sensitive model receptor with microvilli parallel to the E-vector of downwelling light calculated from the atmospheric optical models A, B and C of Hegedüs et al. (2006) for control parameter a = 1 at solar zenith angles θ = 30° and θ = 90°. Qualitatively similar results were obtained for other values of θ and a [after Fig. 6 on page 240 of Hegedüs et al. (2006)]
Considering atmospheric optics, the primary condition for successful detection of light polarization is that polarized intensity must be over the stimulus threshold of photoreceptors. Only if this prerequisite is fulfilled can the degree of polarization d be considered. Analogously, according to the receptor-physiological approach, receptors need to catch enough light quanta to be able to detect polarization by comparing the quantum catches of two receptor types with orthogonal microvilli (cross analyser in the DRA). Thus, the optimal strategy for achieving a successful and efficient orientation by means of polarization of downwelling light is to select a spectral range of sensitivity for the receptors, where both d(λ) and PI(λ) (in the atmospheric optical term, Figs. 17.9 and 17.10) and both Δlog Q(λ max) and Q (λ max) (in the receptor-physiological term, Figs. 17.11 and 17.12) are simultaneously maximal or at least moderately high. Hegedüs et al. (2006) showed that the green sensitivity of the polarization-sensitive DRA photoreceptors in Melolontha melolontha is tuned to the high polarized intensity PI(λ) = d(λ)⋅I(λ) of downwelling light in the green resulting in an optimal compromise between simultaneous maximization of the quantum catch Q(λ max) and the logarithmic quantum catch difference Δlog Q(λ max) under canopies during sunset (Figs. 17.9, 17.10, 17.11 and 17.12).
Hegedüs et al. (2006) also explained qualitatively why green-sensitive polarization detectors in the DRA also function efficiently enough during the pre-feeding and egg-laying flights of cockchafers always occurring prior to sunset and under the sky. During their lifetime cockchafers fly in two significantly different optical environments during sunset (1) under clear or cloudy skies during their pre-feeding and egg-laying flights and (2) under canopies illuminated by the setting sun during their swarming flights. During the pre-feeding and egg-laying cockchafer flights at dusk, the optimal wavelength range of DRA receptors would be the blue part of the spectrum. This explains why DRA receptors in dusk-active crickets orienting under twilight skies are blue sensitive (Labhart et al. 1984; Herzmann and Labhart 1989; Zufall et al. 1989; Horváth and Varjú 2004; Barta and Horváth 2004). For the cockchafer swarming flight under canopies at sunset, however, the optimal spectral range for DRA receptors is the long wavelength segment of the spectrum. Therefore, red-sensitive DRA receptors would be the most advantageous for this task, because the degree of polarization, the polarized intensity, the quantum catch and the quantum catch difference are all simultaneously maximal or sufficiently high in the red spectral range. However, red receptors generally do not occur in beetles (Briscoe and Chittka 2001). Since the DRA receptors in Melolontha melolontha are green sensitive, they serve the swarming flight best (for which longer wavelengths are optimal), rather than the pre-feeding and egg-laying flights (for which shorter wavelengths are optimal). The pre-feeding and egg-laying flights occur prior to sunset when the intensity of skylight in the green is still relatively high; thus, green-sensitive DRA receptors can still serve orientation by means of skylight polarization.
All three atmospheric optical models of Hegedüs et al. (2006) assume that the canopy is illuminated by direct light from the setting sun. This condition is not satisfied if the setting sun is occluded by clouds on overcast days. However, on cloudy days cockchafers usually do not perform swarming flights.
Hegedüs et al. (2006) also explained qualitatively why the green-sensitive polarization detectors in the DRA of the dusk- and night-active beetle Parastizopus armaticeps (Coleoptera: Tenebrionidae) can also function efficiently enough at twilight under clear desert skies: This beetle inhabits the Kalahari desert in southern Africa (Heg and Rasa 2004) and has to orient under predominantly clear twilight skies. Considering the perception of skylight polarization under clear skies, there is no favoured wavelength because the degree of polarization is sufficiently high (much higher than the threshold of polarization sensitivity) at all wavelengths (Fig. 17.7a). Thus, the proportion of the celestial polarization pattern useful for orientation is sufficiently large at all wavelengths, both in the UV and visible parts of the spectrum (Horváth and Varjú 2004; Barta and Horváth 2004). As we mentioned above, crickets possess blue-sensitive DRA receptors, thereby avoiding the very low intensity I of skylight in the UV at dusk, and utilize the maximal I and the relatively high degree of polarization d of skylight in the blue (Fig. 17.7a). The green-sensitive DRA receptors in Parastizopus armaticeps can also function efficiently enough at twilight, because they avoid the very low I in the UV at dusk, and utilize the relatively high I and the maximal d of skylight in the green (Fig. 17.7a).
Finally, it should be emphasized that beyond the atmospheric optical and receptor-physiological arguments presented here, certainly other important biological and/or environmental factors may exist which determine the optimal wavelength range for the detection of polarization of downwelling light in cockchafers.
References
Azzam RMA, Bashara NM (1992) Ellipsometry and polarized light. North-Holland, Amsterdam, NY
Barta A, Horváth G (2004) Why is it advantageous for animals to detect celestial polarization in the ultraviolet? Skylight polarization under clouds and canopies is strongest in the UV. J Theor Biol 226:429–437
Berk A, Bernstein LS, Robertson DC (1983) MODTRAN: a moderate resolution model for LOWTRAN 7, Air Force Geophysical Laboratory Technical Report GL-TR-83-0187, Hanscom Air Force Base, MA 01731-5000
Berry MV, Dennis MR, Lee RL Jr (2004) Polarization singularities in the clear sky. New J Phys 6:162
Bisch SM (1999) Orientierungsleistungen des nachtaktiven Wüstenkäfers Parastizopus armaticeps Peringuey (Coleoptera: Tenebrionidae). Ph.D. thesis, University Bonn, Germany
Brines ML, Gould JL (1982) Skylight polarization patterns and animal orientation. J Exp Biol 96:69–91
Briscoe AD, Chittka L (2001) The evolution of color vision in insects. Annu Rev Entomol 46:471–510
Coulson KL (1988) Polarization and intensity of light in the atmosphere. A. Deepak Publishing, Hampton, VA
Endler JA (1993) The color of light in forests and its implications. Ecol Monogr 63:1–27
Gál J, Horváth G, Barta A, Wehner R (2001) Polarization of the moonlit clear night sky measured by full-sky imaging polarimetry at full moon: comparison of the polarization of moonlit and sunlit skies. J Geophys Res D 106:22647–22653
Grant L (1987) Diffuse and specular characteristics of leaf reflectance. Remote Sens Environ 22:309–322
Grant L, Daughtry CST, Vanderbilt VC (1987a) Polarized and non-polarized leaf reflectances of Coleus blumei. Environ Exp Bot 27:139–145
Grant L, Daughtry CST, Vanderbilt VC (1987b) Variations in the polarized leaf reflectance of Sorghum bicolor. Remote Sens Environ 27:333–339
Grant L, Daughtry CST, Vanderbilt VC (1993) Polarized and specular reflectance variation with leaf surface features. Physiol Plant 88:1–9
Heg D, Rasa OAE (2004) Effects of parental body condition and size on reproductive success in a tenebrionid beetle with biparental care. Ecol Entomol 29:410–419
Hegedüs R, Horváth Á, Horváth G (2006) Why do dusk-active cockchafers detect polarization in the green? The polarization vision in Melolontha melolontha is tuned to the high polarized intensity of downwelling light under canopies during sunset. J Theor Biol 238:230–244
Hegedüs R, Barta A, Bernáth B, Meyer-Rochow VB, Horváth G (2007a) Imaging polarimetry of forest canopies: how the azimuth direction of the sun, occluded by vegetation, can be assessed from the polarization pattern of the sunlit foliage. Appl Opt 46:6019–6032
Hegedüs R, Åkesson S, Horváth G (2007b) Anomalous celestial polarization caused by forest fire smoke: why do some insects become visually disoriented under smoky skies? Appl Opt 46:2717–2726
Hegedüs R, Åkesson S, Wehner R, Horváth G (2007c) Could Vikings have navigated under foggy and cloudy conditions by skylight polarization? On the atmospheric optical prerequisites of polarimetric Viking navigation under foggy and cloudy skies. Proc R Soc A 463:1081–1095
Hegedüs R, Åkesson S, Horváth G (2007d) Polarization patterns of thick clouds: overcast skies have distribution of the angle of polarization similar to that of clear skies. J Opt Soc Am A 24:2347–2356
Herzmann D, Labhart T (1989) Spectral sensitivity and absolute threshold of polarization vision in crickets: a behavioral study. J Comp Physiol A 165:315–319
Horváth G, Varjú D (2004) Polarized light in animal vision—polarization patterns in nature. Springer, Heidelberg
Horváth G, Gál J, Labhart T, Wehner R (2002a) Does reflection polarization by plants influence colour perception in insects? Polarimetric measurements applied to a polarization-sensitive model retina of Papilio butterflies. J Exp Biol 205:3281–3298
Horváth G, Bernáth B, Suhai B, Barta A, Wehner R (2002b) First observation of the fourth neutral polarization point in the atmosphere. J Opt Soc Am A 19:2085–2099
Kong IA (1990) Polarimetric remote sensing. Elsevier, Amsterdam
Können GP (1985) Polarized light in nature. Cambridge University Press, Cambridge
Labhart T, Meyer EP (1999) Detectors for polarized skylight in insects: a survey of ommatidial specializations in the dorsal rim area of the compound eye. Microsc Res Tech 47:368–379
Labhart T, Hodel B, Valenzuela I (1984) The physiology of the cricket’s compound eye with particular reference to the anatomically specialized dorsal rim area. J Comp Physiol A 155:289–296
Labhart T, Meyer EP, Schenker L (1992) Specialized ommatidia for polarization vision in the compound eye of cockchafers, Melolontha melolontha (Coleoptera, Scarabaeidae). Cell Tissue Res 268:419–429
Pomozi I, Horváth G, Wehner R (2001) How the clear-sky angle of polarization pattern continues underneath clouds: full-sky measurements and implications for animal orientation. J Exp Biol 204:2933–2942
Schneider F (1952) Untersuchungen über die optische Orientierung der Maikäfer (Melolontha vulgaris F. und M. hippocastani F.) sowie über die Entstehung von Schwärmbahnen und Befallskonzentrationen. Mitteilungen der Schweizerischen Entomologischen Gesellschaft 25:269–340
Shashar N, Cronin TW, Wolff LB, Condon MA (1998) The polarization of light in a tropical rain forest. Biotropica 30:275–285
Suhai B, Horváth G (2004) How well does the Rayleigh model describe the E-vector distribution of skylight in clear and cloudy conditions? A full-sky polarimetric study. J Opt Soc Am A 21:1669–1676
Vanderbilt VC, Grant L (1985) Polarization photometer to measure bidirection reflectance factor R(55°, 0°, 55°, 180°) of leaves. Opt Eng 25:566–571
Vanderbilt VC, Grant L, Daughtry CST (1985a) Polarization of light scattered by vegetation. Proc IEEE 73:1012–1024
Vanderbilt VC, Grant L, Biehl LL, Robinson BF (1985b) Specular, diffuse and polarized light scattered by two wheat canopies. Appl Opt 24:2408–2418
Wang X, Gao J, Fan Z (2014) Empirical corroboration of an earlier theoretical resolution to the UV paradox of insect polarized skylight orientation. Naturwissenschaften 101:95–103
Wilson EO (1971) Insect societies. Harvard University Press, Cambridge, MA
Woolley JT (1971) Reflectance and transmittance of light by leaves. Plant Physiol 47:656–662
Zufall F, Schmitt M, Menzel R (1989) Spectral and polarized light sensitivity of photoreceptors in the compound eye of the cricket (Gryllus bimaculatus). J Comp Physiol A 164:597–608
Author information
Authors and Affiliations
Corresponding author
Editor information
Editors and Affiliations
1 Electronic Supplementary Material
Below is the link to the electronic supplementary material.
Supplementary Fig. 17.1
Colour photograph, and patterns of the degree of linear polarization d and the angle of polarization α from the local meridian of a grassland lit by the rising sun. The measurements were performed from a hot air balloon at an altitude of 100 m. The optical axis of the fish-eye lens pointed towards the nadir, which is the centre of the circular patterns [after Fig. 2 on page 6025 of Hegedüs et al. (2007a, b, c, d)] (CDR 2461 kb)
Supplementary Fig. 17.2
Colour photograph, and patterns of the degree of linear polarization d and the angle of polarization α from the local meridian of a clear sky with the overhead vegetation of a forest composed of birch trees lit by the setting sun measured by full-sky imaging polarimetry in the red, green and blue parts of the spectrum. In pattern b black shows the tree foliage and white indicates the sky [after Fig. 3 on page 6026 of Hegedüs et al. (2007a, b, c, d)] (CDR 3120 kb)
Supplementary Fig. 17.3
Colour photograph (a), and patterns of the degree of linear polarization d and the angle of polarization α from the local meridian of a clear sky, measured by full-sky imaging polarimetry in the red, green and blue parts of the spectrum. The optical axis of the fish-eye lens was vertical, thus the horizon is the perimeter and the centre of the circular patterns is the zenith. At the perimeter of the circular colour picture the dark silhouette of trees can be seen. The sun near the horizon was occluded by a small black disc placed on a thin wire, which is seen radially in the circular patterns [after Fig. 1 on page 6023 of Hegedüs et al. (2007a, b, c, d)] (CDR 1764 kb)
Supplementary Fig. 17.5
Colour photograph, and patterns of the degree of linear polarization d and the angle of polarization α (clockwise from the local meridian) of a grassland lit by the rising sun. The measurements were performed from a hot air balloon at an altitude of 150 m. The optical axis of the fish-eye lens pointed towards the nadir, which is the centre of the circular patterns (CDR 3761 kb)
Supplementary Fig. 17.6
As Supplementary Fig. 17.5 for a grassland lit by the rising sun and measured from a hot air balloon at an altitude of 200 m (CDR 3855 kb)
Rights and permissions
Copyright information
© 2014 Springer-Verlag Berlin Heidelberg
About this chapter
Cite this chapter
Horváth, G., Hegedüs, R. (2014). Polarization Characteristics of Forest Canopies with Biological Implications. In: Horváth, G. (eds) Polarized Light and Polarization Vision in Animal Sciences. Springer Series in Vision Research, vol 2. Springer, Berlin, Heidelberg. https://doi.org/10.1007/978-3-642-54718-8_17
Download citation
DOI: https://doi.org/10.1007/978-3-642-54718-8_17
Published:
Publisher Name: Springer, Berlin, Heidelberg
Print ISBN: 978-3-642-54717-1
Online ISBN: 978-3-642-54718-8
eBook Packages: Biomedical and Life SciencesBiomedical and Life Sciences (R0)