
Abstract
Modern biological cleanroom was developed on the basis of the industrial cleanroom. Except for the common principles of the cleanroom, the specific principles for the control of biological particles should also be complied with. This chapter will illustrate on these particularities.
You have full access to this open access chapter, Download chapter PDF
Keywords
These keywords were added by machine and not by the authors. This process is experimental and the keywords may be updated as the learning algorithm improves.
Modern biological cleanroom was developed on the basis of the industrial cleanroom. Except for the common principles of the cleanroom, the specific principles for the control of biological particles should also be complied with. This chapter will illustrate on these particularities.
9.1 Application of Biological Cleanrooms
The first biological cleanroom was built in the USA in Jan. 1996 as the operating room in hospital.
Now, biological cleanroom has been widely used in astronavigation, medical science, pharmacy, microbiology, biological experiments, genetic engineering, instrument industry, and so on.
In medical science, one of the applications of biological cleanroom is mainly the operating rooms for joint replacement, organ transplantation, cerebral surgery, and thoracic surgery. This effect is obvious. Table 9.1 is the statistical result of the infection rate after the operation of hip joint replacement [1]. Table 9.2 is the result with the culture on the wound smears directly in general operating room [2]. In clean operating room, the main pathogenic bacterium disappears near the wound area, which decreased the postoperative infection rate from 9 to 0.5 %.
Yu Xihua emphasized that air cleaning is the main measure to remove airborne bacteria with the following examples [3]:
Charnley et al. from the UK performed study for 15 years. When laminar flow cleanroom was used to replace the common operating room, the infection rate among more than 5,000 surgery cases decreased from 7.7 to 1.5 %. When the whole body suction suit was used, the infection rate among more than 6,000 surgery cases decreased further to 0.6 % [4]. During the study, the antibiotic was not used.
Medical Research Committee of the UK (MRC) performed comparison researches for more than 8,000 surgical cases of hip joint replacement in 19 hospitals. The infection rate during 1–4 years was 0.6 %, while it is 1.5 % when the same operations were performed in common operating room by the same doctors.
The application effect of clean operating room was usually reported from abroad in the past. At present, some Chinese examples can also be presented.
At the beginning of 1980s in China, with the application of two clean operating room in the burn surgery, not only the postoperative infection rate for the general operation was generally declined, but also the infectious rate of two-degree burnt patients with more than 70 % of large area burnt was significantly reduced, and the healing process on the burnt face went on well and quickly [5]. Among 9,337 cases with I class operation performed in the clean operating room at Shanghai Changzheng Hospital during 1989–1990, no infection case appeared. There was no infection accident among 16,427 cases with I class operation performed in the clean operating room at 301 Hospital during 1995–1996. Of course there were other factors.
According to the report by Wang Fang at the 2011 National Hospital Building Forum, investigation about the postoperative infectious rate with 1,808 cases of operation was performed between June and Nov. of 2000 at attached hospital of Xuzhou Medical College. It was found that with clean operating room, the postoperative infectious rate decreases from 6.41 % with traditional general operating room to 0.93 %.
Table 9.3 shows the statistical result about the postoperative infectious rate with 2,328 cases of operation in one educational medical hospital when different methods of disinfection were used in the operating room, which was investigated by Xu Qinghua et al. [6]. The conclusion is that the risk of postoperative infectious rate with ultraviolet sterilizer is 7.08 times of the laminar flow cleanroom, which is 2.11 times of the indoor air cleaner. The performance with laminar flow operating room is significant.
Xia Muya reported the change of surgery site infection with Class I cut before and after the clean operation room was applied in No.1 attached hospital of Suzhou University. Although the original infectious rate is not high, it reduces by half when the clean operating room was used. In 2000 it was 0.74 %, and in 2001 it was 0.35 %, then in 2002 it was 0.32 %, and in 2003 it was 0.31 %. It is almost stable afterwards [7].
With the application of the clean operating room, less or no antibiotics can be used. In the past due to the abuse of antibiotics, the drug resistance ability of bacteria was greatly increased. When bacteria are exposed to antibiotics during the growth period, due to the effect of selection pressure, its metabolic pathway or the fine structure is forced to change. For example, bacteria can produce inactivated enzyme to destroy the structure of antibiotics, which deprives the competence of the antibiotics. Bacteria can modify the structure and quantity of the target protein which antibiotics act on, so that the bacteria are no longer sensitive to antibiotics. With the effect of the barrier by outer membrane and the efflux pump, the amount of antibiotics entering in the bacteria is reduced, and the ability of pump out antibiotic is increased, which reduces the antibiotic concentrations in the bacterial body. In this way, the bacteria do successfully escape being destroyed by the antibiotics and survive. In the long run, the application of large amount of antibiotic results in the reduced autoimmune ability of patients.
It should be emphasized that the reduction of infectious rate in clean operating room is obviously related to the type of operation cut. The decrease of infectious rate for Class I clean cut should be more obvious than that for Class II clean-polluted cut. The infectious rate for Class III and Class IV infection cuts is greatly reduced, because the possible infectious rate generated for this kind of cut can reach more than 20 %.
In the Design and management guideline of hospital air conditioning equipment published by Japanese Association of Medical Equipment in 2004 [8], the infectious rate of 8,052 cases of hip joint and knee joint replacement operations was given under the conditions of ultra-clean air (it is defined as the bacterial concentration less than 10#/m3) and precautious anti-poison drug, which is shown in Table 9.4.
It is obvious that the use of antibiotics can kill the bacteria in the body (including the surgery site) with the higher efficiency than the measures to prevent the deposition of bacteria onto the surgery site. But as mentioned before, in order to prevent the increase of antidrug ability of bacteria and the generation of super bacteria, the appeal to use less antibiotics or no antibiotics is increasing strong at present. It does not mean the effect of biological cleanroom should be questioned in the Japanese example; instead it means that compared with nonbiological cleanroom “without any measures,” it is relative efficient with biological cleanroom, since the infectious rate can reduce by more than a half. The value of 1.6 % is almost the same the value of 1.5 % by Charnley in previous chapter. Although the infectious rate with only ultra-clean air is one time higher than that only with antibiotics, it is an important goal not to use antibiotics. At present some detailed measures have been issued in some region. For example, it specifies that medicine is given 30 min before operation for one time. Therefore, the cleanroom technology, where antibiotics are not needed and at the same time the postoperative infectious rate is greatly reduced, is the goal people have paid attention to.
Just as the Sweden Fundamental requirement and guideline for cleaning in biological cleanroom (SIS-TR 39 Vägledning och grundläggande krav för mikrobiologisk renhet I operationsrum) issued in 2011, it pointed out that: “Precautious antibiotics have individual effect on the infectious rate. But the anti-drug ability of bacteria will be correspondingly increased, which will reduce the effect of precautious antibiotics.”
It should be noted that in addition to burn surgery, good performance was obtained with the application of biological cleanroom for special treatment of asthma and leukemia. Especially for patients with leukemia, most of leukocytes in patient are naive cells, which have lost the defense ability against infection severely. In order to provide the time gap for the preparation of implantation growth for hematopoietic stem cell, which means the existing leukemia cells must be removed and patients’ immune function must be inhibited so that hematopoietic stem cells mismatched with the tissue can be implanted, patients used to take high-dose immune inhibitors and radiation therapy before operation, which will reduce the number of leukocytes to “0” in seven days. Therefore, lethal infections of leukemia patients are the major causes of death with the mortality of 50–60 %. So during the treatment, it is especially important to prevent infection from bacteria including Gram-negative bacteria, Candida, and Aspergillums, but this can only be achieved in biological cleanrooms. For the morbidity of leukemia in China is about 3/100,000 [9], more and more importance has been attached for the development of biological cleanroom which is used for the treatment of leukemia.
According to the report from National Institutes of Health in the USA in recent 10 years [10], the performance of the treatment of leukemia is remarkable with antibiotics, when it was performed in biological cleanroom aseptic conditions, which can extend the patient’s life in this condition. Table 9.5 shows the comparison of the performance with a contrast group.
With the data about the survival percentage of patients shown in Fig. 9.1 [11], the life of leukemia patients treated in the isolation unit of biological cleanroom will be prolonged by about one time than that in the general ward. Studies have also shown that, in biological cleanrooms, the ratio of leukemia patients who can completely recover can reach 33 %, while in general wards, it is 19.6 % [12].


Comparison of survival condition for leukemia patients
Since the later period of 1970s, biological cleanroom has been constructed for the therapy of leukemia in China, which has made gratifying achievements. There are reported cases with successful operations at Shanghai Xinhua Hospital and Institute of Hematology from Beijing Medical College. For example, it was the first time for Xinhua Hospital to perform marrow transplantation on leukemia patient in cleanroom in Oct. of 1980, which obtained a success. With the severe condition of leukocyte less than 400, the patient had a fever only for several days in the cleanroom, and afterwards there was no fever again, which means the infection has been successfully prevented. During the period of more than 1 year after leaving the hospital, the patient was still in good health condition. In the late of 1990s, the number of hospitals with clean blood ward in China was at least more than 30. The largest one in Asia is Beijing 307 Hospital where 10 hematology wards with Class 100 were newly built. The air cleanliness level in its internal corridor was Class 1000. At the end of 1994 when it was put into service, the index under its as-built state was: average cross-sectional velocity was 0.21 m/s for 10 rooms (in Chinese military standard implemented in 1996, the value specified was 0.18–0.25 m/s), average noise was 49.8 dB(A), the maximum of mean particle concentration (for particles with diameter ≥0.5 μm, when particle counter with sampling flow rate 28.3 L/min was used for detection) was 0.55#/L, statistic average concentration indoors was 0.66#/L, and average settlement of bacteria was 0.15 CFU (with the sampling vessel ф 90 for 0.5 h). The performance was quite good during several years of operation. It went without infection for the treatment of 110 patients during 1994–1997. Until 2009, there were 4 million leukemia patients in China. The healing rate of the leukemia by acute lymph cell reached more than 95 %. The possibility of healing without recurrence also reached 70 % and 80 % in the five continuous years. When different types of leukemia were considered comprehensively, the healing rate should be about 60 % (according to the report of Beijing Evening Newspaper on the 7th page on Feb. 22, 2009). Now, there is no doubt that biological cleanroom (device) is an indispensable guarantee condition for the treatment for leukemia.
In the development field of medical biological cleanroom, the USA was ever on the top of the world. In the late of 1970s, there were already 288 biological cleanrooms, of which 240 was operating room and 48 wards. Except the USA, in the late of 1970s, there were already 127 cleanrooms of this kind in Japan, which was several times of Germany, France, England, Switzerland, and other European countries. In clean operating room, artificial joint replacement operation takes the most proportion, while in cleanroom, acute leukemia ward is of the majority [14].
With the development of economy and construction in China, the Code of designing and building the clean operating department in military hospitals has already been implemented in 1996, the Building standard for the clean nursing ward in army hospitals implemented in 1997, the national standard Clean operation Department in hospital construction standard implemented in 2000, and the national standard Architectural code for Clean Operating Room in Hospital implemented in 2002. Architectural design code for comprehensive hospital building has been drafted. Various kinds of cleanrooms (rooms with clean environment) have been applied in various departments of hospital. According to incomplete statistical investigation, there are already ten thousands of cleanrooms built.
It should be emphasized here that although the infectious rate on the operating site through indoor air is far less than that through direct contact, with the great advancement of the operating technique itself, operating apparatus, instrument and equipment, medical care technique, and building techniques, the control of air pollution becomes the most important role because only the air quality lags behind. Air cleaning technology is only one of the routes for disinfection and sterilization of air in cleanroom, but it is the only route which can be controlled from the whole process and can be controlled comprehensively and at critical positions, which was believed to be the fundamental elements for quality control of modern products [13]. But there are also cases where cleanrooms were poorly built and managed, which results in poor performance.
In the pharmaceutical field, the requirement becomes increasingly demanding for the purity of drugs, especially for intravenous, intramuscular, and ophthalmic purpose, where more drugs must be manufactured in a clean environment. Experiments show that the entrance of a certain number of particles into the circulatory system will cause a variety of deleterious symptoms, and if the injection or infusion medicament contains any bacteria, polysaccharide it produced can cause the patient to the pyrogen reaction [15]. So biological cleanrooms with different classes are widely applied in advanced pharmaceutical industry, especially for the filling of injection, packaging process and quality inspection, testing, and other processes. Since the middle of 1980s, the system Good Manufacturing Practice for pharmaceutical production (GMP), which begins from 1960s internationally, has been widespread. And it specifies that the standard should be followed for the construction of clean workshop for the production of human medicine, veterinary medicine, equipment, and packaging supplies, which has received satisfied results. In addition, biological cleanroom technology has also been applied in food and cosmetics industry. In 2011, the national standard Architectural technique code for food industrial cleanroom was implemented.
In the asepsis test, biological cleanroom has been successfully applied to departments including tissue culture, cancer cell culture, vaccine culture, the production of antibiotics, etc. It usually takes more than one year to produce live cancer cells outside the human body, and all the previous efforts will be wasted once it is slightly contaminated. In the production process of antibiotics, tons of nutritional raw materials will be wasted by inadvertent contamination. There is also a notable asepsis test, that is, the breeding of sterile animals. Animals used for biological, chemical, and pharmaceutical test are called “sterile animal,” which means there is no pathogenic microorganisms in vivo.
Animals without specific pathogenes or only with known or specified bacterial, that is, SPF (Specific Pathogene-Free animal) animal, are also used. When these animals are used for experiment, the influence of impurity bacteria contained in the animal itself can be eliminated, and the real results can be obtained quickly. The sterile animal or SPF animal must be breed from generation to generation in biological cleanroom, which removes the possibility of bacterial infections since it’s born, so that the purity can be ensured.
Aseptic animal is the highest level, that is, the fourth level, in the experimental animals. In 1992, China also issued the classification standard for experimental animal [16]. In the Architectural technique code for experimental animal implemented in 2008, it specifies that for the second-level animals, except for that there is no specified microorganism for this class or when it is need, the microorganisms specified for the first class must not exist or when it is needed. It applies for the following classes. The detailed information is presented in Tables 9.6, 9.7, and 9.8. National or local environmental standards have also been issued on the experimental animal.
In the space navigation field, it was the Lunar Lander that first has the application of biological cleanroom [17]. Biological cleanrooms must be used for the manufacture of the Lunar Lander, the container used to retrieve a moon rock and for the test of recaptured rock. Because if any organic matter from the earth was taken into another star of the universe or if the organic matter from the earth during the assay was mistaken as the inherent planet organics as the recaptured material, a false research conclusion and extremely serious consequences will be made.
9.2 Main Characteristics of Microbe
For the control of microbial contamination, understanding of microbial characteristics is necessary. Because algae and protozoa are larger, they can be not mentioned. According to the relevant microbiology works, the main characteristics of several other microorganisms will be listed, which is shown in Table 9.9.
For bacteria, there is an important characteristic, that is, the growth characteristics. It can be described by the growth curve, which is useful to understand the bacteriological feature in biological cleanroom. In later section, the phenomenon for the explosion of the bacterial concentration when air-conditioning equipment is started will be introduced. The knowledge for the filtration treatment of fresh air needs to be updated. All these are related to this characteristic.
According to the conventional practice of bacteriology, the bacterial growth curve can be obtained, which shows the change of living bacteria number with time, when the living bacteria number is counted after the bacteria are cultured on the substrate. The curve is shown in Fig. 9.2. Several bacterial growth stages are apparently shown on this curve.


Bacterial growth curve. 1 preparation period (or delayed period), 2 logarithmic growth period, 3 stable period (or quiescent period), 4 decay period
9.2.1 Preparation Period or Delayed Period
After the inoculation of some bacteria onto the culture medium, they need time to adapt to new environment. They usually don’t divide and develop immediately. Bacterial number almost does not increase, even some will die, and the number reduces when they don’t adapt to new environment.
9.2.2 Logarithmic Growth Period
It can be seen that the curve in this stage can be approximated as straight line, during which bacterial number increases according to the geometric series approach, that is, 20 → 21 → 22 → 23 → 24 ⋯ → 2n. The time needed between this split and the next split time is different for different kinds of bacteria. For example, c
Taking the Staphylococcus as an example, 2 divisions occurred in 1 h, so 16 divisions will occur in 8 h, through which bacterial number increases from the 1 to 65,536, and after 12 h, it reaches 1.6777 × 10⁷. The logarithmic growth period generally lasted a day. The reproduction rate of virus is much faster. A virus within living cells can reproduce 100 thousands of subsets of virus.
9.2.3 Stable Period or Quiescent Period
In a specified volume of culture medium, bacteria cannot be increased unrestrictedly with the rate in logarithmic growth period. Because the nutritional deficiency in culture medium and accumulation of harmful metabolites, the bacterial growth rate in late of logarithmic growth period decreased gradually, and the death rate gradually increased. When it reaches the balance state, the living bacterial number is stabilized, just as the bacteria have stop breeding. This stage lasts about 1 day in length. So it is appropriate to set 24–28 h as the culture time in the Petri dish.
9.2.4 Decay Period
After culture continues after the stable period, the bacterial mortality rate exceeds the growth rate, so decay period begins with the decreasing number of living bacteria.
9.3 Microbial Pollution Routes
In order to control the microbial contamination, it is also necessary to understand the pathways of microbial contamination, which mainly includes the bacterial and viral contamination.
Microbial pollution usually has four ways:
-
1.
Self-pollution, which is caused by bacteria carried on the own body of patients or staffs
-
2.
Exposure to pollution, which is caused as a result of contact with an incomplete sterile utensils, equipment, or human
-
3.
Air pollution, which is because of the settlement, attachment, or inhalation of bacteria suspended in air
-
4.
Other pollution, which is caused by insects and other factors
For cleanroom, there are variety of pollution pathways since air is added as the transmission medium of air pollution. It can be shown as follows [18].
In the same room:


Effects of other rooms:


So the difference between the biological cleanroom and the industrial cleanroom is that not only air filtration method needs to be used so that the number of the biotic and abiotic particles entering indoors can be strictly controlled, but also various surfaces including indoor personnel, apparatus, panel, and others must be sterilized. So the internal materials in biological cleanroom should be able to withstand the erosion from a variety of sterilizing agents. Therefore, in foreign literatures, one explanation of the biological cleanroom is that it is the industrial cleanroom with the structure and material allowed for sterilization.
Therefore, there are two major technical problems for biological cleanroom, which are the filtration of airborne microorganism especially the bacteria and the sterilization treatment on various surfaces.
9.4 Equivalent Diameter of Biological Particles
9.4.1 Size of Microorganism
Microorganism is also one kind of solid particles. The biological particles include the following microorganism, which will be shown in Table 9.10 together with their sizes [19–21].
9.4.2 Equivalent Diameter of Biological Particles
Is it difficult to filter bacteria than particles in the biological cleanroom? It is people’s intuition that bacteria are so small. Actually this is not the case. In this book, this related concept is presented, which is the equivalent diameter of biological particle.
Microorganisms including bacteria, spirochetes, rickettsia, and virus cannot exist alone in the air, which are often found on the surface of dust particle which is several times larger than themselves [22]. They do not exist as monomer; instead, they appear with the form of bacterial clump or spore. Because air lacks nourishments and they are subject to the irradiation of sunlight especially ultraviolet, only those bacteria and fungi which produces spores and pigment, as well as fungi with strong ability to resist sunlight and dry environment, can survive in the air. So for most airborne bacteria in the air, it doesn’t make much sense for the nude size, while what makes sense is the equivalent diameter.
Equivalent diameter can have three meanings:
-
1.
When safety is taken into consideration, let the equivalent diameter equal to the most penetrating particle size, which means it is the lower limit of diameter (the minimum diameter) for the carrier particle penetrating through filters. It can be termed as the penetration equivalent diameter of particles with microorganism.
-
2.
In terms of the filtration performance, the particle size corresponding to the filtration efficiency of the bacterial group can be called as the efficiency equivalent diameter.
Li Hengye concluded that there is a certain correlation between the airborne bacteria concentration and the 3.5 μm particle concentration according to the measured data [23], which will be shown in Figs. 9.3, 9.4, and 9.5. It was believed that the filtration efficiency of several fibrous filter materials with atmospheric bacteria is equal to that with 4–5 μm particles. But Tu Guangbei found out that the filtration efficiency of fibrous filter materials with atmospheric bacteria has quite good linear correlation with the particle counting efficiency with ≥5 μm atmospheric dust [24], which is shown in Fig. 9.6. So the filtration efficiency with atmospheric bacteria can be approximated as the particle counting efficiency with diameter ≥5 μm, or the following formula can be used:
where
-
ηb is the filtration efficiency with atmospheric airborne bacteria;
-
ηd is the particle counting efficiency for atmospheric dust with diameter ≥5 μm.
That is to say, the efficiency equivalent diameter of atmospheric bacteria is about 7 μm. Because only the efficiency with 7 μm is equivalent to that with diameter ≥5 μm.


Bacterial and dust concentration variations in hospital air


Bacteria and dust concentration variations in office
Note: (1) Particle concentration with diameter 1.5 μm can be obtained with 10 times of the ordinate value multiplied.
(2) Particle concentration with diameter 0.75 μm can be obtained with a 100 times of the ordinate value multiplied.


Atmospheric dust concentration curve of bacteria
Note: (1) Particle concentration with diameter 3.5 μm can be obtained with 10 times of the ordinate value multiplied.
(2) Particle concentration with diameter 0.75 μm and 1.5 μm can be obtained with a 100 times of the ordinate value multiplied (refer to Page 171 from the cleaning association paper in 1986).


Relationship of bacteria efficiency and dust efficiency
(3) When the settlement velocity is taken into consideration, let it be equivalent to the particle diameter with the same settlement quantity, that is, the same sedimentation velocity, of the bacterial group. It is called as the settlement equivalent diameter.
Equation (6.8) reflecting the relationship between vs and dp was derived with the particle density 2 kg/m3. In relative clean place, most of the carriers for biological particle are organic, where the density may be considered as less than 2 and greater than 1. So corrections must be made with Eq. (6.8) to obtain the value of dp for any ρ:
where the settlement velocity vs can be obtained by Eq. (6.27) with the following expression:
If this formula is used to obtain the value the value of dp through the measured data, the implications of each parameter in the formula are: Ng is the bacterial settlement quantity, #; N is the airborne microbe concentration, #/cm3; f is the sampling area, i.e., the area of sedimentation, or the planar utensil area, m2; and T is the sampling time, i.e., the settling time, s.
In this book, the quantities of the sedimentation bacteria and airborne bacteria are used with “#,” which are obtained with the sampling method, either the sedimentation method or the suction method, following by culture. They are expressed with bacterial colony. One bacterial colony contains tens of thousands of bacteria, but it represents one bacterium sampled from the air (or by the sedimentation method). In some literature, the bacterial colony is used to be expressed as CFU (colony-forming units).
As for the settlement equivalent diameter with particle density ρ = 1 according to the measured data [25], it is between 6 and 9 μm in the general operating room without air purifying, and the average is 7.36 μm; it is between 3 and 8 μm in the operating room with air purifying, and the average is 5.5 μm. If ρ is assumed as 1.5, the average settlement equivalent diameters are 5.2 μm and 3.9 μm, respectively. So attention must be paid to the particle density during the calculation of equivalent diameter.
The three kinds of equivalent diameters above are certainly not equivalent. To determine what equivalent diameter should be adopted depends on the purpose. For example, when it comes to the filtration efficiency of bacteria, of course the efficiency equivalent diameter should be used. When the bacterial settlement is involved, the settlement equivalent diameter should be chosen. But when it comes to the bacterial equivalent diameter, unless it is specified, all are the settlement equivalent diameter, which is 1–5 μm for clean place, 6–8 μm for the general place, 8–12 μm general situation outdoors, and up to 10–20 μm where human activities are intensive with much dirty places [26].
Although virus diameter is only 0.01–0.1 μm, the above principle about the equivalent diameter is also suitable. Wang Yuming et al. collected the virus phage from bacterial sampled in the six main monosodium glutamate factories in China; they deposited mainly on the III and IV sections of Anderson sampler [27], which means the main size is 2–5 μm (see Sect. 15.7) and the average value is 3 μm.
This is because although bacteria and virus are small, they need to attach to the carrier. This kind of carrier contains nutritious material for microorganism, which is released into the air by the human activity and mechanical force. So the size of virus entering into the air is not related to the size itself of the virus, instead it is dependent on the mechanical force of the spray or the biological acting force. For example, when cascade liquid impactor was used to sample the Foot-and-mouth disease virus particles naturally suspended in air, the result showed that 65–71 % of particles are larger than 6 μm, 19–24 % of particles between 3 and 6 μm, and 10–11 % of particles smaller than 3 μm, although the real size itself is only 25–30 nm [28].
9.5 Biological Particle Standard
Although standard about the biological particle in cleanroom has been given by US Aerospace Standard and the international standard draft proposed at the Fourth International Pollution Control Association in 1978 with the same provisions, the explanation of the standard compilation has not been given. With the methods mentioned in previous sections, how to determine the standard for biological particles will be discussed in this section.
9.5.1 Microbial Concentration
Microbial concentration is expressed as the microbial quantity in unit volume of air, which is the main control target in biological cleanroom.
According to related report, 53 % of the apparatus used in cleanroom are polluted by airborne bacteria in the operating room [3]. This means the contact infection is greatly related to the airborne bacteria concentration. The infectious rate of joint repair operation is related to the airborne bacteria concentration in the space 30 cm from the wound. For example, 30 % of the bacteria found on the cut of the hip joint are from the settlement from air, and 68 % come from other indirect routes.
Based on the research result by two American scholars Blwer and Wallace (cited from the July of 1968 Issue of ASHRAE Journal), WHO proposed that when total number of airborne bacteria reaches 700–1,800#/m3, air will have the apparent risk of infection through air transmission. When the total number of bacteria is less than 180#/m3, this kind of infectious risk seems very little [29]. Therefore, it is the minimum bacterial number when bacterial concentration is less than 16#/m3. It is low bacterial number when bacterial concentration is less than 200#/m3. It is general bacterial number when bacterial concentration is between 200 and 500#/m3. They also pointed out that among the whole bacteria with risk, the proportion of Staphylococcus aureus with obvious pathogenic effect can reach 5 %. Under this situation, septicemia is easily induced.
Swedish scholar has obtained the correlation between the morbidity of septicemia in knee reshaping and transplanting operations and the indoor microbial concentration [30], which is shown as follows:
where A is the airborne microbial concentration.
After the relation between the clinical microbe and the infectious rate was analyzed, Zhong Xiuling described this relation vividly with the following equation [31]:
This indicates that both the bacterial concentration and the foreign matter are factors to cause surgery site infection. Sterile foreign matter will cause adhesion and granuloma, which will make the risk of all operations as high as 50–100 %, and even next operation is needed. It is obvious that the above equation can be used for calculation quantitatively. It is only vividly illustrated that the larger the factors on the numerator is, the higher the infectious risk is. The larger the factor on the denominator is, the less the infectious risk is. The risk mentioned here does not mean the specific index.
So far the direct relationship between the total particle number and the microbial concentration has not been found, but a lot of tests performed at home and abroad all prove the fact that “the microbial concentration in Class 100 cleanroom is much less than that in Class 10000 and Class 100000 cleanrooms” and “microbe are rarely found in Class 100 cleanroom” [32]. (The air cleanliness levels mentioned in these sentences are based on 209E standard.)
The higher the air cleanliness level is, the lower the microbial concentration is. The lower the microbial concentration is, the smaller the pollution and infectious risk will be (when other conditions are the same). This should be a fundamental principle.
9.5.2 Airborne Bacteria Number and Standard
The microorganism in the biological cleanroom mentioned in the following section mainly refers to bacteria. Although virus cannot be cultured to be visible colony by usual methods, there is a certain relationship between bacteria and dust. But the exact correlation between them has not been given so far with the related studies, which is required to develop the standard for airborne bacteria. Two solid lines on Fig. 9.8 are the related range of the relationship between the airborne bacteria and the particles in biological cleanroom found in literatures [33]. It can be seen that the difference of airborne bacteria is large for the same dust concentration. But the correlation range on this figure can be used to determine the maximum value of airborne bacteria concentration corresponding to a certain dust concentration. The following formula can be used to approximate the relation:
where
-
Nb is the airborne bacteria concentration, #/ft3;
-
N is the dust concentration.
If the unit was changed to “L,” it can be rewritten as
Or the approximated expression can be used for calculation:
The dashed lines on Fig. 9.8 are the maximum airborne bacterial concentration calculated with Eq. (9.6).
According to the bacterial size introduced in the section about microorganism and Fig. 1.1, the largest bacterial diameter can be considered as 10 μm (not including individual larger one). Accordingly, with the known value of Nob, the value of Ngb can be calculated, and the results are shown in Table 9.11.
With the calculated results in Table 9.11, author has found that the standard about settlement bacteria in both the US Aerospace Standard and the international standard (draft) is given with the largest settlement quantity, which serves the safety considerations for a standard.
If Sugawara Fumiko’s formula, i.e., Eq. (6.26) in Chap. 6, is used to calculate the settlement quantity of bacteria, the calculated result will be smaller than that with Eq. (6.31). On the contrary, when the airborne bacteria concentration is calculated with the settlement quantity, the result will become larger. For example, the difference for particles with diameter 5 μm will reach 20 %. Moreover, as mentioned in Chap. 6, Sugawara Fumiko’s formula is not valid for the room with limited height and without air supply. Because if the culture plate (abbreviate as flat vessel) is taken to be open for time period T = 3 h, which is about 104 s, the deposition distance of particles with diameter 5 μm will be 15 m, which is much more than the room height. It means that all indoor particles with diameter 5 μm have been settled down. In other words, the airborne bacteria concentration during the settlement time of the sampling is not constant, so Sugawara Fumiko’s formula is not valid.
The bacterial settlement numbers above were obtained for the area of one square meter per week. They can be converted to be the settlement quantity in half an hour on one culture plate (In U.S. standard the recommended diameter is 100 mm, while Chinese standard uses 90 mm). The results are specified in Table 9.12.
It is apparent from Fig. 9.8 that the values of 0.1, 0.5, and 2.5 correspond to the airborne bacteria concentrations (#/ft3) for Class 100, Class 10000, and Class 100000 in Aerospace Standard, respectively. The airborne bacterial concentrations for these three classes are not on the same straight line. The airborne bacteria concentrations with 2.5#/ft3 and 0.5#/ft3 are equivalent with the average value of associated range of upper and lower limits in the corresponding classes, respectively. But the third value is neither the average value of these two values nor the value 0.02 on the extended line; instead it is the upper limit 0.1 of the related range. According to “NASA Standard Procedures for the Microbial Examination of Space Hardware” (NASA NHB5340-1) by National Aeronautics and Space Administration, it is specified for the microbial measurement that the sampling flow rate should be 28.3 L/min (1 ft3/min) and the sampling period should be less than 15 min. Since the sampling period is too long, the status of the sampled object may be varied. This is not a problem for continuous sampling or simultaneous sampling at multiple positions. The minimum sampled bacteria can only be one (a decimal value may not appear) in the sampling period less than 15 min (usually 10 min), which corresponds with the least number of airborne bacteria 0.0025–0.0035#/L (0.07–0.1#/ft3). Since the sampling time may be shorter than 15 min, the possible measurable minimum value should be set at 0.0035 #/L (1#/ft3), which is the upper limit of the related range. If this value was set very low, such as 0.0007#/L, no bacteria will be sampled even when the equipment with sampling flow rate 28.3 L/min was used for 15 min, and it is unlikely to increase sampling rate with the technology at that time. So in the international draft standard, the airborne bacteria concentration for the dust concentration for 0.35#/L was only proposed to be the upper limit of the range, i.e., 0.0014#/L (0.04#/ft3). It is shown from Fig. 9.7 that it is just near the connection line with the values corresponding to previous two grades. If Eq. (9.4) is used for calculation, it becomes 0.0011 #/L(0.032#/ft3).


Relationship between the airborne bacteria concentration and the dust concentration
To conclude, the related links in the standard about the suspended biological particles can be found. Author thinks that interpolation is not suitable with the numerical values in this standard, which is inconvenient for use. Regardless of the accuracy of the relevant range between these bacteria and the particle, these values in current standard are close to the upper limit of related range, while only one value deviates a little further, so it is more reasonable to replace the values in the standard with the upper limit of relevant range, that is determined with Eq. (9.6) (the long dashed line in Fig. 9.8). In this way, various grades can be connected, and interpolation can be made between different grades.


Comparison of three sampling methods under three kinds of environments
9.5.3 Number of Sedimentation Bacteria and Related Standard
Sedimentation number of bacteria depends on the amount of airborne bacteria. The calculation method for the settlement quantity is the same as the method for sedimentation of general particles introduced in Chap. 6.
When the airborne concentration per cubic meter of air is assumed as N0b, the settlement quantity of bacteria on the surface per square meter per week is Ngb; we can obtain the following expression according to Eq. (6.31):
During the application of this formula, the main problem is how to determine the particle size of airborne bacteria, which will thereby determine the coefficient α. As for airborne particles, the distribution in air is certain, where the settlement quantity can be calculated according to the average particle size. But sizes of airborne bacteria may be very different in different cases. If all of them are large, they are prone to deposit. Obviously, since the settlement quantity of bacteria is used in the standard, the maximum settlement quantity should be used as the basis for determining the value in standard, which means that the settlement quantity of airborne bacteria corresponds with the largest diameter. In fact, the actual settlement quantity should not be larger than this value, otherwise the airborne bacteria concentration exceeds the value in standard.
By the above comparison, it is feasible to obtain the relationship between the airborne bacteria and the settlement bacteria with Eq. (6.31). It is simple to use the correlation between bacteria and particle with Eq. (9.6) as the concentration standard for the airborne bacteria. Therefore, author has ever proposed to set Table 9.13 as the reference for biological particle standard of cleanroom with air cleanliness level “3” series and “3.5” series.
In Table 9.13, with the low dust concentration, the colony settlement quantity in each Petri dish is very small. It is apparent that accurate detection with one or even several Petri dishes is not attainable. But at least how many Petri dishes should be used, which will be discussed in the Chap. 16.
9.6 Relationship Between Settlement Bacteria and Airborne Bacteria
There are criteria for both settlement bacteria and airborne bacteria for biological particles in biologic cleanroom standards, such as EU GMP promulgated in 1997, China’s GMP implemented in 1998, China’s veterinary GMP implemented in 2002, China’s newly issued GMP implemented in 2011, as well as the previously mentioned standards and specifications about the clean operating department. So attention should be paid on the relationship between them.
Because we know that:
-
1.
It is the most classical approach to measure the biological particles with settlement method, which has the most obvious feature of simplicity and practicability.
-
2.
There are a lot of data about settlement bacteria concentration in the past. The conversion relationship between settlement bacteria concentration and airborne bacteria concentration should be known when necessary.
-
3.
When in some applications it is impossible to measure the airborne bacteria concentration, the conversion relationship between settlement bacteria concentration and airborne bacteria concentration is needed.
-
4.
Because the index of surface deposition has attracted more and more attention, the settlement method to measure biological particles still has its applications.
Therefore, it is necessary to set criteria for both the settlement bacteria concentration and the airborne bacteria concentration, respectively. Of course, we also need to investigate the conversion relationship.
9.6.1 Proof of Омелянский Equation
Омелянский (referred to as O’s) equation from the former Soviets has been widely adopted for the conversion between the settlement bacteria and the airborne bacteria in China. This equation shows that the bacterial number settled on the 100 cm2 of culture medium within 5 min is the same as the airborne bacteria number in the air with volume 10 L. The volume of 10 L is a correction value. It can be expressed with the following formula:
where
-
NL is the bacteria concentration (#/L);
-
Ng is the colony number on 100 cm2 of culture medium within 5 min of deposition (#).
However, it is generally reflected that this formulation is not accurate. Somebody puts forward the actual test argument [34, 35]. Author thinks the main reason for inaccuracy is that suitable application conditions are not specified and it is used without consideration of occasions.
Since the literature about O’s formula is not founded, it will be proved with the principle in Chap. 6.
Now Eq. (6.27) is rewritten as follows:
It should be noted that the unit of N is “#/cm3.”
Based on the discussion about equivalent diameter, the diameter is 5–20 μm in the general environment, and in most cases, it can be 5–10 μm. If the average of the rage is used with dp = 7.5 μm and ρp = 2, we obtain vs = 0.33 cm/s. When they are put into the formula above, the amount of settlement bacteria on 100 cm2 within 5 min (300 s) is obtained:
where 10 is a correction value (L).
This is the proof of O’s formula, i.e., Eq. (9.10) [36].
9.6.2 Correction of Settlement Formula [36]
According to some measured data, the correction values are obtained with the above formula, which are shown in Table 9.14.
We can see from the table that the correction value is not equal to 10. The general rule is that the correction value is small in a clean place, which is only 3–5. It is larger in the place where more activities occur or at general outdoor environment, which is about 15–20. In places with a lot of activities (such as waiting hall, shopping malls in the table), the correction value exceeds 30. This means that for the same settlement quantity, large particles are more in the dirty place with a lot of people, and large particles are easy to settle, so the correction value is large. The settlement quantity can be reached when the airborne particle concentration is not large.
Different correction values will be found, because Eq. (6.27) for the settlement quantity is used, which is the general formula without any correction.
As proved in Chap. 6, Eq. (6.32) with polynomial corrosion should be used. Various correction coefficients in this equation can be calculated with the condition shown in Table 9.14, which are summarized in Table 9.15.
For the first situation in Tables 9.14 and 9.15, the air velocity in the asepsis room can be considered as 0.3 m/s. It is 0.15 m/s with the situations No. 2, 3, and 7, and ω = 0.88. It is about 0.25 m/s with the situations No. 8 and 9, and ω = 0.95. There are several kinds of air velocities with the situations No. 4, 5, and 6. It is the outdoor situation in spring with No. 4, the air velocity can be regarded as slightly larger than the indoor velocity 0.3 m/s, and the coefficient ω is 1.1. There is wind with grade 2–3 in situation No. 5, and ω is 1.2. There is wind with grade 4–5 in situation No. 6, and result with ω = 1.8 is better close to the measured data since both values of 1.4 and 1.8 are used for trial. Little data exist for No. 10, so it is not checked.
The situation No. 9 corresponds with spraying experiment, so \( \rho_p^{\prime } \) is 1, while for others it is 2–2.5.
The impact is the biggest for the equivalent diameter. Three times of difference can result in nearly 10 times of difference for the correction value. According to the previous principle and the condition set in Table 9.14, it is 3.9 μm for condition No. 1, and it is larger than 5 μm for condition No. 2 and 7. For condition No. 9, it should be calculated with real values. For other conditions, it is larger than 10 μm. So the value of α for condition No. 1 is 1.2, for conditions No. 2 and 7 are 1.16, and for the remaining conditions are 1.
The condition No. 1 is unnatural sedimentation. No. 9 is spherical drip. For both cases, \( \frac{1}{{\sqrt{\beta }}} \) = 1. While for other conditions, the correction item with β is considered.
Therefore, when one correction value of O’s formula is adopted, it is not appropriate, so it is inevitable that the result is not accurate. If the coefficient is not determined one by one according to the specific conditions, for the convenience of calculation, it is suggested to use the coefficient listed in the Table 9.16.
Calculated values with the coefficient in Table 9.16 are close to the measured values. If calculation is not performed, the correction values in Table 9.17 for reference can also be used directly.
When the Petri dish is used for measuring the settlement bacteria, the following derivation process should be performed:
where
-
Nm is the airborne bacteria concentration (#/m3);
-
C is the average colony on ф 90 Petri dish (#);
-
X is the correction value;
-
A is the area of the settlement plate expressed with square centimeter (based with ф 90 Petri dish);
-
T is the settling time (min).
After settlement of 30 min, we obtain
With O’s formula, X = 10. With Eq. (9.12), we can obtain
Example 9.1
There are five ф 90 Petri dishes placed in the cleanroom. After settlement of 30 min, there is one colony after the culture process. How much is the equivalent microbial concentration?
Solution
According to the passage, C(30) = 0.2. Because of the cleanroom, the correction value in Table 9.17 is X = 5. So
From the above expression, it is visible that the ratio Nm/C(5) is a constant value of 157.2 in O’s formula. While in the other methods, it is also a fixed value, and the specific number is different. Although there is a range for application, conditions are not specific [38], which is shown in Table 9.18. In addition to the data from author, others in the table are cited from literatures [38]. Of course it is not appropriate to use fixed value regardless of the circumstances. In author’s method, it is varied. In Eq. (9.13), it is different with different values of X, which is more consistent with the actual situation.
9.6.3 Application of Settlement Bacteria and Airborne Bacteria Methods in Cleanroom
-
1.
The airborne bacteria method should be an ideal microbiological sampling method due to the randomness of sampling, faster sampling, and less affected by sampling conditions, which could theoretically capture any carrier particles in the space.
But there are many kinds of principles for the airborne bacteria method. Each kind of principle corresponds with many methods, and each method may have a variety of models of the instruments. The measuring results with these instruments can vary a lot. In their respective most appropriate sampling range (diameter), there is a problem of sampling efficiency, which is difficult to compare with each other, and even conflicting [33].
Moreover, the pumped air in the airborne bacteria method is not from a certain position, so it is unfavorable for the analysis of microbial concentration field.
-
2.
When bacteria and virus are regarded as particles, the motion in the cleanroom with air supply is mainly controlled by the flow field. Wherever air can reach, the carrier particles can also arrive quickly. As long as the air can reach to the surface of the culture medium, carrier particles can also quickly contact the medium surface. There is the misunderstanding opinion that the settlement quantity is too little, and the settlement velocity is too slow, and it is even believed not suitable for cleanrooms, because the concept of “natural sedimentation” is still used when the settlement method is applied in cleanroom. The characteristic of particles following the airflow is ignored, so it is thought that it takes dozens of hours for the settlement. However, this is right for the naked bacteria particles only in absolute stationary windless place. In places with air supply, it is secondary for natural sedimentation. Of course, if the Petri dish is placed in the vortex area, the opportunity of contact with the Petri dish (base) is reduced by turbulent airflow and backflow. Therefore, a Petri dish should be put in the place where air can reach and where it is not vortex area.
-
3.
The settlement method has the characteristics such as the most simple and direct and can realistically reflect the natural pollution extent on the object surface (especially the control site). The monitoring data with the settlement method in the control site can reflect the site pollution feature more truly. If there is no pollution source along the upstream of the streamline (such as the filter leakage), the result with the settlement method is certainly not as high, although there may be pollution near the incoming flow at the same time (such as leakage). If the airborne bacteria method is adopted, it may suck the polluted airflow into the equipment, and judgment can be made that the bacterial concentration at this point is below standard which does not reflect the real situation. Of course, in order to reflect the concentration field realistically, enough Petri dishes need to be placed.
-
4.
Although with the conversion method close to reality, the data with the settlement method can be converted into the airborne bacteria concentration, accurate determination of some parameters during calculation is not easy. Different opinions about the recognition of results may be caused, especially when O’s formula with only one correction value is used.
Figure 9.8 shows the comparison of the sampled results with two kinds of airborne bacteria samplers in different occasions and the calculated results by O’s formula with one correction value based on the settlement method [33]. It shows that in clean environment, the sampled result with the settlement method is the least, while in dirty environment, the sampled result with the settlement method is the most.
If the settlement quantity under different circumstances is calculated with the correction form of O’s formula based on the above results, the polyline 4 is obtained and shown in the figure. For every environment, it is between the results with two airborne bacteria method.
Therefore, it is better not to evaluate the result with the settlement method through conversion but with the value in the microbial standard directly.
9.7 Bacterial Remove with Filter
Dust particles are often the carrier of bacteria. So in this sense, the more the airborne dust particles are, the more the opportunities of contact between bacteria and dust are, which means the opportunity of attachment of bacteria onto dust particles increases. So it is mainly dependent on air filtration to remove bacteria in biological cleanroom.
As for filters used for biological cleanroom, there are three problems which have attracted more attention. It will be discussed as follows.
9.7.1 Filtration Efficiency of HEPA Filter for Microorganism
Since the equivalent diameter of bacteria is much more than 0.5 μm, the filtration efficiency of HEPA filter for bacteria is nearly 100 %, so the outlet concentration of bacteria can be considered as “0.” When solution spray containing bacteria was used for test, since the size of the droplet solution is greater than bacteria itself, the efficiency obtained was quite high. For the commonly used HEPA filter, when it was exposed to air with bacterial concentration 8.2 × 10² to 6 × 10⁴#/L, the filtration efficiency for different size of bacteria and different filtration velocities was obtained, which is shown in Table 9.19 [39]. It can be seen from the table that the filtration efficiency for bacteria with their own size 0.1–0.5 μm is the same with the efficiency of the 0.3 μm DOP particles. Table 9.20 shows the efficiency of various air filters for viscid Serratia bacteria [40]. In the table, “DOP” represents the efficiency of 0.3 μm DOP particles, and “NBS” indicates the efficiency with the dust spot method, which will also be illustrated in later chapters.
Since for HEPA filter, the resistance is big and it is expensive, so it is not appropriate to use it for all the general biology cleanrooms with low requirement. From the above bacterial equivalent diameter, it is feasible to use sub-HEPA filter and even fine air filter. This view is also found in some research report overseas. For example, it has been reported that in the turbulent flow cleanroom with sub-high-efficiency air filter as the final air filter whose dust spot efficiency is equivalent to 90 %, where the air change rate was only 17 ~24 h−1, the average microorganism concentration in operation period of 30 years was only slightly higher than 0. 35#/L [41]. Experimental results of middle-efficiency air filter in China also prove that the filtration efficiency for bacteria reached over 80 % [42]. Author performed experiment on the sub-high-efficiency air filter and found that the filtration efficiency for Escherichia coli was up to 99.9 % [43].
As for virus, it is much smaller than bacteria. However, we can know from Table 9.9 that virus has no complete enzyme system. Compared with bacteria, it can even neither metabolize independently nor grow on inanimate medium. Instead, it can reproduce only in living host cells. Therefore, it also has carrier in the air, and it can be considered as a form of group. So it is unnecessary to worry about that HEPA filter can’t filter virus. Only when the carrier is small, the filtration efficiency may be lower. Test introduced in Sect. 9.4.2 has proved that the penetration of HEPA filter for the phage or virus which is smaller than 0.1 μm is also much less than the rated penetration of filter (for 0.3 μm DOP), which is shown in Table 9.21. This means that the efficiency of HEPA filter for virus is far outweigh the efficiency for 0.3 μm particles. This also explains that the equivalent diameter of virus is larger than 0.3 μm on the other hand.
Moreover, it is known from Fig. 9.9 [44] that it is not necessarily the case that all the efficiency for bacteria is large while that for virus is small.


Penetration of air filter for various kinds of microorganism
In conclusion, there are following features for filtration of air filters with bacteria and virus:
-
1.
No matter for bacteria or virus, filter efficiency will improve. This is of great significance to choose which kind of filter in biological cleanroom and to popularize its application.
-
2.
Dust particles and bacteria are removed at the same time, which is easy for application.
-
3.
When both dust particles and bacteria are kept outside of both the system and the cleanroom, the active pollution control is realized [45]. If bacteria are killed with disinfection method after they enter in, the corpse and the secretion left over by bacteria are still toxic.
-
4.
Side effect and harmful substance will not be generated.
-
5.
It is possible to control pollution in overall process when people are present.
-
6.
It has a certain amount of resistance. It is more meaningful to develop low-resistance products.
9.7.2 Penetration of Filter Medium for Bacteria
For people lack of knowledge about the characteristic of bacteria and filter material, they always worry about if the “live” bacteria can go through the filter material. Someone took part of the filter material from a used HEPA filter and put it onto the medium and perform the culture process [46]. The result is shown in Table 9.22. It shows bacteria were not found on the back of the filter medium. So the bacteria passing throughout problem is rejected. In addition, the culture result also shows that the bacteria attached on the windward face of the prefilter accounts for 90 % of the bacteria in whole flow, while it only accounted for 10 % on the windward face of HEPA filter. This also means that due to the large bacteria equivalent diameter, most are already filtered by the prefilter.
9.7.3 Reproduction of Microorganisms on Filter Material
This is the problem that both technical personnel and medical personnel are concerned about. Appropriate temperature, humidity, and nutrition are needed for the reproduction of bacteria. For filter material made of inorganic material, due to the lack of necessary nutrition, it is very difficult for bacteria to survive (although it has been found that there is almost nothing that bacteria do not “eat”). Someone took the filter material sample on the HEPA filter which has been used for 13,000 h in the operating room, and treatment was performed according to the following three kinds of conditions:
-
(1)
Put the dust collecting surface of filter material close on the medium.
-
(2)
According to method (1), sterile distilled water was dripped onto the filter material, which fully soaked the material.
-
(3)
According to method (1), the relative humidity is kept 90 %.
Result with culture is:
-
With the condition (1), the colony of hay bacteria and fungi formed on the filter material is (2–3 #/cm2). With condition (2), only mould colony was formed. With the high humidity condition (3), it is thought that the bacteria are unable to develop completely.
These results are shown in Fig. 9.10.


Growth situations of bacteria on filter. (a) Windward surface of HEPA filter after operation of 13,000 h in the operating room. The color of windward surface of air filter after operation is black. The white part represents the cross section of air filter media. (b) Bacterial growth on windward surface. Results for conditions (1), (2), and (3) are shown from left to right, respectively. The white part represents the CFU. The larger the area of white part is, the more the CFU is. The left one contains the most CFU
The test results show that after the capture of most bacteria on filter, due to inappropriate conditions of humidity and nutrition (temperature effect is not mentioned here), they approach to natural death, or only part of colony with the form of spore or fungus survives. If there is no nutrition source even in high humidity condition, bacteria also cannot survive. On the other hand, as long as there is nutrition source, bacteria are able to survive and develop even in the general environment. Distilled water itself is of no nutrition, but it may help the dissolution of nutrition particles contained in the filter material, and this is likely to be more beneficial for bacteria than high humidity.
9.8 Disinfection and Sterilization
9.8.1 Concept
It should not be deemed that when air entering into the biological cleanroom is sterile, all kinds of surface indoors will not be polluted by bacteria. If there is nutrition source in these places, the possibility for the reproduction of bacteria exists.
In biological cleanroom, human body is one of the main bacteria source. There is about 1–104 bacteria for every 6–7 cm2 skin, about 1 % of which are pathogenic. Bacteria will be released during the breath and talk of people. In biological cleanroom, not only ordinary mask should be used, sometimes mask made of high-efficiency filter paper is needed, which can reduce 4/5 of the bacterial quantity released than the former situation. Even the doctor must wear a set head-type gown with expiratory suction device, which has a better effect. So sterilization on surfaces in biological cleanroom is still an important measure.
But, sterilization and disinfection should be two different concepts.
Sterilization refers to the complete extinction of bacteria and virus, which has the absolute meaning. While the narrow meaning of disinfection is that in the process bacteria or virus will not be destroyed (traditionally bacterial spore is not included) due to the resistance to thermal effect or drug efficacy, which has relative meaning. For example, disinfection liquid wiped on surface is one example of disinfection.
9.8.2 Main Disinfection Methods
9.8.2.1 Dry Heating Method
This method is based on the principle that in the dry air with the heating treatment, microorganism is destroyed with the oxidation effect by intensive heating process. In general the temperature needed should be above 160 °C, and the time needed can reach 1–2 h.
9.8.2.2 Humid Heating Method
This is a sterilization method with high-temperature humidity steam (usually it is a saturated steam). It is based on the principle that protein will be solidified under the hot and humid environment. In general the temperature needed is lower than that of dry heating method, and the time is also short, for example, 12 min is needed for temperature 121 °C, or 2 min is needed for temperature 134 °C.
9.8.2.3 Drug Method
It is fumigated or scrubbed by a gas or agent. Its effect is related to the drug types and bacteria’s sensitivity to the drug. But designers must understand that some materials may adsorb some drugs to have erosion effect. For example, the common ethylene oxide is a kind of very good sterilizing agent. Although it cannot permeate the solid material, it can be absorbed by plastic, rubber, and so on, and it is toxic. So proper materials should be selected according to the object used in biological cleanroom.
9.8.2.4 Electromagnetic Radiation Method
It is based on the principle that bacterial protein and nucleic acid (deoxyribonucleic acid is DNA) are damaged, as well as the thermal effect after absorption.
Here it should be pointed out that although ultraviolet radiation sterilization is one of the sterilization methods, it is specified in the Article 17.34 of the GMP published in 1992 by World Health Organization (WHO): “because of the limited effect of ultraviolet, it cannot be used to replace the chemical disinfection.” It is also explicitly pointed out in Article 17.65 that: “ultraviolet radiation cannot be used as the final sterilization method.” These are also specified in the later version of GMPs in EU and China.
However, because in the special condition of air circulation, ultraviolet radiation sterilization still have a certain effect, which will be discussed in detail in the next section.
Among the above several sterilization methods, do not use a single method for a long time. It should be changed regularly in order to prevent the generation of drug-resistant bacteria.
9.8.3 Disinfection and Sterilization with Ultraviolet
9.8.3.1 Disinfection Sterilization Effect
Before the appearance of biological cleanroom, ultraviolet disinfection is an indispensible method for disinfection.
The optimal wavelength characteristic of ultraviolet disinfection corresponding with the best disinfection effect is in the range of 2,500–2,600 Å. The wavelength of market ultraviolet lamp is about 2,537 Å.
Here are some factors that influence ultraviolet disinfection sterilization effect:
-
1.
The opening time of tube. The rated output of tubes generally refers to the value after operation of 100 h. The initial output is 25 % higher than this value, and it decreases gradually between 100 and 3,000 h, which is only about 85 % of the rated value.
-
2.
Ambient temperature. Output is the largest at 20 °C, while it remains only 60 % at 0 °C.
-
3.
Ambient relative humidity. Most view is that the sterilization effect is best for the relative humidity between 40 and 60 %. When it is larger than 60–70 %, the rate of killing microorganisms will fall. Activation effect may appear for the relative humidity more than 80 %. But experiment also proves that the influence of humidity is conditional. At the beginning of the exposure, the effect is obvious. After 10–15 mins, this kind of influence is not very obvious [47]. Some research has proved that in the extreme high-humid environment, the sterilization rate will decrease. This is because that the adsorption of water on the virus surface may protect DNA and RNA from the damage by ultraviolet.
-
4.
Irradiation distance. In the distance within range of 500 mm from the light tube center, irradiation intensity is in inversely proportional with the distance. But for the distance larger than 500 mm, irradiation intensity is in inversely proportional to the distance squared [48]. Figure 9.11 shows one example for the relationship between the irradiation intensity and the distance for a 15 W ultraviolet lamp. We can see from the picture that when the irradiation intensity with the distance 100 mm is about 1,200 μW/cm2, it reduced to less than 600 μW/cm2 for the distance 200 mm, and it drops to 260 μW/cm2 for the distance 400 mm; the irradiation intensity is about 120 μW/cm2 for the distance 500 mm, and it reduced to one-fourth of the former value, i.e., 30 μW/cm2 for the distance 1,000 mm; it drops to one-fourth of the value for distance 1,000 mm, that is, 8 μW/cm2 for the distance 2,000 mm.
Fig. 9.11 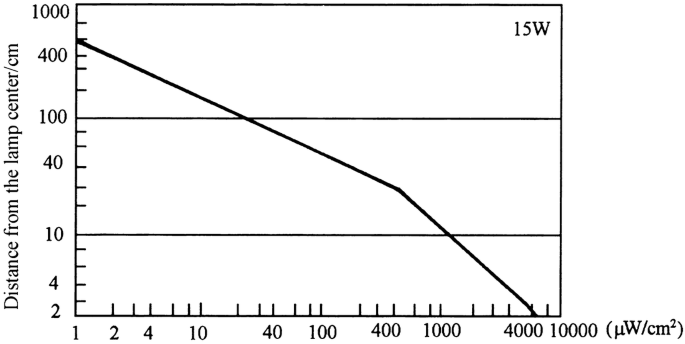
Relationship between distance and exposure intensity
-
5.
Bacteria type. Ultraviolet sterilization takes effect with the reason that pyrimidine polymers are formed on the DNA, which produces damage on DNA. But the sterilizing rate is different between different types of bacteria under this situation. This is because of the physical phenomena that since the membrane structure and shape of bacteria are different, the amount of ultraviolet radiation reaching to DNA is different [49].
If the exposure dose is defined as the product of the exposure intensity and the irradiation time, when the dose required for Escherichia coli is 1, the needed dose is about 1–3 for Staphylococcus, Mycobacterium tuberculosis, and so on; it is about 4–8 for hay bacteria and its spore and yeast and so on; it is about 2–50 for mould fungi. Compared with the negative coli such as Bacillus coli and Escherichia coli, the sterilization rate for the positive coccal gambogic Sarcina is only 1/5–1/6, and the sterilization rate for positive Bacillus such as the hay bacteria is only 1/11–1/14.
-
6.
Whether it is in the gas phase or on the culture medium. Table 9.23 gives the comparison of ultraviolet irradiation dose needed for the sterilization rate 90 % with various bacteria in the gas phase and on agar medium [49]. We can see that the sterilizing rate in gas phase is higher than that on the culture medium. The possible reason believed is that due to the surface tension, bacteria cover the water content of the culture medium, which reflects the ultraviolet ray and reduces the amount of ultraviolet ray arrived at the bacterial body. In addition, on the culture medium, there is only one direction for the ultraviolet irradiation, while in gas phase, the irradiation comes from various directions with the light-directed emitted from the germicidal lamp and reflected on the interior surface of the equipment. This is also one reason of high sterilization rate in the gas phase.
Table 9.23 Comparison of ULV radiation dose in gas phase and on the medium with the sterilization rate 90 % But it also can be considered that the ratio of necessary ultraviolet irradiation dose between the gas phase and the agar medium with sterilization rate 90 % is almost is a fixed value 0.3 (0.27–0.35) for four kinds of bacteria.
-
7.
Shelter. The penetration ability of UV ray is very low. Its function is limited to the exposed objects.
-
8.
“Light recovery.” Bacterial DNA is damaged with the exposure to ultraviolet radiation. But it can be repaired again by exposure to irradiation of visible light. The shortest recovery time is only 2 min, and the slowest recovery time is 1 h. That is the so-called “recovery” phenomenon. In practical applications, this phenomenon should be taken into account.


It is shown from the above influencing factors of sterilization effect:
-
1.
A long time is needed for the sterilization of UV irradiation on the exposed object. When the sterilization rate needs to reach 99 % for general bacterial, the irradiation dose should be approximately 10,000–30,000 μW/cm2. According to Fig. 9.11, when one 75 W UV lamp is placed at the height 2 m above the ground, the irradiation intensity is about 8 μW/cm2, so the irradiation time needed should be at least 1 h. During the 1 h (in fact it is often several hours) of irradiation, people cannot enter into the irradiation space, otherwise the skin cells will also be destroyed, which have the carcinogenic effects. So in biological cleanroom, the UV lamp has effect for the sterilization of surfaces including the ground. But for the indoor air with the relative convention status, the sterilization effect is very small, and the expected sterilizing effect is unstable. But even for the ground, it is difficult that all the irradiation rays arrived at the surface, so it is not more convenient than the sterilization with liquid medicine wiped on the surface.
-
2.
Although there is a certain effect of sterilization for indoor air, once the irradiation is stopped and human activities restored, in particular when outdoor air continues to enter the room, the original sterilization effect soon vanished.
-
3.
Usually ozone with large concentration is generated during the usage of UV lamp. When the irradiation stops, it even takes a long time for the dilution of ozone flavor before people enter, which affects the use effect.
-
4.
The most concern is that after exposure to the UV irradiation, bacteria have the antidrug ability. When Aerobacter cloacae and surface Staphylococcus are exposed to the UV irradiation, the former has the antidrug ability for five kinds of antibiotics including cephalosporin, and the later has the antidrug ability for three kinds of antibiotics. And both the survival periods are prolonged [55].
So the opinions shown in recent literatures are as follows [50–54]:
The sterilization method with UV irradiation should not be considered as the substitute of ventilation technology and HEPA filter, instead it is only an auxiliary measure. In clean operating room with air change rate larger than 4–6 h−1 or other rooms which are well designed, it seems that UV irradiation has little effect. Therefore, investigator from NIH, USA, recommended to use laminar flow technology as the available optional for infectious control. CDC from the USA does not recommend to use the sterilization method with UV irradiation as the precautious measure for SSI. In short, it is believed that “the mature status of this technology has not arrived yet.” When HEPA filters are used together, a certain effect will appear under special circumstances.
In brief, in the biological cleanroom with flowing air, ultraviolet has lost its position in air sterilization field. Air cleaning technology has completely replaced it. The reason to discuss it here is the interest of the sterilization with circulation air, which will have a role in the spaces where the air cleaning technology cannot be used but the sterilization is needed.
9.8.3.2 Sterilization with Air Circulation
9.8.3.2.1 Role
If air can be circulated through the effective irradiation area of the UV lamp, the UV-irradiation time on air will be increased. If the hurt by the leakage of UV light can be prevented and ozone is not generated, the sterilization effect on air by ultraviolet will be greatly improved. The UV lamp (light) can be turned on continuously. This is the idea of the sterilization by circulating air with ultraviolet.
This kind of air sterilization system with UV was used in a newly built hospital with 60 beds as early as in 1964 [56]. “Sterile” air (note: dust is not removed) was supplied to the operating room, delivery room, and so on, During 2 years of operation, the infection rate among 3,791 surgical cases by 90 doctors was only 0.2 %, while in another hospital, it was 0.19 %. In other two hospitals without application of such sterilization systems, the infection rates reached up to 1.3 %. In this sterilization system, the UV lamp was installed in the air duct. If the lamp is mounted within a device which is placed indoors, it will be more flexible and effective. This sterilization device has been produced successfully in China, which does not generate ozone.
9.8.3.2.2 Theoretical Formula of Rectangular Sterilizer
For a rectangular container as shown in Fig. 9.12, B is the height of airflow cross section, and A is one side exposure area of the container along direction of flow. Because it is a rectangular container, the exposed areas along the irradiation ray for the height B of the container are the same.


Rectangular container model for sterilization with circulated airflow
When the airflow rate is Q (m3/min), the time that air is exposed under the irradiation within the container is
where units of both A and B are “m.”
The greater the flow rate within the container is, the shorter the irradiation time is. But experiments have showed that when air velocity is between 0.37 and 0.76 m/s, there is no difference for the UV-irradiation intensity needed when the sterilization rate is required to be 90 % which is shown in Table 9.24 [49].
For the irradiation intensity I (μW/cm2), the linear proportional relationship between the survival rate of bacteria and the radiation doze on single logarithmic paper was obtained by experiment [49], which is shown in Fig. 9.14. It can be expressed with the following expression:


Relationship between the survival rate of bacteria and the radiation doze
or
where S is the bacterial survival rate;
E 0 is the necessary radiation dose (μW·min/cm2 or μW·s/cm2) when S = 10−1, and its values are shown in Table 9.23.
When Eq. (9.16) is rewritten, it is found that there is negative exponential relationship between the survival rate and the radiation dose, namely,
With Eqs. (9.14) and (9.16), the following expressions can be obtained:
Therefore, we get
where IA is the product of the UV intensity and the radiation area, which is the output (W) needed for the UV lamp.
In Eq. (9.19), except I and S, other variables are constant. So when the radiation intensity increases by one time, the survival rate S will reduce by an order of magnitude. For example, the necessary radiation dose for Escherichia coli is E0 = 1,000 μW · s/cm2 when the survival rate is S = 0.1. So if it is required S = 0.01, the radiation doze needed should be IA = 2E0 = 2,000 μW · s/cm2. When it is required S = 0.0001, the radiation doze needed should be IA = 4E0 = 4,000 μW · s/cm2.
If the value of E0 for the case S = 0.1 is used as the basis, we can obtain the radiation doze needed for the case S = 10-m:
When the needed output is equal as the practical output, i.e.,
where
-
\( W_t^{\prime } \) is the ultraviolet output of each UV lamp (w);
-
φ is the utilization factor of ultraviolet;
-
n is the UV lamp number.
So
If the sterilization efficiency for the E. coli is required to be 99 % (i.e., S = 0.01), the output needed of UV lamp can be obtained with Eq. (9.20) (note the following conversion of unit should be performed: m2 into cm2, s into min, and μW into W):
According Japanese data [49], the average rated output of ultraviolet for the general UV lamp with 15 W is 2.5 W. Usually the lowest utilization efficiency of ultraviolet generated by UV lamp can be considered as 50 %, which depends on the installation method of UV lamp, position and dead corner, etc. It is obvious that this is a safe value. With Eq. (9.22), we obtain:
If it is required that S = 0.1, we get:
According to the same literature, the number of UV lamps needed for the case S = 10−2 can be calculated in the rectangular air chamber, when it is under the condition of E0 = 11.5 μW · min/cm2 (for relative dry air). It is the following expression:
It is obvious that this expression cannot be applied to the circular air chamber. Besides, there are the limit conditions for rectangular container, where it is not appropriate to use any parameters for calculation. Therefore, it has significant limitations compared with Eq. (9.22).
9.8.3.2.3 Theoretical Formula for Cylindrical Sterilization Equipment
From the practical point of view, the cylindrical structure is better than the rectangular one. Based on the cylindrical structure with length l as shown in Fig. 9.14, author has derived the formula for cylindrical structure [57]. Since the UV lamps are placed all around, cylindrical air is exposed to the UV radiation on the wall with different areas, Ai = Dil. In order to simplify the derivation process, the circular area can be considered as many squares with equal area (where the volumetric flow rate is constant). It can be approximated with \( \overline{{{D_i}}}=B \) (B is the side length of the square). So the average cross-sectional area of exposure can be approximated as A = Bl. Because we know


One example of UV lamp layer in cylindrical container
So
If the radiation intensity on the surface is used as the basis, the following expression can be obtained for cylindrical container from Eq. (9.18):
The value of I can be obtained. When it is multiplied by the average exposure area A, the average ultraviolet output exposed on the surface of cylindrical structure is calculated, i.e.,
The UV output needed for the E. coli when S = 0.01 is:
The number of UV lamps can be obtained with Eq. (9.21), i.e.,
When S = 0.1, we obtain:
It is seen from the above formula that in the same air volume, the larger the cylindrical container is, the less the number of UV lamps is. The flow rate can be between 1.5 and 2.5 m/s.
When D = B, it is shown from the comparison between Eqs. (9.20) and (9.27) that the number of UV lamps in cylindrical container is 1.13 times of the square container. Although it is a slightly more, the cylindrical shape has the advantages of both the structure and the appearance.
With the unit conversion on Eq. (9.22), the sterilization efficiency of cylindrical ultraviolet sterilization equipment can be obtained by Eq. (9.20), i.e.,
So
or the number of 75w UV lamps is:
When the sterilization efficiency is P, then:
When the above equations are used to reexamine the design of actual cylindrical ultraviolet sterilization equipment [49, 56–59], the results are shown in Table 9.25.
Table 9.26 presents the sterilization effect in the same experimental room with domestic-made XK-1 screen-type cylindrical UV sterilization equipment with circulated air [47, 56, 57]. In the room, the original bacteria environment was created with the spray of the bacterium prodigiosum liquid, where it was 1.16 × 10⁷ pc/m3. The air change rate was 11.6 h−1. The temperature was 16.5 °C, and the relative humidity was 14 %. After the sterilization equipment was turned on, the sterilization effect at different time and at different height is presented in the table.
In the start period of 15 min, the sterilization efficiency did not reach the maximum. When the sterilization equipment works properly, the sterilization efficiency should be the maximum, which is the theoretical sterilization efficiency. The average efficiency at the time 60 min is 97.82 %, which is almost consistent with the calculated value 98.8 %. After 60 min, the total bacterial concentration indoors decreased gradually. The corresponding bacterial concentration before the UV equipment also decreased. So the sterilization efficiency maybe reduced.
In a cleanroom with area 11.6 m2 in a pharmaceutical factory, where any mechanical ventilation and air-conditioning equipment were not installed, one XK-1 sterilization equipment and one fresh air unit operated simultaneously. Since the fresh air unit has three stages of air filtration, including coarse, medium, and sub-high-efficiency air filters, the supplied outdoor air can be considered free of bacteria. It is reasonable to consider that the sterilization equipment plays the role of sterilizing the bacteria with circulated indoor air. With the measured data before and after the startup of the equipment, the actual sterilization efficiency is 93 %, which is slightly less than theoretical value. This is because the situation of actual cleanroom is much complex than the laboratory with circulated air only, which created more opportunity of bacterial pollution.
It should be also mentioned that although UV sterilization with circulation air has effect, air filter should be installed in the equipment in order to prevent the malfunction of UV lamp by the cover of dust particles. So for places where ventilation and air-conditioning systems are used, it is much simple to install filters with efficiency larger than fine filters. Meanwhile, it must be emphasized that UV light with circulation air still may cause the mutation of microorganism, so enough attention should be paid.
9.9 General Biological Cleanroom
According to the latest development of biological cleanroom technology, biological cleanroom can be divided into two categories, including the general biological cleanroom and the isolated biological cleanroom. The latter is also habitually called biosafety cleanroom (it is also termed as the biological cleanroom with biological risk).
In the general biological cleanroom, abbreviated as the biological cleanroom later, it is aimed to prevent the biological pollution from the working personnel. For example, the purpose of clean operating room is to prevent the bacterial infection of the operating site on the patient. For the working personnel himself, there is usually not risk. Similar as the industrial cleanroom, the positive pressurized environment should be kept indoors.
9.9.1 Type
Air pollution control mechanism in clean space is realized by the supply of clean air through HEPA filter placed at the air supply terminal, which is the largest difference for the concept between the cleaning air conditioner and the general air conditioner.
There is no basic difference between the general biological cleanroom and the industrial cleanroom. The former is guaranteed with the condition of air cleanliness. As for the biological cleanroom used in the hospital, especially the clean operating room, there is still the debate about the question whether vertical unidirectional flow cleanroom is superior than the horizontal one or vice versa. From the situations of the USA and Japan, in early times, the horizontal unidirectional flow cleanroom was much popular than the vertical one, because the number of newly built cleanroom was not much, or because the height of some renovated room was too low to make any fitment, where it is relative easy at the horizontal level. Later the type of local clean area was developed. At present, the type of local vertical unidirectional flow is more widely applied.
Figure 9.15 shows the pollution model of two kinds of clean operating room under usual circumstance. According to this model, the comparison between two kinds of clean operating rooms is performed, which is shown in Table 9.27.


Pollution models of vertical and horizontal unidirectional flow clean operating rooms
If many turbulent flow air supply outlets are concentrated, the mainstream area will be enlarged and the effect will be better. The detailed information will be presented in Chap. 15.
It is Germany that started the method to place the air supply outlets concentratedly above the operating table in the clean operating room. It is aimed to protect the critical area of the operating table. This is different from the development of model in the industrial cleanroom at that time. And this kind of clean operating room is called the sterilized operating room in Germany. It promotes the development of this cleanroom.
After the check by National Identification Committee is passed, the concepts of “overall cleaning” and “local cleaning” were put forward in 1979, which was also introduced in the officially published monograph “Measures of Air Cleaning Technique” in July of 1977 [60].
“It is called the overall cleaning that the whole indoor working area becomes the clean environment with the air cleaning and other comprehensive measures.” “It is called the local cleaning that the local indoor working area or specific local region becomes the clean environment.” “When the condition required by the process is satisfied, the local cleaning method should be adopted as much as possible.” Of course, this kind of local cleaning method will also have cleaning effect for the whole room.
It begins in China where the theoretical explanation for the effect of this concentrated air supply method was provided. The detailed specification was also provided, and the standard to distinguish the operating area from the surrounding area was developed [61]. With this method, the air change rate for Class 6 can be used to realize the air cleanliness Class 5 in the central cleaning area and Class 6 in surround area. The air change rate for Class 7 can be used to realize the air cleanliness Class 6 in the central cleaning area and Class 7 in surround area. The air change rate for Class 8 can be used to realize the air cleanliness Class 7 in the central cleaning area and Class 8 in surround area. So the energy-saving effect is obvious.
Figure 9.16 shows the division of concentrated air supply area in clean operating room in China [61].


Size of concentrated air supply outlets
In 2006, Russian Federal Standard GOST R52539 also adopted the classification method, where the air cleanliness in central area is Class 5 and in surrounding area Class 6.
9.9.2 Air Velocity
The air velocity to be discussed here refers to the value in the biological cleanroom with unidirectional flow field. For the cross-sectional air velocity in this kind of cleanroom, the recommended lower limit of air velocity for classification mentioned before should be referred. Because they are not only the reasons mentioned during the discussion of the lower limit velocity but also the following points in biological cleanroom of the hospital:
-
1.
From the above discussion about the relationship between the bacteria and the particle concentrations, when the supplied air velocity in unidirectional flow biological cleanroom is not 0.5 m/s, it has no influence on the indoor bacterial concentration. One experiment tested in the UK is cited here [62]. Among 16 cases of operating in vertical unidirectional flow cleanroom (10 cases for hip joint operation, 4 for antisternum operation, and 2 for knee joint operation), the relationship between the bacterial concentration and the indoor air velocity was obtained, where the bacterial concentration was sampled below the cut center on the patient body with the most direct release of bacteria. It is shown in Fig. 9.17. It is shown that the indoor bacterial concentration has almost reached stable, when the supplied air velocity reaches more than 0.3 m/s in vertical unidirectional flow cleanroom, or more than 0.35 m/s in horizontal unidirectional flow cleanroom. The improvement of air velocity on the indoor bacterial concentration is trivial. This conclusion completely coincides with the recommended lower limit of air velocity for the middle classification. It is also shown in this experiment that compared with the case in turbulent flow cleanroom when the supplied air velocity is 0.3 m/s, the bacterial concentration of vertical unidirectional flow cleanroom is less by 97 % and that of horizontal unidirectional flow cleanroom is less by 90 %.
Fig. 9.17 
Relationship between the bacterial concentration and the indoor air velocity
There are also similar results by numerical simulation. When the combined effect of airflow and the buoyancy plumes is considered, Ling Jihong obtained the results shown in Fig. 9.18 [63]. It is demonstrated that when the air velocity is less than 0.3 m/s, the bacterial concentration near the cut area increases dramatically. But there is also another opinion that with larger air velocity, the bacteria brought out by buoyancy plume from the cut area will be pressed back. But so far there is no test about this idea. Moreover, it is also not supported with the fact that the air velocity approaches “0” in the “triangular area” of the airflow center, which has been introduced in Chap. 8.
Fig. 9.18 
Bacterial concentration distribution in various areas with different air velocities
-
2.
Even in the clean operating room with temperature 26 °C, the patient on the operating table is easily to suffer from lacking of water under the supplied air velocity 0.5 m/s [64]. It is very disadvantageous for the patient with the lacking of water on the tissue near the cut. With this reason and others including the thermal comfort of the surgeon, the air velocity near the operating table is expected to be less than 0.25 m/s.
-
3.
In the cleaning ward or the cleaning cabin, the air velocity larger than 0.2 m/s is usually not needed. One reason is that there is not any disturbance, and the other is that the patient does not prefer any high air velocity. Deng Weipeng obtained the percentage of dissatisfied with six positions of air supply outlets [65]. Table 9.28 shows the results.
Table 9.28 Comparison of the percentage of dissatisfied for patients in the isolation ward with six positions of air supply outlets


It is shown from Table 9.28 that if the percentage of dissatisfied for patients should be less than 5 %, the air velocity at the face should be less than 0.1 m/s. Usually the air velocity at the face is required to be less than 0.12 m/s in comfortable air conditioning.
When the air supply outlet is not right above the human face, the relationship between the air velocities at the height 0.8 m and at the air supply outlet is obtained, which is shown in Table 9.29 [66].
9.9.3 Local Airflow
Here the several problems of local airflow in biological cleanroom ant its improvement methods will be emphasized.
-
1.
In the cleanroom where biological experiments are performed, including the plant cultivation and microorganism cultivation, a multilayer stand similar as the bookshelf is usually used. Every layer is full of various containers (even open containers) including the utensils, bottle, and jar. If vertical unidirectional flow was used, air can not only pass through the outside of the stand but also form the turbulent flow inside the stand. Therefore, it’s better to use horizontal unidirectional flow in this kind of cleanroom.
-
2.
In vertical unidirectional flow cleanroom, air flows downwards, so eddy maybe formed below the working table, where it is not easy to exhaust the polluted air from this region. Figure 9.19 is the experimental results with the water model [67]. When the air velocity is small, pollutants will accumulate below the table quickly, which is not easily removed. But when common air velocity is used, this kind of pollution can be removed quickly. The problem is that surgeons stand around the operating table in the clean operating room, which will weaken the air velocity passing through the table. Therefore, pollutants generated by occupants’ activity area easily accumulated under the table. With the occasional fierce activity, the airflow generated will disperse these pollutants outside of the table, which may cause risk for the patient on operation. This problem has also been noticed by some researchers abroad. They proposed a method to prevent the appearance of turbulent flow below the operating table and the apparatus table. For vertical airflow, the clean table cloth is used to cover the table until the floor, which will reduce the exchange between the air below the table and the clean air. Figure 9.20 shows the schematic of this proposal [1]. On the contrary, table cloth should not be used to cover the table until the floor for the horizontal flow cleanroom, so that air can pass through the region beneath the table. There are also different conclusions by calculation [63]. However, both of them are validated by experiment.
Fig. 9.19 
Pollutants accumulated under the working table. The black line represents the streamline of the colored liquid, i.e. the airflow streamline
Fig. 9.20 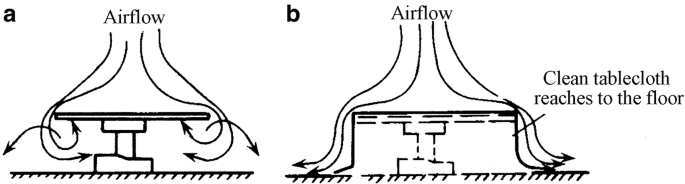
Method to prevent the appearance of eddy beneath the working table. (a) Situation with appearance of vortex flow below table. (b) Situation with cover of tablecloth
-
3.
The shadowless lamp usually used in the operation has very great influence on the air cleanliness; since it is too big to prevent, the airflow and the buoyant plume will be generated. At present, one kind of streamlined shadowless lamp is applied abroad. It is used to replace the big shadowless lamp, and several small shadowless lamps are used. With the streamlined shape, the influence on the airflow is greatly reduced. Figure 9.21 shows the situation of airflow below the shadowless lamp [68]. It is shown that airflow recovers to parallel flow under the distance of 35 cm below the lamp. Table 9.30 shows the comparison of these two kinds of shadowless lamps. Particles with diameter ≥0.5 μm are not detected below the streamlined shadowless lamp, while there are a lot of these particles under the usual shadowless lamp. Although bacteria are not detected for both cases, the probability of the existence of airborne bacteria will be large when particles are too much. In order to weaken the influence of turbulent flow below the shadowless lamp, it was proposed to supply clean air from the lamp body [69], but there is still no real product in the market. Moreover, there are many shadowless lamps inlayed in the ceiling, which is shown in Fig. 9.22.
Fig. 9.21 
Airflow below the shadowless lamp. The ellipse in the upper middle is the streamlined shadowless lamp. The black parts at both sides represent the head of occupant. In the middle, the white part means the smog released by experimenter.
Table 9.30 Comparison of two kinds of shadowless lamps Fig. 9.22 
Shadowless lamps inlayed in the ceiling


9.10 Isolated Biological Cleanroom
Compared with the general biological cleanroom, the difference of the isolated biological cleanroom is that it is aimed to prevent the escape of microbial contamination. Therefore, it has not requirement for the air cleanliness itself, where HEPA filter is not needed in the air supply system. But one or two HEPA filters must be installed before the exhaust of air to the ambient, and isolation is needed. Isolated biological cleanroom is also called the biological cleanroom with biological risk, or abbreviated as the hazardous biological cleanroom, such as biosafety laboratory and negative pressurized isolation ward.
9.10.1 Biological Risk Standard
The class of biosafety laboratory, which belongs to the isolated biological cleanroom, is determined by the risk extent of the microorganism isolated. Some foreign authoritative research agencies have published their own independent risk criteria.
In the early of 1990s, our country ever made the risk standard of microorganism. In 2004, the National Council published “Management Regulation of the Biosafety Laboratory with Pathogenic Microorganism.” Later in 2005 and in 2006, the Department of Agriculture and Department of Health issued the classification of pathogenic microorganism in animal and human, which is shown in Table 9.31.
It is shown that pathogene microorganisms for the risk degree above Class 2 include Class 1 and Class 2, which are relative large hazardous and the most hazardous. But it should be pointed out that in Chinese standard, the risk degree increases from 4 to 1, while in foreign standard, it increases from 1 to 4, which is shown in Table 9.32.
The risk levels in each column of Table 9.32 are the same. For example, the risk level of Class P3 in the USA is the equivalent to Class 3 in Japan and Class 2 in China.
9.10.2 Isolation Methods
The concept of isolation includes the first isolation and the second isolation. The first isolation refers to the isolation between staff and pathogenic. The second isolation means the isolation between the laboratory or the work area and the outside ambient. For high-biological-risk level, not only the first isolation measures but also the second isolation measures are needed. At present, the main method of the first isolation abroad is to use the biosafety cabinets or biosafety working table, which acts as a screen to prevent the escape of microorganism. With the second isolation, negative pressurized environment is created in the working area, where airlock chamber or even the buffer chamber should be set in the passage for occupant and sterilizer apparatus with high pressure should be placed for the delivery of goods into or out of the room. Figure 9.23 is such kind of this isolation method [70], which is called biosafety laboratory.


Isolated biological cleanroom. 1 biosafety cabinet, 2 HEPA filter, 3 sterilizer container with high pressure, 4 pass-by window, 5 shower and cloth replacement chamber, 6 airlock chamber
It is important to note the requirement for coming out is stricter than entering in for the occupants’ cloth requirement in isolated biological cleanroom. People must not only replace clothes but also pass through the shower and drying treatment, after which all the clothes must be disinfected and then cleaned.
9.10.3 Biosafety Cabinet
This is the first isolation means in the isolated biological cleanroom, which is similar to the negatively pressurized clean bench but has stricter requirements. Table 9.33 shows three kinds of specifications which are common in the world. The requirement of structure is shown in Fig. 9.24 [71–74].


Structure of biosafety cabinet. (a) Class 1. (b) Class 2 Type B. (c) Class 2 Type A. (d) Class 3. 1 HEPA filter, 2 safety glove
Table 9.34 shows the classification of biosafety cabinet according Chinese standard “Biosafety Cabinet” (JG170-2005).
Figure 9.25 illustrates the structure of domestic-made II-A biosafety cabinet.


Structure of domestic-made II-A biosafety cabinet
Here it should be pointed out that, according to the general provisions, if there is rotating machinery in the safety cabinet, other activities are not allowed indoors during the period when the rotating machinery is in use, which increases the possibility of the escape of pollutants out of the cabinet. When the operation in the safety cabinet is finished, the safety cabinet is not allowed to immediately stop; instead it should continue to run for several minutes before stop.
Detailed information about biosafety cleanroom and biosafety cabinet will be presented in Ref. [75].
9.10.4 Classification of Biosafety Laboratory
In 1983, World Health Organization (WHO) published “Laboratory Biosecurity Handbook,” and China’s Ministry of Health was authorized to publish it in our country in 1985 [70], where the explanation of four kinds of risk classes was described. It is shown in Table 9.35.
Table 9.36 shows the classification in Japan [71].
The classification of biosafety laboratory in China by national standards “General requirement of biosafety laboratory” (GB19489-2004) issued in 2004 and “Building technical specification of biosafety laboratory” (GB50346-2004) is consistent with international standards. There are four levels from 1 to 4 with the increasing requirements. In the revised version of GB50346 in 2011, there are three categories, which are shown in Tables 9.37 and 9.38.
For biosafety laboratories with Class 3 and Class 4 in China, air cleanliness levels are required, where air filter at the air supply terminal should be HEPA filter.
9.10.5 Negatively Pressurized Isolation Ward
As for one of the important applications of isolated biological cleanroom, great attention has been paid on the negatively pressurized isolation ward in hospital since the outbreak of SARS. The design concept is represented by “high negative pressure, seal door, and full fresh air.” This concept was called “static isolation” by author, which has poor performance, very expensive cost, and no benefit for promotion.
The novel theory of negative pressurized ward proposed by author is “dynamic isolation” [66, 76–79]. Low value of negative pressure (−5 Pa) is used to replace the high value. Buffer chamber used for negative pressurized cleanroom and common non-wooden door are used to replace the seal door. Dual air supply outlets, circulated air, and negative pressurized high-efficiency exhaust equipment sealed with dynamic air are used to replace the full fresh air.
Figure 9.26 shows the pressure distribution in negative pressurized isolation ward with planned pressure gradient 5 Pa [80].


Requirement of differential pressure
Because both the ward and its toilet are polluted area, exhaust air system is set in the toilet, where air must pass from the ward towards the toilet. From the theory of dynamic isolation, there is no requirement of the differential pressure between the ward and the toilet, instead it is only required that directional flow should pass from the ward towards the toilet. Exhausted air is adjusted in the toilet so that its negative pressure is slightly higher than the ward. Louver is set on the door of the toilet.
There is no requirement for the air cleanliness level in negative pressurized isolation ward. It is enough that air filters with medium efficiency or above should be placed in the air supply system. When part of the exhaust air will be used as circulated air and the other part exhausted with any influence on the ambient, HEPA filters must be installed.
9.10.6 Safety of Exhaust Air from Isolated Biological Cleanroom
9.10.6.1 Requirement of Zero Leakage Air Exhaust
Pathogenic microbe with risk may exist in the exhausted air from the isolated biological cleanroom. Not only the blockage effect of HEPA filters (even two filters) is needed, but also leakage is not allowed on the whole exhaust equipment.
Since the air outlet surface of the return air (or return air) is placed inside the wall, it is very difficult to detect and block the leakage. Therefore, it is necessary to invent air exhaust equipment without leakage in theory.
Negative pressurized high-efficiency air exhaust equipment with dynamic air sealing was developed by author and others [81], which belongs to the above kind of equipment. During the installation of HEPA filters in field, in-site detection apparatus (ancillary facility) must be installed at first to detect the leakage. Before installation, it should prove that there is no leakage. The main leakage position is near the frame, where leakage will not occur with dynamic airflow sealing technique.
Figure 9.27 shows the situation when this kind of air exhaust equipment is placed indoors.


Installation of air exhaust equipment with dynamic airflow sealing device
In this equipment, the surrounding of HEPA filter is positive pressurized cavity, which is connected with the air supply pipeline with the flexible pipe. It is shown by experiment that when the pressure in the positive pressurized cavity is 1 Pa, indoor aerosols will not be drawn towards the exhaust outlet through the leakage gap. In practice, the positive pressure in this cavity can be required to be 10 Pa, which will be displayed on the meter of the equipment.
This equipment is suitable for the application where in-site leakage detection is needed, such as the negative pressurized isolation ward.
9.10.6.2 Requirement of Air Exhaust with In-Site Leakage Detection
In-site leakage requirement is needed for the biosafety laboratory of Class 3 or even Class 4.
There are usual following features for the in-site leakage detection equipment:
-
1.
Manual leakage detection. During the leakage detection process, the probe should be inserted through the guide hole sealed onto the plastic glove into the box, where the detection support and speed of probe should be controlled.
-
2.
Automatic leakage detection. When the complex movement assembly is placed inside the box, it is easily polluted and difficult to maintain.
-
3.
The scanning trajectory does not overlap.
-
4.
It is line scanning instead of point scanning.
-
5.
The equipment is huge, which can only be installed on the technical interlayer sometimes.
-
6.
Disinfection can be performed at the original place.
-
7.
Differential pressure can be measured across air filter.
There are usual following features for the complete in-site leakage detection equipment:
-
1.
Both automatic and manual leakage detection can be performed.
-
2.
It is not leakage detection at fixed position (to measure the penetration). It is point scanning leakage detection, instead of the line scanning leakage detection.
-
3.
The scanning leakage detection trajectory overlaps.
-
4.
The mechanical component is placed outside of the equipment.
-
5.
The equipment is integrated with the monitoring system of the laboratory, which realized the long distance integrated control.
-
6.
Disinfection can be performed at the original place.
-
7.
Differential pressure can be measured across air filter in the equipment.
The international invention patented by author has the above features.
9.10.6.3 Requirement of the Safety Distance for Exhaust Air System
Although the requirement is high for the zero leakage of exhaust air and the long distance leakage detection, a certain value of safety distance is still required between the exhaust air outlet in some special applications and the public buildings nearby. This is because leakage may occur on air filters occasionally.
At first, in order to perform the safety assessment of safety distance for exhaust air, the limit of the safety value and dangerous value must be known, and the most unfavorable conditions should be used.
How much is the safety concentration of the microbe in the exhaust air? How much is the risky bacterial concentration in the environment? The results are different for different kinds of microorganism, but a reference can also be found.
Taking the Japanese standard (1983) as an example, it is stricter than the American standard. Table 9.39 shows the safety cabinets with Classes I and II applied in BSL-3 and lower-grade biosafety laboratories [82].
It is shown from Table 9.39 that:
-
1.
The safety airborne bacteria concentration near the working area is 5 × 1,000/28.3 × 10 = 17.7 CFU/m3. This can also be considered as the safety concentration in the environment.
-
2.
The simulated accidental bacteria concentration in the cabinet is 108–10 × 108/(volume of cabinet 0.5 m3) = (2–20) × 108/m3.
-
3.
For the safety test, the sprayed bacteria concentration reaches the magnitude of 108. In practice, the aerosol generated will not be so high, where aerosols are generated by spurting instead of spraying. The bacterial concentration can be considered as the maximum value in usual situation, i.e., 108–10 × 108/2.5 mL = (0.4–4)× 108#/mL.
-
4.
The total amount of microbial aerosol indoors ≥5 × 10⁶ CFU is considered as the upper limit of pollution in the room, which is used to test whether the samples in the cabinet will be affected by pollution.
Secondly, it is quite difficult to know the aerosol generation quantity during various operations. Table 9.40 shows part of the abstract about the fly-off coefficients of microbe during various kinds of experimental operations performed in Fort Detrick, USA [83].
It can be expressed with the following expression: β × average concentration of microorganism (#/mL) = sprayed microbial aerosol number (#).
It is shown from Table 9.40 that the maximum value of β is corresponding to the case when suction pipe is used for mixture (with blowout), which is 1 × 10⁻⁴. When the above bacterial concentration (0.4–4) × 108#/mL is used as the maximum value, the maximum quantity of microbial aerosol generated with different volume of bacterial liquid is shown as follow: (0.4–4) × 104# for dealing with 1 mL, (0.4–4) × 105# for dealing with 10 mL, (2–20) × 105# for dealing with 100 mL, and (0.4–4) × 106# for dealing with 100 mL. For example, the aerosol generated by the spray of bacterial liquid on the ground, when the bottle is smashed, is different from that by the operation of suction pipe.
Suppose this improper operation occurs near the exhaust air outlet within the room space of 1 m3, and the flow rate of exhaust air from one safety cabinet placed in the laboratory is usually 1,300 m3/h. During the improper operation, the air supply system will not stop, so the exhaust airflow rate will neither change. After mixed with the large volume exhaust air along the long exhaust pipeline, the leakage at the exit can be considered as uniform. When the number of leakage holes suddenly appeared on air filter is assumed to reach 10 and the diameter is assume 1 mm, the leakage flow rate of 10 leakage holes with diameter Φ1 under the differential pressure 400 Pa is about 0.36 m3/h [84]. The concentration at the exhaust outlet with the volume of bacterial liquid 100 mL is
If vertical exhaust method can be used for the dilution of the air from exhaust outlet, which is similar as the chimney, the safety distance from the surrounding environment can be shortened. The difference between the exhaust outlet and the chimney is that the cowl-like hat is needed for the exhaust outlet, which will influence the dispersion of airflow and may drive the airflow downwards. Therefore, for safety reason, the following calculation and analysis are performed with the common horizontal side exhaust outlet (Fig. 9.28).


Horizontal exhaust air outlet
The flow formed by the air jet from the orifice of this kind of exhaust outlet is one submerged jet flow, which is abbreviated as jet flow. Since the outdoor environment of the exhausted air completely follows the condition of infinite space jet flow, the theory of jet flow can be applied. When the most unfavorable windless condition is assumed with the circular tube jet flow (the equivalent diameter is used for noncircular tube) [85], the axial concentration difference can be expressed with the following equation according to the theory of jet flow as shown in Fig. 9.29 and the concentration difference equation for jet flow:


Theory of jet flow
where
-
ΔXm is the difference between the axial concentration and the ambient concentration;
-
ΔX0 is the difference between the outlet concentration and the ambient concentration.
Since the ambient concentration (test microbe) can be considered 0, ΔXm/ΔX0 can represent the ratio of the concentration at the cross section S and that at the outlet.
From the above calculation, we know the maximum concentration at the outlet should be 0.01 × 10⁵#/m3 for treating with the 100 mL bacterial liquid. When the safety value for environment is required 17.7#/m3, we can obtain ΔXm = 17.7#/m3 and ΔX0 = 0.01 × 10⁵#/m3.
For the bend nozzle with diameter d0, the turbulent flow coefficient of the air outlet can be α = 0.2. Then we get:
So S = 98.14 d0. We know \( {d_0}=0.0188\sqrt{{\frac{Q}{v}}} \), where Q is the exhaust flow rate, m3/h; and v is the exhaust air velocity, m/s. In consideration of the noise generated at the outlet, v should be less than 8 m/s. We can get d0 = 0.28 m.
When Q = 1,300 m3/h (which is equivalent with the situation of a safety cabinet in a laboratory with area 15 m2) and v = 6 m/s, we get S = 27.1 m. When the volume of bacterial liquid treated is 50 mL, S = 13.6 m.
The jet flow velocity can be as small as 0.25 m/s [86], and less than this value, the dispersion effect will be very small. So the ratio between the axial velocity vm and the outlet velocity v0 should be verified. According to experiment [86], the relative range of the wind S/d0 can reach 95, which is also one condition for verification. With the above two conditions, we obtain:
When S = 27 m, we obtain vm = 0.15 m/s. When S = (27.1 + 13.6)/2 = 20 m, we obtain vm = 0.25 m/s.
When S = 20 m, we obtain S/d0 =20/0.28 = 71.4.
It is shown that the result with S = 20 m is within the applicable range.
With the downwind condition, dispersion will be increased and safety probability will also be increased. For the safety reason, the influence of the air with downwind direction is not considered, and the windless condition is used for calculation of jet range.
In Ref. [87], it was mentioned that the above safety distance is the minimum value, which did not consider the psychological factor and safety coefficient.
In the revised version of national standard GB50346 in 2011, it specifies that the minimum distance between the exhaust air outlet from the biosafety laboratory containing biosafety cabinet and the public building is 20 m.
References
Inoue U (1974) Air conditioning technology in hospital. Build Equip Water Heat Constr 12(11):35–43 (In Japanese)
Fukuyama H (1979) Experience from one year operation of horizontal laminar flow system in cleanroom. J Jpn Air Clean Assoc 17(1):32–36 (In Japanese)
Yu XH (2011) Air cleaning: the major measure for removing microbial aerosol particles. J HV&AC 41(2):32–37 (In Chinese)
Charnley J, Eftekhar N (1969) Postoperative infection in total prosthetic replacement arthroplasty of the hip-joint with special reference to the bacterial content of the air of the operating room. Br J Surg 56(9):641–649
Wei XM (1980) Sterile cleanroom. J HV&AC 2:14–16 (In Chinese)
Xu QH, He WS, Ni JF (2002) Comparison of air disinfection methods in operating rooms. Chin J Nosocomiol 12(8):604–605 (In Chinese)
Xia MH (2011) Development and effect of the construction of clean operating department in a hospital. Chin J Public Health Eng 2:44–47 (In Chinese)
Healthcare Engineering Association of Japan (2004) Guidelines for design and operation of hospital HVAC systems, HEAS-02-2004 (Standards), Tokyo, Japan (In Japanese)
Wang WP (1994) Application of biological clean ward in the treatment of blood diseases and management of total environmental protection. People’s Liberation Army 307 Hospital (In Chinese)
Sato E (1977) The 3rd international symposium on contamination control. J Jpn Air Clean Assoc 14(7):17–22 (In Japanese).
Tanaka S (1979) Laminar flow cleanroom for Leukemia patient. J Jpn Air Clean Assoc 17(4):1–4 (In Japanese).
Ueda K (1977) Sterile ward in Paul-Brousse Hospital (Paris). J Jpn Air Clean Assoc 14(7):59–62 (In Japanese).
Xu ZL, Pan HH, Cao GQ, Shen JM (2013) Revision of the code for clean operating room from the point of view of quality control of modern products: Part 1 of the series of research practice of the revision task group of the architectural code for clean operating room. J HV&AC 43(3):7–9 (In Chinese)
Xu ZL (1980) The state-of-the-art of the biological clean room. J HV&AC 2:44–45 (In Chinese)
Xie HM, Sun DR (1975) Injection knowledge. People’s Medical Publishing House, Beijing (In Chinese)
State Pharmaceutical Administration (1992) Implementation details for management of laboratory animal (draft), Beijing, China (In Chinese)
Meckler M (1970) Packaged units provide clean room conditions in moon rock. Heat Pip Air Cond 42(7):71–76
Inoue U (1977) Biological cleanroom in hospital. J SHASE Jpn 51(1):1–4 (In Japanese).
China Center for Disease Control and Prevention (2003) Q&A for prevention and control of SARS. Peking Union Medical College Press, Beijing (In Chinese)
Hirasawa K (1970) Impact of atmospheric pollution on industrial products and medicine and its countermeasures. Jpn Air Cond Heat Refrig News 10(2):33–40 (In Japanese).
Shanghai First Medical College (1973) Practical internal medicine. People’s Medical Publishing House, Beijing (In Chinese)
Intag CE, Wiebe HA, Partain CL (1975) An investigation of the importance of air flow in control post-operative infections. ASHRAE J 2:27–33
Li HG (1988) The research on the equivalent diameter of microbial particles in air. J Tianjin Univ 1:57–61 (In Chinese)
Tu GB, Zhang SF (1990) Relationship between the filtration efficiency of microbe and particle for fibrous filter media. Contam Control Air Cond Technol 2:20–21 (In Chinese)
Yao GL, Fan CY (1981) Determination of the air cleanliness level in sterile room with the bacterial deposition method. Science and Technology Information Station at Tongji University, Shanghai (In Chinese)
Xu ZL, Shen JM (1989) Application of air cleaning technology. China Architecture & Building Press, Beijing, p 272 (In Chinese)
Yu XH, Che FX (1998) Modern air microbiology and sampling detection and identification techniques. Military Medical Science Press, Beijing, p 82 (In Chinese)
Sellers RF, Parker J (1969) Airborne excretion of foot-and-mouth disease virus. J Hyg 67:671–677
Parker MT (1978) Hospital-acquired infections: guidelines to laboratory methods. WHO Regional Publications European Series No.4, Copenhagen
Zhong XL (2010) Main hazards and countermeasures in management for prevention and control of infection in operating room in China. In: The 19th national conference on nosocomial infection of Chinese and the 6th Shanghai International Forum of Infection Control (SIFIC), Shanghai, China (In Chinese)
Feng X, Xu ZL (2013) Necessity of particulate pollutant control in clean operating environment: Part 2 of the series of research practice of the revision task group of the Architectural technical code for hospital clean operating department. J HV&AC 43(4):1–5 (In Chinese)
YFB001-1995 (1995) Technical standard for construction of cleaning operation room in Military Army Hospital, Ministry of Health of P.R.China, Beijing, China, 7 (In Chinese)
Xu ZL (1999) Discussion of the question whether the sedimentation method can be used to determined the bacterial concentration in cleanroom. Chin J Public Health 15(9):777–780 (In Chinese)
Zhang LH, Lu WZ, Yang XP et al (1989) Quantitative conversion relationship (correction value) of two sampling methods and comparison with obtained particle size distribution. Chin J Public Health 8(5):315–317 (In Chinese)
Shi NS, Zhu PK, Wu ZY (1986) Development of LWC1 type centrifugal air microbial sampler. Institute of HVAC of China Academy of Building Science Research, p 13 (In Chinese)
Xu ZL (1993) Relationship between the results with the precipitating bacterial method and the planktonic bacterial method. Chin J Public Health 9(4):150–162 (In Chinese).
Research group of air conditioning system in hospital at Tongji University (written by Fan Cunyang) (1982) Principle and application of biological cleaning technology. Science and Technology Information Station at Tongji University (In Chinese)
Wang L, Tu GB (1990) Relationship between the measured concentration by Koch method and the airborne bacterial concentration. Contam Control Air Cond Technol 1:27–30 (In Chinese)
Huruhashi M (1978) Study on bacterial filtration performance of HEPA filter. J Jpn Air Clean Assoc 15(7):1–10 (In Japanese)
Huruhashi M (1980) Usage problem of biological cleanroom. J Jpn Air Clean Assoc 17(7):19–25 (In Japanese).
Gaulin RP (1966) Design of hospital ventilation systems in respect to surgery. AACC Proceedings
Li HY (1984) Study of middle efficiency air cleaning system in biological clean operating room. Master dissertation at Tianjin University (In Chinese)
Xu ZL, Shen JM (1987) YGG and YGF type low resistance sub-high efficiency air filter. Research report of Building Science. China Academy of Building Science Research, pp 5–2 (In Chinese)
Yan H (2009) Cleaning technology by UVGI and the combination of air filter and UVGI. Mech Elect Inform 29:8 (In Chinese)
Xu ZL (2007) Solution for the pollution control in the duct of centralized air cleaning system (I). Clean Technol 18 (In Chinese)
Yamayoshi T et al (1978) Study on bacteria in sterile environment. J Jpn Air Clean Assoc 16(6):1–6 (In Japanese)
Xu LD, Wang JQ, Lin B, Wang JQ, Wang YB (1993) Design of shielded circulating air UV disinfection device and its performance. Chin J Public Health Eng 3:8–9 (In Chinese).
Huruhashi M (1990) Current study status of ultraviolet sterilization irradiation. Jpn J Medical Equip 6(7):315–326 (In Japanese).
Adachi S et al. (1989) Microbicidal effects of ultraviolet radiation on environmental microorganisms. Jpn J Antibiot 17(1):15–21 (In Japanese).
Yu XH (2010) Characteristics of ultraviolet germicidal irradiation and application analysis. J HV&AC 40(7):58–62 (In Chinese).
First MW, Nardell EA, Chaisson W, Riley R (1999) Guidelines for the application of upper-room ultraviolet germicidal irradiation for preventing transmission of airborne contagion. Part II: design and operation guidance. ASHRAE Trans 105:77–88
ASHRAE (2008) Chapter 16: Ultraviolet lamp systems. In: ASHRAE handbook: HVAC systems and equipment. ASHRAE, Atlanta
Centers for Disease Control and Prevention and Healthcare Infection Control Practices Advisory Committee (2003) Guidelines for environmental infection control in healthcare facilities: recommendations of CDC and the Healthcare Infection Control Practices Advisory Committee (HICPAC). Morb Mortal Recomm Rep 52(RR-10):1–42
Memarzadeh F, Olmsted RN, Bartley JM (2010) Applications of ultraviolet germicidal irradiation disinfection in healthcare facilities: effective adjunct, but not stand-alone technology. Am J Infect Control 38(suppl 1):S13–24
Sun RG, Wang MY, Gao H (2009) The effect of ultraviolet irradiation on the two different types of bacteria. Chin J Disinfect 26:2 (In Chinese)
Chen CY, Xu ZL, Lin B, Xu LD (1993) Comprehensive report on the development of shielded circulating air UV disinfection device (material from appraisal meeting) (In Chinese)
Xu ZL, Chen CY, Shen JM (1998) Calculating method for the necessary lamps and sterile rate in a tube shaped ultraviolet air washer. J Hyg Res 3:213–216 (In Chinese).
Shen JM, He SP, Sun GQ (1993) Structural design of circulating air UV disinfection device. J Shanghai Urban Constr Coll 4:50–55 (In Chinese)
Xu ZL, Chen CY (1993) Development of shielded circulating air UV disinfection device (material from appraisal meeting) (In Chinese)
Preparation Group for Air Cleaning Technology Measures (1979) Air cleaning technology measures. China Architecture & Building Press, Beijing (In Chinese)
GB50333–2002 (2002) Architectural technical code for hospital clean operating department. China Planning Press, Beijing (In Chinese)
Field AA (1973) Operating theater air conditioning. Heat Pip Air Cond 45(11):91–93
Ling JH (2005) Study on air cleaning effect in operating room. Tianjin University, Tianjin (In Chinese)
Inoue U (1971) New air conditioning method in operating room. Heat Pip Air Cond 9(7):41–52 (In Japanese)
Deng WP (2005) Comprehensive measures to prevent spread and infection of SARS virus in the hospital building and countermeasures. Tongji University, Shanghai (In Chinese)
Xu ZL (2006) Design principle of isolation ward. Science Press, Beijing, p 127 (In Chinese)
Xu ZL, Shi NS, Lu Y (1981) Characteristic study of air flow in cleanroom with air supply fully on the ceiling and air return at two bottom sides. Research Report of Building Science. China Academy of Building Science Research, p 11 (In Chinese)
Akiyama Y et al. (1977) Experience from laminar flow sterile operating room. J SHASE Jpn 51(1):33–43 (In Japanese).
Sano T (1876) Influence of obstacle and thermal plume in laminar flow room. J Jpn Air Clean Assoc 17(1):37–42 (In Japanese)
WHO (1985) Laboratory biosafety manual, 1983 (trans: Ma Yuanshan and Li Shengtian). People’s Medical Publishing House, Beijing (In Chinese)
Tanaka M et al. (1979) Biological risk facilities by NIH. J Jpn Air Clean Assoc 16(7):46–55 (In Japanese)
Yamauchi K (1980) Basic viewpoints of biological hazards measures and isolation facilities. J Jpn Air Clean Assoc 17(7):1–11 (In Japanese)
Editorial Department of Science (1980) History of 10 years of genetic engineering. Scientist Press Co., Ltd., Japan (In Japanese)
ASHRAE (1978) Chapter 15. In: ASHRAE Handbook-HVAC applications, Atlanta, U.S.A.
Xu ZL, Wang QQ (2004) Biosafety laboratory and biological safety cabinets. China Architecture & Building Press, Beijing (In Chinese)
Xu ZL, Zhang YZ et al. (2006) Study on isolation effects of isolation wards (1). J HV&AC 1:1 (In Chinese).
Xu ZL, Zhang YZ et al. (2006) Study on isolation effects of isolation wards (3). J HV&AC 4:1 (In Chinese)
Xu ZL, Zhang YZ et al. (2006) Study on isolation effects of isolation wards (1). J HV&AC 1:1 (In Chinese)
Xu ZL, Zhang YZ et al. (2006) Study on isolation effects of isolation wards (2). J HV&AC 3:1 (In Chinese)
Xu ZL, Wu YH (2010) Requirements of the basic configuration for isolation ward building. China Architecture & Building Press, Beijing (In Chinese)
Xu ZL, Zhang YZ et al (2005) Study on the dynamic airflow sealing negative pressure exhaust device (Invention patent). Build Sci 57 (In Chinese)
Japan Air Cleaning Association (1981) Standard for Class II biological safety cabinets. JIS (Japanese Industrial Standard), Tokyo, Japan (In Japanese)
Ootani M (1981) Countermeasure manual for biohazard. Kindai Press, Japan (In Japanese)
Xu ZL (2004) Bio-safety laboratory, Bio-safety seminars by Chinese Contamination Control Society, p 236 (In Chinese)
Zhou MR (1979) Hydromechanics – pump and fan. China Architecture & Building Press, Beijing, p 240 (In Chinese)
No. 10 Design & Research Institute from Ministry of Machinery and Electronics Industry of China (1995) Design manual of air conditioner, 2nd edn. China Architecture & Building Press, Beijing, p 249 (In Chinese)
Xu ZL, Wang QQ et al (2004) The safe distance of a biosafety lab considered form the angle of exhaust air diffusion. Build Sci 4:46 (In Chinese)
Author information
Authors and Affiliations
Rights and permissions
Copyright information
© 2014 Springer-Verlag Berlin Heidelberg
About this chapter
Cite this chapter
Xu, Z. (2014). Theory of Biological Cleanroom. In: Fundamentals of Air Cleaning Technology and Its Application in Cleanrooms. Springer, Berlin, Heidelberg. https://doi.org/10.1007/978-3-642-39374-7_9
Download citation
DOI: https://doi.org/10.1007/978-3-642-39374-7_9
Published:
Publisher Name: Springer, Berlin, Heidelberg
Print ISBN: 978-3-642-39373-0
Online ISBN: 978-3-642-39374-7
eBook Packages: EngineeringEngineering (R0)