
Abstract
Smartwatches, which contain an accelerometer and gyroscope, have recently been used to implement gait/activity-based biometrics. However, many research questions have not been addressed in the prior work such as the training and test data was collected in the same day from a limited dataset, using unrealistic activities (e.g., punch) and/or the authors did not carry out any particular study to identify the most discriminative features. This paper aims to highlight the impact of these factors on the biometric performance. The acceleration and gyroscope data of the gait and game activity was captured from 60 users over multiple days, which resulted in a totally of 24 h of the user’s movement. Segment-based approach was used to divide the time-series acceleration and gyroscope data. When the cross-day evaluation was applied, the best obtained EER was 0.69%, and 4.54% for the walking and game activities respectively. The EERs were significantly reduced into 0.05% and 2.35% for the above activities by introducing the majority voting schema. These results were obtained by utilizing a novel feature selection process in which the system minimizing the number of features and maximizing the discriminative information. The results have shown that smartwatch-based activity recognition has significant potential to recognize individuals in a continuous and user friendly approach.
You have full access to this open access chapter, Download conference paper PDF
Keywords
- Biometrics
- Mobile authentication
- Gait biometrics
- Accelerometer
- Smartwatch authentication
- Activity recognition
- Neural network
- User authentication
1 Introduction
Activity recognition studies that used the acceleration (Acc) and gyroscope (Gyr) data to identify the user’s identity based on their physical activities (e.g., normal walking and typing) attracted a lot of research. However, a large amount of the prior art captured the user’s movement data by using costly specialized devices (i.e., attaching a wearable sensor to different positions around the human body such as hip, waist, and lower leg) [1,2,3]. Furthermore, these devices require a comprehensive set-up that reduce the usefulness of their performance and increases the cost of implementation into a potential real-world system. Although the applications of activity recognition are greatly expanded by utilizing the potential of smartphone sensors (i.e., Acc and Gyr), it is widely understood that smartphones suffer from several issues to produce a consistent and reliable biometric signal in real life. For example, the problem of orientations (i.e., screen rotations) and off-body carry (e.g., when the device is carried in a handbag), making the collected data less accurate or unusable. These limitations can be addressed by alternative techniques such as smartwatches, which contain the requisite sensors such as Acc Gyr, due to their fixed contact with individuals (i.e., either on left or right wrist). As a result, these devices have the ability to capture more accurate personal data than smartphones do.
Traditional user authentication approaches on smartphones and smartwatches such as password and PIN-based authentication are considered significantly intrusive which impact their usability and subsequently security [4,5,6]. For example, Microsoft conducted a comprehensive study and showed that 72% of participants disabled their login credentials (i.e., PIN code) because of its intrusive implementation [7]. Moreover, PIN-based authentication technique is susceptible to several types of attacks such as brute force and shoulder surfing [8]. Given that smartwatches are usually connected with a smartphone via Bluetooth, implicit and continuous authentication to secure information on both devices from unauthorized access is essential. Activity recognition using smartwatches offers several advantages over traditional authentication techniques. For instance, it is reliable (i.e., nearly impossible to imitate), convenient for a user (i.e., does not require explicit user interaction with a sensor during authentication), and provides transparent and continuous user authentication as long as the user’s hand moves [6]. To this end, this paper explores the use of smartwatches for transparent authentication based upon gait and game activities. The main contributions of this study are demonstrated as follows:
-
To the best of the author’s knowledge, this is the biggest dataset for smartwatch-based gait authentication, which contains gait data of 60 users over multiple days
-
The novel feature selection method utilised a dynamic feature vector for each user and successfully reduced the feature vector size with better performance.
-
Identifying the optimal source sensor for the authentication task.
-
Highlighting the impact of Majority schema on the system accuracy.
-
Vastly superior results were achieved that outperform the prior accelerometer – based studies.
The rest of the paper is organized as follows: Sect. 2 reviews the state of the art in transparent and continuous authentication that specifically uses accelerometer and gyroscope sensors. Data collection, feature extraction, the experimental procedure, and results are outlined in Sects. 3 and 4. Section 5 presents the conclusions and future research directions.
2 Related Work
Behavioural biometrics systems aim to authenticate individuals transparently based upon their activities (e.g., gait, keystroke, and handwriting). Apart from the traditional authentication approaches (i.e., PIN and passwords), a significant amount of studies have recently explored the use of built in smartphones sensors in order to improve the level of security as well as offer continuous and unobtrusive authentication. For example, Zhen et al. [9] proposed to verify users based upon their keystroke while other studies involved gait [16,17,18,19,20], activity [11,12,13,14], typing [33, 34], and arm movement [15, 23, 25]. The use of sensor data, specifically the Acc and Gyr data, attracting an enormous amount of attention. Whilst previous research in activity recognition has focused on body worn sensors or using the smartphone sensors (i.e. Acc and Gyr), little attention is given to the use of smartwatches – which tend to be sensor-rich highly personal technologies. Moreover, given that smartwatches are usually worn in a fixed position (i.e. right or left wrist), they offer the opportunity to collect the user’s motion data in a more effective and reliable fashion than smartphones could. A comprehensive analysis of the prior studies on activity and gait recognition using smartphones and smartwatches sensors is summarized in Table 1.
Although the presented studies in Table 1 provide important insight in the domain of sensor-based activity recognition, they suffer from several issues such as data collection methodology. In most evaluations a relatively small dataset was used and frequently obtained on the same day (SD), which is not a realistic evaluation as such data does not show the variability of the human behaviour over the time and might be overlap across a large population. Most research claim a system resilient to the cross-day (CD) problem either trains on data from trials that are also used to test (thus not making it a true cross-day system) or has a high error rate, preventing the system being used practically. The lack of realistic data underpins a significant barrier in applying activity recognition in practice. Therefore, this study presents a realistic scenario (in terms of the data collection) by training and testing the user’s movement data over multiple days. Moreover, the most effective device (i.e., smartwatches) is used to collect the user’s motion signal, and hence design an effective transparent and continuous user authentication system for both smartphones/smartwatches.
With respect to features, cycle and segment-based approaches are used in order to pre-process the raw Acc and Gyr data and then extract several statistical and cepstral coefficient features from the segmented data (e.g., standard deviation, Variance, and Mel Frequency Cepstral Coefficients). While the cycle-based approach offers a precise manner of generating samples from the testing data by detecting steps and splitting the data accordingly, most recent studies showed that the fundamental performance of using cycle extraction method was low (At best 14.4% of EER). The high error rate of using this method was highlighted by several studies [4,5,6, 18] such as smartphones not being securely fastened to the user, cheap sensors, cycles are not guaranteed to be the same length, and rounding errors. In contrast, more promising results (i.e., EERs ranging from 1.4% to 8.24%) were reported by applying the segment-based approach to the raw data [19, 22].
To predict the user’s identity, several studies utilized the standard classification methods (e.g. Euclidean Distance and Dynamic Time Warping metrics) to create a single reference template and is later tested based upon the similarity between the template and the test data. While this approach works well for certain biometric modalities (e.g., fingerprint or facial recognition), it does not seem to be the most effective type of system for activity recognition or other behavioural biometric techniques. This is because the user’s behaviour can change over time and be affected by other factors (e.g., mood and health). Therefore, this paper applied more complex algorithms (e.g., Neural Networks) to train and test the user’s reference template.
3 Experimental Methodology
In order to overcome some of the shortcomings of prior work, this paper will explore the following research questions:
-
1-
How does the accuracy vary across same and cross-day evaluation methodologies?
-
2-
Which sensor can provide a more consistent and reliable motion data for recognizing individuals?
-
3-
What impact do features have upon performance?
-
4-
What is the impact of applying the Majority voting schema on the system performance?
To address these questions, the following experiments were conducted:
-
Same & Cross day evaluation, accelerometer Vs gyroscope sensor (research questions 1 and 2)
-
Dynamic feature selection (research question 3)
-
Majority Voting Schema (research question 4).
3.1 Data Collection
This section describes the procedure for collecting the data and transforming it into a form suitable for traditional machine learning classification algorithms. As mentioned earlier in Sect. 2, the data collection methodology is definitely an issue for most gait and activity recognition related studies (e.g., the user’s motion data was collected by placing a smartphone in a fixed position, using small dataset that was frequently captured on the same day). Therefore, it is important to select the most appropriate technology to capture the movement data and ensure the population sample being used as large and significantly reliable as possible. To achieve that, this study utilized the Microsoft Band to collect 24 hours of the movement data from 60 users; to the best of the author’s knowledge, this is the largest dataset within this domain. During the data collection, the Acc and Gyr signal were sampled at 32 Hz. As soon as the data was collected by the smartwatch, it was sent to a smartphone residing in the user’s pocket via Bluetooth. For all 60 users, each was asked to follow a predefined scenario. Aiming to study the practicality of such a system, the scenario included two simple and realistic activities that reflect the user’s daily activities (i.e., normal walk, and playing Game). Each user completed six sessions for each activity over multiple days (a single session contained two minutes of the user’s motion data); each of the three sessions were provided on different days within a time frame of 3 weeks. For the gait activity, users were required to walk on a predefined route on flat ground and encouraged to walk in their own natural and comfortable manner. For a more realistic scenario, the user had to stop in order to open a door, and take multiple turns. Moreover, no other variables, such as type of footwear or clothing, were controlled. In the game activity, users were asked to sit and playing a simple game on the touch screen of their smartphone. Once the data collection was completed, the signal processing phase was undertaken - a brief description of the steps are
-
Time interpolation: Due to the limited accuracy of the sensors in the Microsoft Band, the smartwatch was not able to record data at a fixed sample rate. Therefore, time interpolation was required to make sure that the time period between two successive data points was always equal.
-
Filtering: a low pass filter was applied in order to enhance the accuracy of the signal. This was carried out with several settings (i.e., 10, 20, and 30) and through experimentation the cut-off frequency of 20 Hz achieved the best accuracy (examples of the filtering are shown in Fig. 1).
Fig. 1. 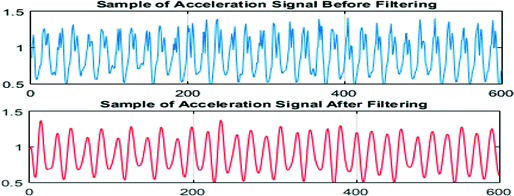
The acceleration signal before and after filtering
-
Segmentation: the tri-axial raw format for both Acc and Gyr signals were segmented into 10 seconds segments by using a sliding window approach with no overlapping. Therefore, in total 72 samples for each activity and each user over multiple days were gathered.

3.2 Feature Extraction
As illustrated earlier, the raw Acc and Gyr signals are segmented into 10 seconds of time-series data and hence represented by a fixed set of features. In total, 88 of the time domain features were extracted based upon prior work identified in gait and activity recognition studies [10,11,12,13,14,15,16,17,18,19,20]. These features are the same regardless of whether the sample is being generated from Acc and Gyr sensor data. Since most features are generated on a per-axis basis and each sensor has 3 axes, most features are represented by a vector of three values. Details of these features (e.g., what they are and how they are calculated) are presented in Table 2.
The feature selection step has become the focus of many research studies in the area of authentication in order to reduce the potentially large dimensionality of input data, with the resultant effect of enhancing performance and reducing the computational complexity of the classifier. Subsequently making it easier to manipulate and calculate feature vectors on processing and battery limited digital devices. This study utilised a dynamic feature vector that contains distinctive features for each user. For example, the reference template of user 1 could be created by using features 1, 2, 3, and 7 while features 3, 4, 5, and 7 might be used to form the reference template of user 2. This is achieved by calculating the mean and standard deviation (STD) for each feature individually for all users and then compares the authorized user’s results against impostors to select the feature set with the minimal overlap. In other words, for each feature, a score is calculated based upon the following condition:
-
If the mean of imposter’s activity is not within the range of the mean +/- STD of genuine, add 1 to the total score.
-
Dynamically select the features according to their score order from high to low. The highest means less overlap between imposters and the genuine user as shown in Fig. 2.
Fig. 2. 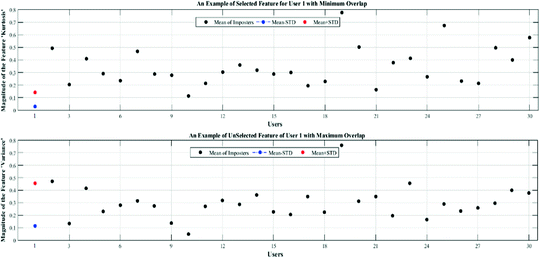
The effect of the dynamic feature selection approach

3.3 Experimental Procedure
Biometric authentication or verification is a binary classification problem, where the aim is to determine if a system can identify a user correctly (a “genuine” user) or as an imposter. The reference and testing templates were created under two different scenarios (i.e., SD, and CD). In the SD scenario, the dataset was divided into two parts: 60% was used to train the classifier while the remaining 40% was utilised to evaluate the performance. To test the system under the CD scenario, the data from the first day was used for training and the second day data was employed for testing. A Feedforward Multi-layer Perceptron (FF MLP) neural network was used as the default classifier for the walking and game activities due to its reliable performance [6, 10]. For each experiment, four different FF MLP neural network training size were evaluated (i.e., 10, 15, 20, and 25) with an average of repeating each of them 10 times. All the presented results in this study were based on using FF MLP neural network of size 10 as it showed the lowest EER.
4 Results
After research questions of the prior art were identified and presented in the previous section, details of the results for the two evaluation scenarios (SD and CD), the two different smartwatch sensors (i.e., Acc and Gyr), are presented in the following subsections. The results are first presented for “single-sample mode” and then using the majority voting scheme.
4.1 Single Day vs Cross Day Evaluation
A well-known serious criticism of the prior gait/activity-based biometrics is the data collection strategy, which the training and test data captured during a single session—on a single day. This contradicts the notion that the only more reliable test comes from multi-day testing. This maxim holds because performance on single day datasets does little to test how resistant the system is to the variability of human gait over the time. In cases when the CD scenario is considered, the evaluation of most studies is often either done improperly (e.g., mixes the training and test data from multiple days [18, 19]) or the results are very poor [16, 17, 20, 32]. Table 3 demonstrates that the performance of using SD scenario is overly optimistic (i.e., EERs of 0.15% and 3.73% for the Acc and Gyr respectively). While the EERs are increased to 0.93% (for Acc) and 8.29% (for Gyr) under the CD test, this is a more realistic evaluation scenario as it avoids training the user’s model every day.
Although sensor based-authentication systems could be implemented using accelerometers and/or gyroscopes as the source triaxial (three axes) sensor, the results clearly indicate that the gyroscope is not as effective as the accelerometer for authentication, which is consistent with what other researchers have found [4,5,6, 22, 27]. For example, the gait activity reported EERs of 0.15% and 0.93% for the SD and CD scenarios respectively, compared to 3.73% and 8.29% EER’s by using the Gyr data of both scenarios respectively.
Further experiments were conducted and the results presented in Table 4 in order to highlight the impact of selecting the most discriminative features subset for classification. The proposed feature selection approach successfully discarded some irrelevant and/or redundant features and improved the system accuracy. Impressive results were achieved by using the SD scenario for the walking activity (an EER of only 0.13% compared to EERs of 1.4%, 2.9%, and 0.65% [22, 30, 31]). By using a small feature subset of only 20 features, the proposed system can still precisely recognize the users with an EER of 0.78%.
As regards of the game activity, the reported results can be directly compared with the prior art [15, 26, 33, 35] that reported EERs in the range of 4.27%–13.3% (against to 0.89% in this study). Although the EERs of both activities are increased to 0.69% and 4.54% by applying the CD scenario, these results still managed to produce a high level of security and better than the previous accelerometer-based studies that achieved EERs ranging from 5.6% [13] to 29.4% [16].
Table 4 shows that the walking activity contains high levels of distinguished information, hence surpasses the results of the game activity. This most probably due to that more movement data can be obtained when users are walking (compared to a limited motion while playing a game on the touch screen of smartphones). As expected, the results demonstrate that biometric performance is degraded under the more realistic evaluation scenario (i.e., CD scenario), but that smartwatch-based biometrics is still highly recommended and viable to be used at least as a complementary mechanism to password-based authentication.
4.2 The Impact of the Proposed Dynamic Feature Vector
As mentioned earlier, it is clear that the proposed feature selection method was capable of reducing the number of features and has a positive impact on the system performance. With respect to the feature subset size, the reported EERs in Table 4 show that the SD test for both activities, requires less features than the CD (i.e., 60 and 50 features for the walking and game activities respectively). This could be explained because the user’s arm pattern could be vary or be inconsistent over the time, hence more features are required for individual to be identified. Moreover, the selected feature subset was fixed for all users (i.e., the size of the user’s reference template of each activity was same for all users such as 60 features). Therefore, creating a dynamic feature vector size for each user independently might greatly reduce the EER (see Fig. 3). As shown in Fig. 3, reducing the number of features of the NW activity from 70 to 40 features decreased the EER for the majority of users or remains similar (apart from users 10, 16 18, 19, 24, 25, 30, 31, and 48 that negatively affect the overall system accuracy). Surprisingly, the EER was even better for some of the users (e.g., 3, 6, 10, 17, 20, 29, 37, 38, 40, 44, 47, 50, and 51). Therefore, the creation of dynamic feature vector size might offer better accuracy/error rates.

The EER of using the walking activity and utilizing different feature subset size separated by users
4.3 Majority Voting Schema
So far all the presented results were based upon classifying single sample in order to calculate the EER. Although the findings in Table 4 yield good results, it was interesting to find out the possibility of reducing the amount of the rejected samples of a genuine user. Several studies [17,18,19, 22] have investigated the use of majority and quorum voting schemas in order to make a decision. The former is a scheme which accepts a user as genuine if a half or more of the user’s test samples are positive; The biometric decision is then based upon merging multiple classification output to a single one. The latter is a method that authenticates a user as genuine if a requisite number of the user’s samples are positive.
Although quorum voting usually yields greater performance, the majority voting appears to be more resilient to error given the higher threshold for classification. Quorum, while lowering the level of accuracy required to verifying a user, may result in a high false acceptance rate. This failure to identify imposters can be explained by the extremely low proportions of correct classifications required to accepting a user as genuine. Although this may be acceptable for systems more concerned with usability, such permissiveness will most likely render the system impractical for most uses. Majority voting, while requiring the system to be more discriminative, offers a greater level of security and thus is more likely to offer a suitable balance between usability and security. Ultimately, conscious decisions must be made to create a system that does not appear to the end user as too demanding without compromising the security. Therefore, this study utilized the majority voting rather than the quorum voting schema.
As shown in Table 5, the majority voting scheme yields significant improvement on the system performance. At best, the EERs of the walking and game activities were 0.05% and 2.53% respectively (compared to 0.69% and 4.54% of EERs when a single-sample evaluation was used). It is also interesting to notice that only 10 features were required for the game activity to produce the lowest EER. This might be explained because the user’s arm pattern for this particular activity was consistent hence, less features was required to verify the legitimate user.
5 Conclusion and Future Work
This study shows that smartwatch-based activity recognition can produce vastly superior results when evaluated properly by using the realistic CD scenario. It does show that the results do improve when authentication decisions are made using the majority voting schema rather than single 10 seconds sample of data. This paper shows that the proposed feature selection approach has a positive effect on the system accuracy with a reduction of 32% of the whole features. For example, 60 features were used for the walking activity rather than 88 features in order to produce the lowest EER. It is also examined the effect of using the CD scenario on the system performance. Overall, this study serves as an endorsement for smartwatch-based activity recognition.
Future work will explore the impact of the dynamic feature vector size for each user, applying a sensor fusion approach to combine the smartwatch accelerometer and gyroscope data, and testing different segment sizes (e.g., 7 and 5 seconds). Additionally, whilst this study utilized cross-day data collection, collecting real life data (i.e., users do not need to perform certain activities, but merely wear the smartwatch for a prolonged period) will enable a real-world evaluation of the approach. The challenge then becomes being able to identify which activity a user is doing –in order to be able to select the appropriate classifier to utilise. As such, future research will also focus upon developing a context-aware approach to predict the activity.
References
Gafurov, D., Helkala, K., Søndrol, T.: Biometric gait authentication using accelerometer sensor. J. Comput. I(7), 51–59 (2006)
Gafurov, D., Snekkenes, E., Bours, P.: Spoof attacks on gait authentication system. IEEE Trans. Forensics Secur. 2(3), 491–502 (2007)
Nowlan, M.F.: Human Identification via Gait Recognition Using Accelerometer Gyro Forces. CPSC-536-Networked Embedded Systems and Sensor Networks, Professor Savvides, Fall 2009, p. 8 (2009). 2. Related Work and Human Gait
AI-Naffakh, N., Clarke, N., Dowland, P., Li, F.: Activity recognition using wearable computing. In: Proceedings of the 11th International Conference for Internet Technology and Secured Transactions (ICITST-2016), Barcelona, pp. 189–195 (2016)
Al-Naffakh, N., Clarke, N., Haskell-Dowland, P., Li, F.: A comprehensive evaluation of feature selection for gait recognition using smartwatches. Int. J. Inf. Secur. Res. (IJISR) 6(3), 1–10 (2016)
Al-Naffakh, N., Clarke, N., Li, F., Haskell-Dowland, P.: Unobtrusive gait recognition using smartwatches. In: The International Conference of the Biometrics Special Interest Group (BIOSIG), pp. 1–8 (2017)
Hamblen, M.: Mobile phone security no-brainer: use a device passcode (2013). http://www.computerworld.com/article/2497183/mobile-security/mobile-phone-security-no-brainer–use-a-device-passcode.html. Accessed 01 Mar 2018
Kim, I.: Keypad against brute force attacks on smartphones. IET Inf. Secur. 6(2), 71 (2012). http://digital-library.theiet.org/content/journals/10.1049/iet-ifs.2010.0212
Zheng, N., Bai, K., Huang, H., Wang, H.: You are how you touch: user verification on smartphones via tapping behaviour. Technical report, College of William & Mary, Williamsburg, VA, USA, December 2012
Kwapisz, J.R., Weiss, G.M., Moore, S.A.: Activity recognition using cell phone accelerometers. ACM SIGKDD Explor. Newslett. 12(2), 74 (2011)
Kumar, R., Phoha, V.V., Serwadda, A.: Continuous authentication of smartphone users by fusing typing, swiping, and phone movement patterns. In: 2016 IEEE (BTAS-2016) (2016)
Gascon, H., Uellenbeck, S., Wolf, C., Rieck, K.: Continuous authentication on mobile devices by analysis of typing motion behavior. Presented at Proceedings of GI Conference Sicherheit (Sicherheit, Schutz und Verlsslichkeit) (2014)
Kumar, R., Kundu, P.P., Shukla, D., Phoha, V.V.: Continuous User Authentication via Unlabeled Phone Movement Patterns. arXiv preprint arXiv:1708.04399 (2017)
Heng, X., Wang, Z., Wang, J.: Human activity recognition based on transformed accelerometer data from a mobile phone. Int. J. Commun. Syst. 29(13), 1981–1991 (2014)
Okumura, F., Kubota, A., Hatori, Y., Matsuot, K., Hashimotot, M., Koiket, A.: A study on biometric authentication based on arm sweep action with acceleration sensor. In: International Symposium on Intelligent Signal Processing and Communications, ISPACS 2006, Tottori, Japan (2006)
Muaaz, M., Nickel, C.: Influence of different walking speeds and surfaces on accelerometer-based biometric gait recognition. In: 35th International Conference on Telecommunications and Signal Processing (TSP), pp. 508–512 (2012)
Nickel, C., Derawi, M.O., Bours, P., Busch, C.: Scenario test of accelerometer-based biometric gait recognition. In: The Third International Workshop on Security and Communication Networks, IWSCN 2011, pp. 15–21 (2011)
Nickel, C., Busch, C.: Classifying accelerometer data via hidden Markov models to authenticate people by the way they walk. In: 2011 Carnahan Conference on Security Technology, vol. 28, no. 10, pp. 1–6 (2011)
Nickel, C., Wirtl, T., Busch, C.: Authentication of smartphone users based on the way they walk using k-NN algorithm. In: IIH-MSP Conference, Greece, pp. 16–20 (2012)
Muaaz, M., Mayrhofer, R.: Accelerometer based Gait recognition using adapted Gaussian mixture models. In: Proceedings of the 14th International Conference on Advances in Mobile Computing and Multimedia, pp. 288–291 (2016)
Mare, S., Molina-Markham, A., Cornelius, C., Peterson, R., Kotz, D.: ZEBRA: zero-effort bilateral recurring authentication. In: Security and Privacy (SP) (2014)
Johnston, A.H., Weiss, G.M.: Smartwatch-based biometric gait recognition. In: Biometrics Theory, Applications and Systems (BTAS), Arlington, VA, USA (2015)
Yang, J., Li, Y., Xie, M.: MotionAuth: motion-based authentication for wrist worn smart devices. In: The IEEE International Conference on Pervasive Computing and Communication Workshops (PerComWorkshops), pp. 550–555 (2015)
Ramos, F., Moreira, A., Costa, A., Perkusich, A.: Combining smartphone and smartwatch sensor data in activity recognition approaches: an experimental evaluation. In: The 28th International Conference on Software Engineering and Knowledge Engineering, USA, pp. 267–272 (2016)
Davidson, S., Smith, D., Yang, C., Cheah, S.: Smartwatch User Identification as a Means of Authentication, Department of Computer Science and Engineering Std. (2016)
Kamoi, H., Ohtsuki, T.: Biometrie authentication using hand movement information from wrist-worn PPG sensors. In: Proceedings of IEEE 27th Annual International Symposium Personal Indoor Mobile Radio Communications (PIMRC), Valencia, Spain, pp. 1–5 (2016)
Weiss, G.M., Timko, J.L., Gallagher, C.M., Yoneda, K., Schreiber, A.J.: Smartwatch-based activity recognition: a machine learning approach. In: IEEE-EMBS International Conference on Biomedical and Health Informatics (BHI), pp. 426–429 (2016)
Kumar, R., Phoha, V.V., Raina, R.: Authenticating users through their arm movement patterns. arXiv preprint arXiv:1603.02211 (2016)
Babins, S., Manar, M., Nitesh, S.: Walk-Unlock: Zero-Interaction Authentication Protected with Multi-Modal Gait Biometrics. arXiv preprint arXiv:1605.00766 (2016)
Cola, G., Avvenuti, M., Musso, F.: Gait-based authentication using a wrist-worn device. In: Proceedings of the 13th International Conference on Mobile and Ubiquitous Systems: Computing, Networking and Services, Hiroshima, Japan, pp. 208–217 (2016)
Dong, J., Cai, Z.: User authentication using motion sensor data from both wearables and smartphones. In: The Chinese Conference on Biometric Recognition, pp. 756–764 (2016)
Lewis, A., Li, Y., Xie, M.: Real time motion-based authentication for smartwatch. In: The IEEE International Conference on Communications and Network Security (CNS), Philadelphia, PA, USA (2016)
Wang, Z., Shen, C., Chen, Y.: Handwaving authentication: unlocking your smartwatch through handwaving biometrics. In: Zhou, J., et al. (eds.) CCBR 2017. LNCS, vol. 10568, pp. 545–553. Springer, Cham (2017). https://doi.org/10.1007/978-3-319-69923-3_59
Griswold-Steiner, I., Matovu, R., Serwadda, A.: HandwritingWatcher: a mechanism for smartwatch-driven handwriting authentication. In: The IEEE International Joint Conference on Biometrics (IJCB 2017), USA (2017)
Findling, R., Muaaz, M., Hintze, D., Mayrhofer, R.: ShakeUnlock: securely transfer authentication states between mobile devices. IEEE Trans. Mob. Comput. 16(4), 1163–1175 (2017)
Lianga, C.G., Xu, X.Y., Yu, J.D.: User-authentication on wearable devices based on punch gesture biometrics. In: The International Conference on Information Science and Technology, IST 2017 (2017)
Zeng, Y., Pande, A., Zhu, J., Mohapatra, P.: WearIA: wearable device implicit authentication based on activity information. In: The International Conference on a World of Wireless, Mobile and Multimedia Networks (WoWMoM), Macau, China, pp. 1–9 (2017)
Xu, W., Shen, Y., Zhang, Y., Bergmann, N., Hu, W.: Gait-watch: a context-aware authentication system for smart watch based on gait recognition. In: Proceedings of 2nd International Conference Internet Things Design Implement, Pittsburgh, PA, USA, pp. 59–70 (2017)
Author information
Authors and Affiliations
Corresponding authors
Editor information
Editors and Affiliations
Rights and permissions
Copyright information
© 2018 IFIP International Federation for Information Processing
About this paper

Cite this paper
Al-Naffakh, N., Clarke, N., Li, F. (2018). Continuous User Authentication Using Smartwatch Motion Sensor Data. In: Gal-Oz, N., Lewis, P. (eds) Trust Management XII. IFIPTM 2018. IFIP Advances in Information and Communication Technology, vol 528. Springer, Cham. https://doi.org/10.1007/978-3-319-95276-5_2
Download citation
DOI: https://doi.org/10.1007/978-3-319-95276-5_2
Published:
Publisher Name: Springer, Cham
Print ISBN: 978-3-319-95275-8
Online ISBN: 978-3-319-95276-5
eBook Packages: Computer ScienceComputer Science (R0)