
Abstract
Task design forms an important aspect of the shift in a teacher’s practice. In our classroom observations, we have witnessed teachers attempting problem-based tasks with students, when neither teachers nor students have had much prior experience with this type of learning. If students have not had opportunities to develop the necessary process skills to support independent problem solving, such rapid transitions may cause frustration for both students and their teachers.
As an alternative, teachers may choose to shift their practice more gradually. This allows the students to be supported as they begin to develop the capacity for more and more independent and less scaffolded mathematical work. Assessment methods need to shift along with the shift in learning environments.
This chapter provides background as well as sample classroom tasks which may provide a starting point, or middle ground, for such transitions in practice. Designed mainly by new teachers, the tasks include both context and data related to students’ environment. In the first task, students actually collect the data, and in both cases students have some choice in how they present the data. Nevertheless some structure is provided—the tasks are not fully open. We have found such tasks to be effective starting points for the ongoing transition to more autonomous learning.
Access this chapter
Tax calculation will be finalised at checkout
Purchases are for personal use only
Notes
- 1.
See McDougall and Ferguson (Part II this volume, para. 1) for a discussion of two of the possible Ontario pathways (Academic and Applied).
References
Alberta Education. (2008). Mathematics grades 10–12. Retrieved from https://education.alberta.ca/media/564028/math10to12.pdf
Holm, J., & Kajander, A. (2015). Lessons learned about effective professional development: Two contrasting case studies. International Journal of Education in Mathematics, Science and Technology, 3(4), 262–274.
Kajander, A., Zuke, C., & Walton, G. (2008). Teaching unheard voices: Students at risk in mathematics. Canadian Journal of Education, 31(4), 1039–1064.
Ontario Ministry of Education. (2005). The Ontario curriculum grades 9/10: Mathematics (Rev. ed.). Toronto: Queen’s Printer. Retrieved from http://www.edu.gov.on.ca/eng/curriculum/secondary/math910curr.pdf
Western and Northern Canadian Protocol (WNCP). (2008). The common curriculum framework for grades 10–12 mathematics. Edmonton: Alberta Education. Retrieved from https://www.bced.gov.bc.ca/irp/pdfs/mathematics/WNCPmath1012/2008math1012wncp_ccf.pdf.
Author information
Authors and Affiliations
Corresponding author
Editor information
Editors and Affiliations
Appendices
Appendices
Appendix 1: Learning Task
Pop Bottle Water Flow Problem
Your pop bottle was accidentally pierced by a nail when you set your grocery bag down on the ground. Oh no! There goes your pop. You wonder if you will have time to run home and empty the rest of the pop still in the bottle into a new container before it’s all gone.
Your task here is to determine how fast a 2 L bottle will drain.
To simulate this situation, you will be doing an investigation of how quickly water flows from a small hole near the bottom of a 2 L pop bottle. You will work in pairs to perform the experiment.
You will need the following materials:
-
2, 2 L pop bottles per pair
-
Graduated cylinder or measuring cup (one per pair, 100 mL minimum)
-
Masking tape and several multi-coloured sharpies (permanent)
-
Funnel or cone shaped paper cup with the end cut off (one per pair)
-
Large container (one per pair) such as a bucket, and access to water
-
Calculator and stop watch—or cell phones! (one per pair)
-
Utility hook to safely pierce the bottle (one per pair) (Fig. 1)
Fig. 1 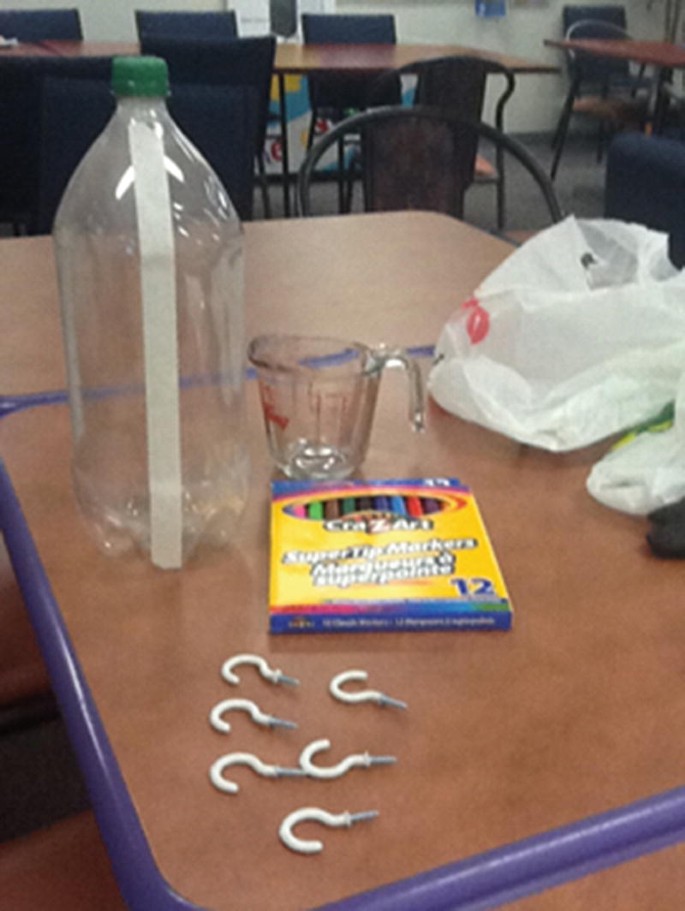
Materials

Procedure
-
(A)
Label the volume for every 100 mL of liquid in the pop bottle. The steps below provide one possible way to do this.
-
1.
Start with taking a strip of masking tape that extends the entire length of the 2 L pop bottle
-
2.
Using the graduated cylinder, measure 100 mL of water
-
3.
Pour the water into the pop bottle, then mark the water level on the masking tape
-
4.
Label the 100 mL on the tape
-
5.
Repeat steps 2–4 for each new 100 ml until you reach 2000 mL
-
6.
Pour the water in the other (unmarked) pop bottle using your funnel
-
7.
Make a hole on the (labelled) bottle using the utility hook. Your hole should be around the 100 mL mark
-
8.
Cover your hole with a piece of masking tape
-
9.
Pour the water back into the (labelled) bottle with the covered hole, making sure the water level is at the 2000 mL mark (Fig. 2)
Fig. 2 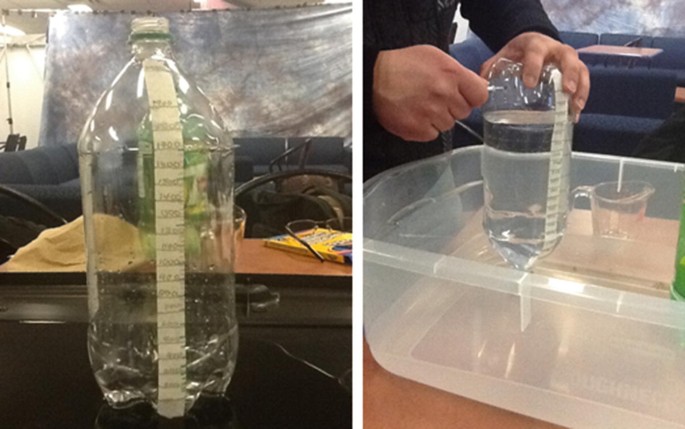
Measuring the water volume
-
1.
-
(B)
Next you will measure the flow of the water. Here is one possible way to do this:
-
1.
When ready to begin, pull the masking tape from the hole, allowing the water to drain into the bucket or a sink, (this experiment could also be done outside) and begin the timing
-
2.
After 20 s one of the team members will signal the end of that time interval, and the other member will mark the water height on the masking tape
-
3.
Continue until the water level reaches the level of the drain hole and thus the draining stops
-
1.

Observations and Predictions
Describe in words what you observed. For example, did the water appear to flow out at the same rate? When was it the strongest? How does this make sense?
Create a table showing the volume left in the bottle at each 20 s time interval.
Data Analysis
Graph your data. (Discuss in your group which variable to use for which axis of the graph and why). Hand sketch a curve of best fit to the data points.
Use the graph you created, make as many observations about the situation as possible. Here are a few questions you might consider (among others):
-
What is the initial point you graphed? What does this represent?
-
Is the graph a straight line or a curve? How does this make sense in the context?
-
Is the rate of flow the same or different early on in the timing compared to later? Does this agree with your observation of the water flow? How does this relate to the shape of the graph? Why might this be the case?
-
What happens when the volume remaining above the hole is very small? What is the slope of the graph as it nears this point? Why does this make sense?
-
The slope of the graph represents how fast the resultant or ‘dependent’ (y-value) variable is changing. Discuss how the slope of your graph relates to the current context and how this makes sense.
-
Use technology to find the equation of your graph. If you now graphed this new function (the one provided by the technology) would you get your exact graph? Why or why not? Does the graph of the function provided by the calculator extend beyond the graph you have? If so, what might you do to be sure the function models your graph properly? (hint: think domain and range, i.e. the regions on the graph to which the experiment applies)
-
What point makes sense as the ‘minimum’ value of the graph?
-
Use technology to identify the approximate vertex of the graph. How does the vertex relate to the minimum value?
-
Use technology to change the format of the function to ‘vertex form.’ Explore the values given in this provided function: why might this form be called ‘vertex form’? What does this algebraic form provide?
-
Calculate the y-intercept using the function. How does this agree with the context of the pop bottle? Is the value what you might expect, and why or why not?
-
The axis of symmetry of this type of graph is the vertical line through the vertex. Where would that be on your graph?
And the conclusion:
-
How long would you have to find another container if you wanted to be sure you had at least half of your pop left after the leak started?
Your Conclusions
Write a paragraph describing the overall results of the experiment and what you learned about modelling real world phenomena. What does the data and the mathematical model you found tell you about the rate at which the water flows from the bottle? What other contexts might have similar types of mathematical models?
Challenge Extension
If time is available, explore algebraic techniques for moving back and forth between standard form (the form likely provided by the technology) and vertex form (Fig. 3).

Sample solution graph
Appendix 2: Assessment Task
Rope Bridge Problem
Your little brother Ray has just started high school and is a bit shy. Ray would like to ask a classmate out who really wants to go to a new park, with a picturesque canyon. The canyon has a suspended rope bridge across it. The only problem is, Ray is a bit afraid of heights and after being on a rope bridge previously on a family vacation, he felt dizzy after 1 min. Ray has gone out to the park and was able to read the first three signs on the bridge, showing the horizontal distance across the gorge and the height of the bridge at that point. He couldn’t see any farther without going across. Can you help Ray figure out the horizontal distance across the gorge, using your mathematics skills? Is it likely that he and his friend will make it across the bridge within 1 min at a leisurely walk before Ray feels faint? Will there be any time to stop on the bridge?
Here are the first three signs Ray is able to see, with the values showing horizontal distance, and height from the bottom of the gorge, respectively (Fig. 4).

Diagram of the gorge
Analyse this situation in as much detail as you can, using your knowledge of quadratic relations, since the bridge floor (the curve on which the height and width are noted) seems to be a fairly flat parabola. Note that the signs refer to the height of the floor of the bridge from the baseline as marked. Use technology as appropriate. Since you have decided to show your hard work to your math teacher, be sure to include as much mathematical detail, such as a chart, graph, equation of the bridge floor, and all of your mathematical reasoning, as possible. You may need to make some assumptions or simplifications along the way—be sure to state these. Also, find out for Ray what the lowest point of the bridge is before it starts to slope upwards again.
Make a scale model of the bridge using string, push pins, cardboard and markers. Label all relevant information.
What will you advise Ray?
Partial Solution
A quadratic regression calculator should give a = 10; b = −0.1683333…; and c = 0.0072222…. These can be simplified to fractions (Table 1).
Rights and permissions
Copyright information
© 2018 Springer International Publishing AG, part of Springer Nature
About this chapter

Cite this chapter
Atiya, I.A., Luca, N., Kajander, A. (2018). Bottles and Bridges: Sample Classroom Tasks Created by Beginning Teachers. In: Kajander, A., Holm, J., Chernoff, E. (eds) Teaching and Learning Secondary School Mathematics. Advances in Mathematics Education. Springer, Cham. https://doi.org/10.1007/978-3-319-92390-1_32
Download citation
DOI: https://doi.org/10.1007/978-3-319-92390-1_32
Published:
Publisher Name: Springer, Cham
Print ISBN: 978-3-319-92389-5
Online ISBN: 978-3-319-92390-1
eBook Packages: EducationEducation (R0)