
Abstract
In Chinese UGC background, the “Cloud Pet Keeping” phenomenon that social media users keep eyes on certain pets’ growth by viewing the photos and texts released by pet bloggers is rising. Users obtain emotional resonance through browsing pet photos shared and are happy to contribute the consuming behavior. However, there are still large amount of people can’t find their favorite pets through searching. The emotional tags’ lack can be a possible reason, which causes the bad user experience. This research tried to purpose an approach based on “cloud pet keeping” phenomenon by using neural networks to develop the image emotional tag generation mechanism. In this experiment, cats’ photos are taken as the example to construct the model. This mechanism is used to predict the emotional categories of images. When users uploading the images, the mechanism will automatically generate emotional tags based on its prediction. This is a positive way to solve the problem in the lack of image emotional tags. It is foreseeable that the theory can be applied to other fields, such as industrial product and so on.
You have full access to this open access chapter, Download conference paper PDF
Keywords
1 Background
The advent of Web 2.0 technologies has enabled the creation and distribution of user-generated content (UGC), bringing a lot of new phenomenon in social medias. “Cloud Pet Keeping” is a phenomenon rising in Chinese UGC background that social media users keep eyes on certain pets’ growth by viewing the photos and texts released by pet bloggers. With the accelerated pace of modern living and limited conditions, more and more urbanites in china choose to browse amusing pet photos shared by bloggers and are willing to praise, forward these information, and contribute the consuming behavior for these contents to get emotional resonance. Emotion is an essential part of attitude. Research shows that there is established relationship between attitude and behavior and indicate attitude serves as a mediating factor between the use and creation of UGC. [1] While, a great deal of users complain about can’t find optimal content, resulting in difficulties in finding pets’ information that is in line with their preference. The main possible reason is the difference between emotional expression tags input by users and bloggers. This indicates the lack of appropriate emotional tags. While, it is not practical to label the pictures by manual work. Therefore, to find a way to generate the accurate emotional image tag is quite necessary for improving the user experience. Most research methods of emotional experience based on images are feature analysis [2], user knowledge architecture [3, 6], and quantitative study [4, 5]. These methods focused more on how to describe the user’s emotional experience preference. There is less research on study how to propose a method to generate emotional tags to improve the user experience.
With the rapid development of image acquisition equipment, the cost of obtaining image data is getting lower and lower. And with the continuous expansion of data scale and computing power brought by the development of information and communication technology, it is becoming more and more common for people to process data and explore based on these data resources. Faced with the large amount of image data currently available in social networks, this paper tries to put forward a set of mechanisms using neural network to help improve the lack of emotional tags in actual use based on the “Cloud Pet Keeping” phenomenon.
The rest of the paper is organized as follows. The concepts and methods needing explanation are sorted out in Sect. 2. Section 3 presented the mechanism how to generate emotional tags for photos. In order to verify the maneuverability of the mechanism, experiments with cats’ photos have been done is in Sect. 4. Section 5 is the summary and Sect. 6 is the conclusion.
2 Concepts and Methods
2.1 Concepts
Image.
The image in this article means photos that is taken by a camera, a mobile phone and other devices.
Digital Image.
If the scene in real world wants to be processed, identified, and stored by the computer, the image must be transformed into a format that can be recognized by the computer. In the computer, image is stored in the digital form. Therefore, the image is also called the digital image.
The digital expression of image is divided into four steps:
-
Scanning: divided the image into M x N grids and each of grid is called a sampling point.
-
Color separation: the color of the sampling point of the colorful image is decomposed into three basic colors (RGB)
-
Sampling: measuring the brightness of each component of each sampling point
-
Quantization: the analog quantity is represented by the digital quantity to realize the A/D conversion of the luminance value.
Image Tag.
Tags are the keywords added by users to describe the image contents. [8] In particular, tags are not only the labels, but also can be the keywords in the topics, texts, stickers, comments and so on. Tags, as the image features, are necessary for people to retrieve key information.
2.2 Methods
Emotional Tags Cluster Analysis.
Cluster analysis is a common tool for data analysis. Correlation Score. Professionals grade the correlation between any two of these tags. They score on a 9-point scale ranging from ‘significant negative correlation’ to ‘significant positive correlation’. Smaller the value is, higher the similarity. (see Fig. 1.) This method calculates the Euclidean distance (1) between these emotional tags in a multidimensional space and classifies them following the closest distance principle.

Semantic correlation matrix of emotional tags
Smaller the distance, higher similarity between the two tags. At the beginning, each tag is regarded as a cluster. Combine two nearest clusters at a time. Until finally only one cluster is left (see Fig. 2).

Hierarchical clustering
Emotional Tags Multidimensional Scaling Analysis.
Multidimensional scaling analysis reduces tag classes in multi-dimensional space to the low-dimensional space to locate, analyze and classify.
By combining these two analysis results, researchers conclude and extract emotional expression Vocabularies in a more scientific way.
Grayscale Images
In photography, computing, and colorimetry, a grayscale or grayscale image is one in which the value of each pixel is a single sample representing only an amount of light, that is, it carries only intensity information. [9]
The image can be converted to the grayscale one by the following methods:
Mean Value Method.
The formula is simple, so it is easy to maintain and optimize. However, from the perspective of human eyes, the gray shadow and brightness of the picture are not good enough.
Psychology Method.
For images in color spaces such as Y’UV and its relatives, which are used in standard color TV and video systems such as PAL, SECAM, and NTSC, a nonlinear luma component (Y’) is calculated directly from gamma-compressed primary intensities as a weighted sum, which, although not a perfect representation of the colorimetric luminance, can be calculated more quickly without the gamma expansion and compression used in photometric/colorimetric calculations. [10]
One Channel Method.
It is a quicker way to make gray images, without doing any calculation, and taking the value of a channel directly as a gray value. It is difficult to predict the result of this transformation, so this algorithm is mostly used for artistic effects.
In practical applications, considering that human eyes have different degrees perception to different colors’ light, researchers also want to avoid low speed floating-point operations, therefore, grayscale photos in this experiment are processed with python to converse from “RGB” mode to “L” mode according to the formula:
Artificial Neural Network
Deep learning discovers intricate structure in large data sets by using the backpropagation algorithm to indicate how a machine should change its internal parameters that are used to compute the representation in each layer from the representation in the previous layer [7]. Among the deep learning field, artificial neural (ANN) networks are the main choice in many data classification tasks [8]. Another commonly used classification method is k-NearestNeighbor (KNN), which is classified according to the distance of the pixel. But it is very slow in the test stage of the model, and the distance measurement information on the image is not quite large enough, so this method is not used this time.
The artificial neural network is also referred to as the connection model. The traditional expert system is the idea of a series of “if” rules of the statement, classification of things go from the top down, and the neural network is the transmission, let the machine to explore the classification rules. As the computing power of the computer is rapidly enhanced, the neural network can be better implemented.
The steps of neural network based on classification are as follows:
-
collect data and matches the data with the corresponding classified labels
-
use neural network to train a classifier
-
use the trained classifier to predict the class of new pictures.
Classifier - Architecture of Artificial Neural Networks
For classification problems, the input layer is used to accept data, the hidden layer seeks the characteristics of the data, and the output layer is used to predict the category. There are multiple inputs on each node. These inputs are assigned random weights at the initial time, and then decide whether the nodes will continue to transmit information back and forth by mathematical functions. The system error is obtained by the forward propagation of the input to the output, and then the weight is adjusted by the output to the input back propagation, and the error is reduced. The neural network continuously trains the weights between different levels through a large number of data cases. Finally, the accuracy of the machine prediction is tested by the data in the test set. If the performance is over 0.80, the neural network can be considered successful.
-
Input layer— The leftmost layer is called input layer. It contains nodes that receive input information from the given on which network will learn or do other process.
-
Output layer —The rightmost layer is called output layer. It contains nodes that respond to the information about how it’s learned any task.
-
Hidden layer —The middle layer of nodes is called the hidden layer. These nodes’ values are not observed (see Fig. 3).
Fig. 3. 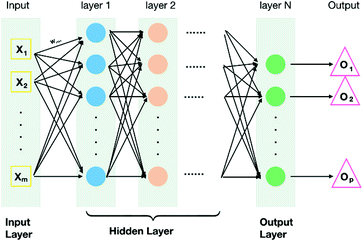
Structure diagram of neural network

The Use of the Neural Network.
A successful neural network can be used as a classifier. When having a new image, it can be read, and the machine can automatically predict the emotional tag of the image.
3 Image Emotional Tags Generation Mechanism
The whole image emotional tags generation mechanism has three parts: (see Fig. 4).

Image emotional Tags generation mechanism
3.1 Method for Filtering Typical Images
Emotion means the subjective feelings or experiences of the individual [11]. There must be difference existed when people see the same picture. Emotional experience is about the individual subjective experience of emotions [12]. Different emotional experience will influence people’s emotional expression. In order to ensure the accuracy of pictures’ emotional category labels, we use the method (see Fig. 5) to screen and extract image categories to get the most the approximate emotional expression vocabularies and typical photos.

Method for filtering experimental photos
The method for filtering experimental photos involves three parts.
Collection and Analysis.
Collect vocabularies and photos which is about the object of the phenomenon from bloggers and users as many as possible from social medias. Then professional researchers brainstormed, analyzed, summarized and correlated all the emotional expression vocabularies, and extracted representative vocabularies according to the correlation score matrix through the multi-dimensional scale and cluster analysis by SPSS.
Filtering.
Researchers filter representative photos from social networks according to these presentative vocabularies as stimulus.
Matching Experiments.
By calculating Euclidean distance and statistical methods with data from multi matching experiments of emotional expression vocabularies and stimulus, vocabularies that having high consistency between users and bloggers and most typical photos of each emotional category are obtained.
Through such a process, after the researchers and users filtering twice, the typical photos and typical vocabularies are reliable to be used in the following part. According to this method, we finally get the typical vocabularies set W and the typical photos set P.
3.2 Artificial Neural Network
The second part of the Mechanism is using the artificial neural network to train a classifier.
Data Collection.
The typical vocabularies and typical photos obtained from the last step is the key data for the neural network. The typical photos are used as the labelled data for neural network to learn and test. The number of the typical vocabularies N decides the number of nodes in hidden layers.
Standardize Images.
As the size of collected images is quite different, it is necessary to standardize them. Different shapes of objects, environment occlusion, background and so on will affect machine recognition. Therefore, we should control the single characteristics of objects in image to learn and classify.
Data Augmentation.
Data plays the most important role in training the model. The more data an neural network algorithm has access to, the more effective it can be. Even if the data is of low quality, algorithms can still perform better, as long as useful information can be extracted by the model from the original data set [13]. Data augmentation, which no matter is guided by expert knowledge [14], or generic [13], and has shown effective in image classification [14].
In this experiment, several methods are applied as follows:
Scaling:
Different scaled object in the image is an important part of image diversity. For real users, the object in their photos can be large or tiny.
Rotating:
According to different requirements, it is necessary to rotate the photos at diverse angles. Users prefer to try different angles while taking photos of the object they love. However, this method probably adds background noise when the background color can’t blend with the image (black or white). The network may consider that as a feature to learn.
Adding Salt-and-Pepper Noise:
Salt-and-pepper noise is sparsely addition of white and black pixels in the image. For real users, most of them are not professional photographer. There is high possibility existing that photos taken by them are fuzzy with a large amount of white and black dots.
Changing Lighting Condition:
Photos with different lighting condition will help the network to learn properly the object and also the diverse scenario of the images.
Translation:
Translation means to shift the object to various parts of the image. This method also may bring background noise. This method can make the network learn the invariant features.
3.3 Tags Generating
The value of output nodes shows the possibility of each emotional class. They can be ranked from height to low. Tags of high possibilities can be used to add to the photo. There are two ways to use the prediction results as follows:
Provided to the User.
After ranking the value of predictions to each class, tags of high possibilities can be shown for the user to choose. This is a good way to improve the accuracy of prediction with more and more data are collected.
Added by Backstage Automatically.
When the user uploads a image, the backstage automatically predicts the category of emotional labels that match the image. Also, each emotional category contains many emotional vocabularies with high correlation. Backstage can add these tags all, this will greatly improve the efficiency of the user’s search.
4 Experiment
4.1 Experimental Images and Categories Preparation
For cats are the most popular pet in china social media, cats’ photos are chosen from social networks as experimental material.
Collection and Analysis.
More than 700 photos are collected from Weibo and Lofter, the most famous social platforms. 92 supplementary emotional expression vocabularies are collected form several different sources. Through experts’ analysis, brainstorming, summarize, the final number of vocabularies to be analyzed is 46. Three professionals are invited to grade the correlation between any two of these 46 vocabularies. Three professionals are invited to grade the correlation between any two of vocabularies. Finally, 14 vocabularies are extracted from 46 vocabularies as indicators for later experiment. The vocabularies are Happy, Naughty, Adorable, Disgusted, Serious, Tsundere, Calm, Focused, Lazy, Curious, Shocked, Angry, Dazed, Sad.
Filtering.
Based on the 14 emotion cognition vocabularies. 70 stimuli photos are obtained.
Matching Experiments.
Ranking the value the consistency between bloggers and users’ choosing, vocabularies that having a high level of consistent with bloggers emotional cognition: Angry, Curious, Naughty, Lazy, Sad, Shocked, Happy, Serious.
The typical photos of each category are obtained (see Fig. 6).

Typical photos of each category
4.2 Processing of Experimental Photos
Data Collection.
According to the results of the mechanism for filtering experimental images, 8 adjectives with relatively small deviation are obtained. These typical vocabularies are as follows:
Angry, Curious, Naughty, Lazy, Sad, Shocked, Happy, Serious.
From analyzing the typical photos’ features, researchers filtering similar photos. Take shock as an example, the features of typical photos are: the cat’s eyes are round and the mouth is triangular (see Fig. 7). Through these typical features, researchers screened other images that represent the shocking emotional expression.

Similar photos picked by researchers according to typical photos
4.3 Processing of Experimental Photos
Standardize Images.
In order to eliminate the influence of the ornaments on the cat’s body, this experiment cut the cat’s head in each picture as the final experimental material. And the cats’ photos in Naughty category are mainly featured with the body movement and gesture. Therefore, in final experiment, 7 emotional expression tags as 7categories are retained, they are Angry, Curious, Lazy, Sad, Shocked, Happy, Serious.
Because colors of the picture have no obvious influence on the users’ emotional cognition of the picture, so this research used grayscale images for the experiment.
Photos collected were processed into grayscale, and resized to 127pixel * 127 pixel. A 127 * 127 size matrix that can describe the whole image with the gray value of each pixel in the image. By transforming the matrix, a matrix of size 16129*1, (16129 = 127 * 127) is finally obtained. For now, the image is represented by the array (see Fig. 8).

Processing of experimental images
Data Augmentation.
Through the various methods mentioned above, each typical image was rotated, zoomed, added salt-and-pepper noise, translated, changed different level lighting conditions and so on (see Fig. 9).

Example photos of data augmentation

Structure diagram of this experiments’ neural network
Train.
The size of the matrix of the image pixel decides the number of nodes in input layers.
In this experiment, the input layer has 127*127 = 16129 nodes, X1, X2…is the grayscale value of each pixel. The output layer has 7 nodes, corresponding to 7 typical emotion expression vocabularies. Examples for each emotional expression vocabulary, and explanation of how we represent the labels (see Fig. 11).

Examples for each emotional expression vocabulary, and explanation of how we represent the labels
-
Training Set: 4802 pictures (127 by 127 pixels) of emotional tags
-
Test Set: 964 pictures (127 by 127 pixels) of emotional tags.
The value of each nodes in output layer is the neural network’s prediction. Therefore, the vocabulary corresponding to the largest value between O1, O2…. is the predictive result of the neural network (see Fig. 10).
The final performance is 0.87, which is basically satisfactory. The result shows the program can effectively predict the emotional class of the photo of cat’s head. When the user uploads a image, the backstage automatically predicts the category of emotional labels that match the image. Also, tags of high possibilities can be generated for the user to choose. With more and more data are collected, the accuracy of prediction will improve a lot.
5 Summary of Research Methods
Based on the “Cloud Pet Keeping” phenomenon, which is the new phenomenon rising in Chinese UGC background,as the example, this article tries to explore a mechanism to provide emotional tags for photos to help users to retrieve more accurate information.
Future Direction
The possible future direction of improvement in experiment are summarized as follows:
-
Use colorful images. The color contains lots of information, which will have a certain influence on people’s mind when observing the image, thus affecting the emotional expression.
-
Use the whole body image of the target. Body language and gesture may lead to a different interpretation of the object’s emotions.
Consider the Special Effects of the Image.
There are more and more people that are accustomed to use various filters to process images before uploading them. The indicates that people have a variety of emotional expression needs. Learning to understand the emotional expression of these filters can also help to know users’ emotional experience.
More information can be obtained by incorporating more factors. While, this also means a much larger scale of computation and more complex rules settings.
6 Conclusion
This paper explores a mechanism to solve the lack of emotional tags of the photos, which causing bad user experience in today’s social medias. This study based on the “Cloud Pet Keeping” phenomenon, use neural network to build a classifier to generate emotional tags for images.
According to experiment’s result, the generation mechanism can positively solve the tag-lacking problem at certain extent. This mechanism can be applied to other fields such as product design, information design and so on.
Due to the limitation of time, human and materials and there must be differences existed in culture and emotional expression of each country, this study is just an exploratory experiment. Researchers can consider perfecting the mechanism by expanding the data amount, enriching the data types and so on to make the mechanism to adapt to a broader situation.
References
Daugherty, T., Eastin, M.S., Bright, L.: Exploring consumer motivations for creating user-generated content. J. Interact. Advert. 8(2), 16–25 (2008)
Liang, N., Zhong, J., Wang, D., Zhang, L.: The Exploration of user knowledge architecture based on mining user generated contents – an application case of photo-sharing website. In: Marcus, A. (ed.) DUXU 2016. LNCS, vol. 9748, pp. 180–192. Springer, Cham (2016). https://doi.org/10.1007/978-3-319-40406-6_17
Wang, D., Liang, N., Zhong, J., Zhang, L.: Mining and construction of user experience content: an approach of feature analysis based on image. In: Marcus, A. (ed.) DUXU 2016. LNCS, vol. 9748, pp. 223–234. Springer, Cham (2016). https://doi.org/10.1007/978-3-319-40406-6_21
Xie, M., Zhang, L., Liang, T.: A Quantitative study of emotional experience of Daqi based on cognitive integration. In: Marcus, A., Wang, W. (eds.) DUXU 2017. LNCS, vol. 10288, pp. 306–323. Springer, Cham (2017). https://doi.org/10.1007/978-3-319-58634-2_24
Liang, T., Zhang, L., Xie, M.: Research on image emotional semantic retrieval mechanism based on cognitive quantification model. In: Marcus, A., Wang, W. (eds.) DUXU 2017. LNCS, vol. 10290, pp. 115–128. Springer, Cham (2017). https://doi.org/10.1007/978-3-319-58640-3_10
Zhong, J., Wang, D., Liang, N., Zhang, L.: Research on user experience driven product architecture of smart device. In: Marcus, A. (ed.) DUXU 2016. LNCS, vol. 9748, pp. 425–434. Springer, Cham (2016). https://doi.org/10.1007/978-3-319-40406-6_41
LeCun, Y., Bengio, Y., Hinton, G.: Deep learning. Nature 521(7553), 436 (2015)
Johnson, S.: Stephen Johnson on Digital Photography. O’Reilly, Sebastopol (2006). ISBN 0-596-52370-X
邓铸, 朱晓红. 心理统计学与SPSS应用[M]. 华东师范大学出版社 (2009)
Poynton, C.: The Magnitude of Nonconstant Luminance Errors in Charles Poynton, A Technical Introduction to Digital Video. WIley, New York (1996)
Fox, E.: Emotion Science Cognitive and Neuroscientific Approaches to Understanding Human Emotions. Palgrave Macmillan, Basingstoke (2008)
Carstensen, L.L., Pasupathi, M., Mayr, U., Nesselroade, J.R.: Emotional experience in everyday life across the adult life span. J. Personal. Soc. Psychol. 79, 644 (2000)
Perez, L., Wang, J.: The effectiveness of data augmentation in image classification using deep learning (2017)
Vasconcelos, C.N., Vasconcelos, B.N.: Increasing deep learning melanoma classification by classical and expert knowledge based image transforms. CoRR, abs/1702.07025 (2017)
Marchesi, M.: Megapixel size image creation using generative adversarial networks. ArXiv e-prints, May 2017
Xu, Y., Jia, R., Mou, L., Li, G., Chen, Y., Lu, Y., Jin, Z.: Improved relation classification by deep recurrent neural networks with data augmentation. CoRR, abs/1601.03651 (2016)
Author information
Authors and Affiliations
Corresponding author
Editor information
Editors and Affiliations
Rights and permissions
Copyright information
© 2018 Springer International Publishing AG, part of Springer Nature
About this paper

Cite this paper
Tang, C., Zhong, K., Zhang, L. (2018). Research on Image Emotional Tag Generation Mechanism Based on the “Cloud Pet Keeping” Phenomenon. In: Marcus, A., Wang, W. (eds) Design, User Experience, and Usability: Users, Contexts and Case Studies. DUXU 2018. Lecture Notes in Computer Science(), vol 10920. Springer, Cham. https://doi.org/10.1007/978-3-319-91806-8_7
Download citation
DOI: https://doi.org/10.1007/978-3-319-91806-8_7
Published:
Publisher Name: Springer, Cham
Print ISBN: 978-3-319-91805-1
Online ISBN: 978-3-319-91806-8
eBook Packages: Computer ScienceComputer Science (R0)