
Abstract
There have been many studies of cognitive and affective benefits from incorporating the animation in user interfaces, thus, only a few have investigated that how animation in user interface affects children’s cognition while they interact with interfaces in their different growing stage. In this paper, we want to figure out if the animation in user interface can benefit the cognition, interaction, and emotion of children at different age range. A study was carried out by comparing a series user interface demos with and without animation based on typical tasks in the Kids VOD APP among two groups of children ages 4–6 years and 7–12 years. The result of this study shows that the two groups of children have differences on the task completion rate, task completion efficiency, and emotion preference. This suggest that applying animation to user interface for children needs consideration of children’s age and animation usage scenarios.
You have full access to this open access chapter, Download conference paper PDF
1 Introduction
Nowadays, animation is broadly used in user interface to increase adaptation and understanding of users. It can draw user attention, explain visual changes and put a sense of positive emotion in the user experience [2]. Although there is a growing body of research on animated user interface, less is known about the impact of animated user interface on children. It’s still not clear that how animation contributes to children’s cognition and performance when they interact with user interface. There are also some limitation in the research on animated user interface. Firstly, author mainly test users from effect of task completion related to adopting animation, but emotional preference in different usage scenario is not fully considered. Secondly, the main purpose of the 12 basic principles of Disney is to produce an illusion of characters adhering to the basic laws of physics and also deal with more abstract issues, such as emotional timing and character appeal [3]. However, it was not created for improving user interfaces at the beginning [4]. There are several new animation design principles which adapt especially for user interface design, such as iOS User Interface Design Guideline [5], Google material design guideline [6], and UMP guideline [7]. Novick [8] discussed how some types of animation can be used for different purpose by connecting types of animation with different communicative functions, which could help to figure out how certain types of animation can be used for different purpose [2]. Last but not least, how usage scenario effects children’s cognition to animation should be considered, evaluation should be employed in the specific user task and then we can evaluate the animation in the usage scenario.
This paper aims to investigate the relationships between animation and children’s cognition, so as to give suggestions to the design of user interface for children. In this study, we chose the Kid VODFootnote 1, a video on demand application for children in China, because of the increasing demands of children in online video viewing. According to the studies of cognitive development of children, we carried out the usability and interview with two groups of children, ages between 4–6 years and 7–12 years. 3 groups of demos with and without animation were made based on the Kids VOD. The animation we used in the demos were a combination of the most frequently-used types which were based on the types of animation constructed by Novick [8]. We evaluated children’s cognition from 5 aspects with the tasks: the completion rate, the efficiency, the memory of content, the understanding of application structure, and emotional preference.
From our study, we concluded that animation has different effects on comprehension and interaction of children among these two age ranges. When children interact with user interface, animation has a positive effect on comprehension, memory, task completion rates and efficiency, preference among children of 7–12 years old, whereas, no significant effect on task completion rates, comprehension and preference among children aged 4–6. Our findings suggested that the use of animation needs to be carefully considered according to the characteristics of the crowd and the usage scenario.
2 Literature Review
When we discuss the topic about the relationship of animated interface and children cognition in the Kids VOD, four parts of literature should be studied: the development of children’s cognition in their growth process, the present studies of user interface for children, the present studies of animation in user interface, and the background of VOD service for children.
2.1 The Development of Children’s Cognition in Their Growth Process
From the study of cognitive development of children, children obtain different ability of cognition in their different ages, which might lead to different understanding and preference to animation in user interface. In order to perform successful user study, it is better to know much of children’s cognitive abilities [9]. According to Piaget’s study, the childhood cognitive development could be divided into four stages: Sensorimotor Stage (Birth through about 2 years), Preoperational Stage (2 to 7 years), Concrete Operational Stage (7 to 11 years), and Formal Operational Stage (11 years and older) [10]. Meanwhile, Nielsen [11], a user experience specialist, claimed researchers should make distinction between young (3 to 5 years), mid-range (6 to 8 years), and older (9 to 12 years) children. In another study, children could be sorted into three age ranges: preschool-aged children (2 to 5 years), elementary-school-aged children (6–10), and middle-school-aged children (11 to 14 years) [12]. Since children’s growing stage is an important factor which would influences the ability of cognition and comprehension of children, participants should be grouped as their age range.
According to theories of human cognitive development, children of group ages 7 to 12 are in stage where they learn to reason logically and have difficulties with thinking abstractly. Children as young as 7–8 were able to distinguish between concepts such as usability, fun, and potential for learning [13]. Erickson’s theory of psychosocial development claimed that children require emotional support and a feeling of success [14]. According Erickson’s theory, whether animation used in user interface can influence children’s emotion preference should be investigated.
2.2 The Present Studies of User Interface for Children
Children’s cognition differences also reflected on their preference for user interfaces. Taslim [15] found that there were significant differences in children’s preferences for interface type and background color. It reported a preliminary analysis of gestures elicited from children ages 5 to 10. They found that there were clear differences in the way older and younger children make gestures, even between the ages of 5 to 10 years. But his research didn’t involve preference of animation.
There are also some related researches investigate relationship between children’s cognition and user interface. Lorna and Read [16] did a research of designing meaningful icon based on children’s understanding for a music application. They explore proper iconic representations for a “record music” function on a mobile device which could be used for reference in VOD interface design of children. It’s a general problem to understand the meaning of icon for children in user interface. Their study was carried out with children aged 8 to 10, and they found that graphical user interface could contribute to the users with reading or language problems such as preschoolers. They suggested that the design of icons should be attractive, clear to children. Since users will vary greatly in their abilities and their understanding of functions (especially for children). One of important suggestion is that animations may help to convey the function represented by unfamiliar icons. Azzopardi et al. [17] investigated relationship between VOD service and the everyday patterns and lives of children. They found that children preferred to browse through content rather than natural language. From the studies of how children use user interface, we can conclude that the differences of preference to user interface between children and adults should be fully considered in interface design for children.
2.3 The Present Studies of Animation in User Interface
From the study of current research on animation in user interface, less is known about the study for children, and also, the usability evaluation. A research about the effects of animation on usability and appeal of educational software user interface was conducted by Dyer and Villani [18], which compared 3 interfaces: a static interface, an interface with highlighting/sound feedback, and an interface that incorporated five Disney animation principles. The result of the study did not show significant effects of animation on user task performance, which was measured by activity completion times and number of errors while performing the activities. However, task completion times using the animated interface were consistently lower than that using the static interfaces. Therefore, interface with the animated interface rated more likeable than the other two, because of the smooth transitions between different states, this might suggest that applying animation to user interface can only benefit user’s emotion in their interaction with user interface. However, the main purpose of the 12 basic principles of Disney is to produce an illusion of characters adhering to the basic laws of physics and also deal with more abstract issues, such as emotional timing and character appeal [3]. It was not created for improving user interfaces at the beginning. Since there are significant differences between cartoons and interfaces [4], the test materials should follow the design guideline especially for user interface, and should be evaluated in real usage scenarios.
In the past years, iOS, Android have published their design guidelines, and all of these guidelines emphasized the importance of animation in user interface. The Human Interface Guidelines published by iOS platform indicate that animation builds a visual sense of connection between people and content on screen [5], while the Material Design Guidelines published by Android platform consider animation as a more functional elements which can convey status, provide feedback, enhance the sense of direct manipulation, and help users visualize the results of their actions [6]. Novick [8] has constructed an model of animation connecting types of animation with different communicative functions, this model indicates how some types of animation can be used for different purpose in user interface, which means it is constructed with the consideration of the usage scenario of animation.
2.4 The Background of VOD Service for Children
In the recent years, video on demand (VOD) service becomes one of the most popular service around the world. People enjoy all kind of video content across different platform that provide massive online video service such as PC, Pad, Phone, TV. Not only can adults use these service, but also children. Children watch a great deal of online videos, and the amount of time that they spend on watching video continues to increase [20]. Mobile media companies, including the telecom industry and hardware manufacturers, have never considered infants as a part of their target users historically. It is only with the popularity of mobile phone and the emergency of touch screen interfaces that infants can access to mobile technology [21]. Touch screen tablets, for example, are increasingly used in the home as a source of literacy skills as a result of the simplistic tactile operation. This study also claimed that smartphones and the Internet are the most frequently used tools to watch videos by children under the age of 4 years [22].
In China, according to the Research about the Use of Internet of Chinese Teenager and Children in May of 2015 from iResearchFootnote 2 [23], over 50 percent of children have access to the Internet in preschool, which indicated the tendency that children might access to the Internet in a lower age. The main devices for children accessing the Internet in China are mobile phones, more than 70% of children use them at any age. Watching video and playing games are the primary online needs for children, followed by learning and doing homework. Comparing the requirements of children in different ages, we can concluded that watching videos and playing games are the common demands of children aged from 3 to 8 years, and the proportion of users who watch video is higher than 70%. Furthermore, we can conclude that the proportion of users who watch video at age 9–11 also reached 63%. By December of 2017, the Kids VOD our test based on had got more than 20 million accumulated users, of which 97% users are under 13 years old. The average time they watching videos is around 60 min per day. The number of users still increases with the quarterly speed of 13%.
Several key factors affecting user experience in using VOD service [24]. Krefetz proposed that the entire viewing experience must be pleasurable from discovery to content selection to the player controls. And thus be as important as content in online video service. Otherwise, viewers will not stick around long enough to figure out if they like the content [25]. He listed four important user interface features that provided good user experience to viewers such as personalizing interfaces, recommendation system, chat feature that viewers chatted while watching videos, and contextualized content. The purposes of providing animation in user interface is to make the system more friendly and likely, achieving good user experience.
3 Research Design
3.1 Context
Researchers have done a lot of studies on the research methods used to find how children use applications, such as experiments and measurement. Scales are normally used as the main methods in these studies. When assessing the animation effect design, researchers would like to design some experimental tasks to examine children’s ability of memory and comprehension. Bederson employed the concept of “mental map” and apply the animation transition to help children understand the construction of the application [26]. Thomas and Victor [27] conducted a “recall-recognition” paradigm to explore the effectiveness of different animation effects in improving user’s ability to remember the content of applications. During the “recall” process, in order to test how effective these animation was in improving memory, subjects were shown graphical objects with different animation in movement. Moreover, scholars asked children to use an interactive application designed for teaching math and to complete certain experimental tasks. The task completion times and number of mistake were used to indicate children’s performance in using the application. Ognjanovic and Ralls [28] considered that children in the usability test might give responses to comfort the examiners rather than express their real ideas. To prevent this kind of experimental error, they advocate using “Peer Tutoring” in the test, in which a child will be assigned a tutor to supervise them to complete the test. As children have difficulty in understanding text, Lorna and Read [16] uses smiley face and photos in the measurement scales to help children express their attitudes and preference, which increased the reliability and validity of the evaluation. Furthermore, young children’s responses might be influenced by the examiner or they cannot express their ideas accurately. Therefore, observing young children’s expression and manner of speaking will be helpful for understanding children’s assessment on products and assignments [28].
In this paper, to examine the effectiveness of the animation design in children’s cognitive ability, our research was conducted by 4 methods: experimental task, observation, interview and measurement scale. According to the characteristics of subjects, the methods of observation and interview are used to get more direct information from the subjects. The advantage of observation is to help examiner discover the true feelings of subjects from their expression and behavior, which can prevent subjects from unclear or inaccurate expression, and catering to the examiner’s pleasure. Since the subjects of this study were children aged 4–12 guided by the adult examiner in the test process, it would be easily for them to behave to satisfy the examiner and social desirability. Therefore, it was necessary to use the observation in the study.
Moreover, children’s click operation was observed in the memory task, because of the limitation in verbal expression of very young children. The order and times of the click could reflect subjects’ thinking process when recording. The interview started after the main experimental task, which focused on the doubts in the operation process for the purpose of interpretation of the experimental results. At the same time, in order to know more about users’ perception of the animation effect, the subjects were interviewed about their preference of animation usage in other applications they used before. If the subjects failed to express clearly in interview, researcher would change the way of communication, for example, let children drawing as assistance.
3.2 Participants
The age division of this experiment referenced Cognitive-Developmental Theory propounded by Piaget and Inhelder [10] and Erikson’s stages of psychosocial development [29]. In Cognitive-Developmental Theory, children of Preoperational Stage and Concrete Operations Stage differ in their thinking characteristics, which may lead to changes of children’s ability on understanding dynamic comprehension. In Erikson’s stages of psychosocial development, children in Stage 3 (Purpose) start to have autonomy and gradually improve their learning ability in Stage 4 (Competence), which may lead to the difference of task performance. Considering that children need to have adequate communication skills and cognitive abilities to ensure that the experiment is completed independently, the division is determined as the ages of 4–6 and 7–12.
Totally 120 users of Kid VOD application participated in this test, and they were selected by age range and usage experience. Participants were groups by age, the 4–6 years group and 7–12 years group. Each group had 60 participants, and 30 of them didn’t have used the “history” function while the other 30 had used that before. The calculation method which was came up by Sauro and Lewis [30] and Jin et al. [31] to calculate the number of required subjects was used in the study. The required samples as a whole would be influenced by some factors: 1. Confidence level α (in this study, when α = 0.9, t = 1.64); 2. The accepted sample bias d (the maximum deviation between the estimated value and the true value; the smaller the deviation, the higher the accuracy, the more required samples. In this study, d = 15%); 3. Quantity N (was regarded as an infinite value in this study). According to the calculation formula of sample size using Eq. (1)
We could draw that on the assumption α = 0.9 and d = 15%, the overall quantity n = 30, meaning that every test needed 30 subjects. This experiment divided participants into two age groups (4–6 years old and 7–12 years old) and each group used two different demos (with animation effect or without animation effect). Therefore, there were 4 test groups (2 × 2), 30 participants in each group and in this experiment, the history and the encyclopedia function in the Kid VOD were selected for the reason that history is one of the most high utilization rate functions (shown as Fig. 1). An equal numbers of users who had or had not the experience of using history function were distributed in each experimental group on average.

Distribution of entrance click on homepage functions (monthly value)
3.3 Instruments
Equipment.
The experiment was operated in an iPhone with 4.7 inches’ screen. According to the 2017 Q2 Summer Report of the Internet from Questmobile [32], the proportion of 4.7 inches’ mobile screen used by iOS users is 46%, which is higher than other screen size. The experiments are carried out in a quiet meeting rooms with colorful decoration, to provide the participants a proper and relaxing environment. In order to prevent children from distraction during the experimental process, some animation posters instead of toys were put up in the room. Moreover, voice recorder and camera were prepared to record the experiments. Before the experiment, examiners helped children and their parents to get familiar with the experimental environment, introduced the experiment purpose, the equipment, the privacy protection, and then asked them to sign the informed consents.
Demo Designed for Tasks.
This experiment included 3 tasks, all the participants were required to complete these tasks in sequence under the examiners’ guidance. The demo used in each tasks were designed based on the Kids VOD. Some of the animation in the demos were developed especially for the study. In the experimental tasks, researchers paid a lot of attention to the information from the subjects’ expression and operation through the observation. The types of animation we used in our user test were based on types and functions of animation as discussed in Novick [8]. The types we used in our animation demo are as Table 1. Since the type of gesture in the original table is not clearly defined [2], it seems as an action that users take by hand, not a transition effect in user interface, we moved it out of the table and did not use it in animation design of demos. The types of animation we used was shown as Table 1.
Product Series 1
Product series 1 used in task 1 included 3 demo: slow animation effect, quick animation effect and no animation effect (labelled as 1A, 1B, 1C). In task 1, subjects were asked to find and click icons–“History” and “Encyclopedia” to see whether they could learn how to go back to the upper level page from transfer animation effect when entered into this page. The task completion rate was measured by the number of wrong operation and observation of the examiner. The efficiency of completing task was measured through the completion time.
The homepage of the product is shown in Fig. 2. The design of the transfer animation effect and transition animation effect are based on the function of “History” and “Encyclopedia”. The unfolding interface of the “History” is shown as in Fig. 3. Following is the description about the animation effects used in the test (take Demo 1A for example):

The homepage of the Kids VOD application, with the history icon like “clock” in the left column.

The page of history of the Kids VOD application.
-
Transition effect: In the non-playing state, a non-magnified module will expand into the main module if it is clicked. The transition effect will be active in the process of change, and the duration of the page transition is 1.5 s [33].
-
Transition animation effect of the icon “History”: in the home page, the icon “History” gives a hint by zooming (dynamic hints have more significant impression on children’ vision).
-
The background texture of the modules and the transition effect adopt the metaphor of jelly.
Product Series 2
Product series 2 used in task 2. There are two sessions of the task 2: “Memorization” and “Representation”. Subjects were asked to remember 8 pictures of different cartoons, all the pictures entered with an animation effect or without animation effect, and these two demos are labelled as 2A and 2B. Then subjects were asked to put these pictures in corresponding positions in the paperboard, making a reappearance of what they remembered. This task mainly examined the effectiveness of animation effect in children’s memory, which was measured by the memory time, representation time and the accuracy of representation.
The “Memorization” section was as follow:
-
There were 8 pictures with light color and deer image shown on the screen, and every picture was the same.
-
After clicking each picture, a cartoon in the corresponding position appeared. There were total 8 different cartoons appeared on the screen.
-
Demo 2A: cartoons entered from different directions (e.g. the cartoon in the upper left position slide from the upper left)
-
Demo 2B: cartoons appeared from the same site directly (without animation effect). The screen showed as Fig. 4, after all the pictures appeared.
Fig. 4. 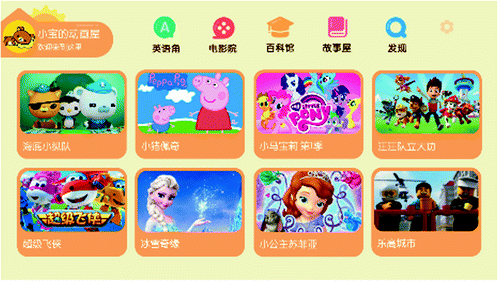
The page with 8 different cartoons.

The “Representation” section was: we made a paperboard of the page as Fig. 4, with light color and placeholder image, showing the corresponding positions. Also, we printed 8 cartoon cards which were the same as the demo showed. Subjects were required to place the 8 cartoon cards in the corresponding positions in their memory. The paperboard and 8 cartoon cards shows in Fig. 5.

The paperboard of the page with 8 cartoon cards in Task 2
Product Series 3
Product series 3 used in task 3. There were 2 sessions of the task 3: “Memorization” and “Representation”. Task 3 ask children to learn the logical construction which combines a series of product pages (the transition with an animation effect or B without animation effect). The two demos are labelled as 3A and 3B. After that, examiner asked children to put the cards in corresponding positions in the paperboard accurately according to the logical construction they learnt from the application. The understanding of the product structure was measured by learning time, representation time and the accuracy of representation.
The “Memorization” section was as follow:
-
Demo has 6 screenshots of the Kids VOD application. The logic of page transition is shown as Fig. 6. Only one screenshot and arrows in the corresponding directions appear after each click. Users can redirect the pages in the corresponding direction through clicking arrows or sliding pages.
Fig. 6. 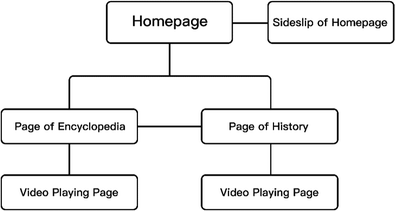
The construction of pages in Task 3.
-
Initially, there are the screenshot of homepage and three arrows pointing in different directions. These 3 arrows point to lower left, lower right and right, which separately direct to “Encyclopedia”, “History” and sideslip of the homepage (shown as Fig. 7).
Fig. 7. 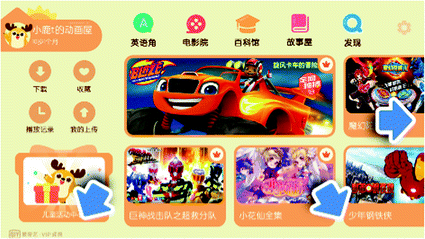
The homepage with arrows in Task 3.
-
Demo 3A: Transition with animation effect (fade in or fade out).
-
Demo 3B: Transition without animation effect (neither fade in nor fade out).


The “Representation” section was as follow: we made a paperboard with 6 wireframes which showed the spatial relationship among screenshots. We printed 6 screenshot cards which were the same as the demo shows. Subjects were asked to put these cards in the corresponding positions depending in their memory, shown as Fig. 8.

The paperboards of 6 pages in Task 3.
Measurement Scale.
This study used the measurement scale to measure subject’s emotion changes and preference. In order to avoid the individual difference in emotion, we tested the subjects’ mood before and after the experiment to capture their mood change. The main reference of the emotion rating scale was from Angold et al. [34], which developed a scale to measure children’s emotion. This study made some changes on Messer’s original measurement scale, deleting some improper questions (such as whether feel lonely or often cry) and modifying some statements without changing the original intention. Considering children would be impatient of the questionnaire, there were only 3 questions in the questionnaire in this study. However, the certain retest reliability α = 0.64 is above 0.5 (it is believed that the questionnaire can be trusted if the reliability is above 0.5) [35]. The scale measuring user preference of products integrated the System Usability Scale [36], Questionnaire for User Interaction Satisfaction V7.0 [37] and After-Scenario Questionnaire [38], and included proper questions that suitable for the experiment. The questionnaire designed for the experiment includes 7 questions, which had good reliability coefficient α = 0.76. Besides, the questionnaire used the pictures from Wong and Baker’s [39] emotion rating scale. It is believed that using pictures with different expressions is good for helping children understand the content of scale. Finally, researchers focused on the doubts appearing in the operation process and subjects’ feelings, including users’ preference for animation effect.
3.4 Data Analysis
One-Way Analysis of Variance.
For the study of continuous variables by the impact of changes in the classification of the situation, the statistical results are usually expressed by F value.
Paired-Samples t Test.
To examine the same body before and after two measurements of the same variable differences, the statistical results are usually expressed with t value.
Independent-Sample t Test.
For the study of continuous variables by the dichotomous variable (this experiment is low age, high age) changes in the situation, the statistical results are usually expressed with t value.
Pearson Correlation Analysis.
To examine the correlation of two consecutive variables. The statistical results are usually expressed by r value.
4 Findings
Children of different ages have different performance. From a viewpoint of developmental psychology, children in different age groups obviously have different performance in the development of perception, cognition, thinking and emotion. It is also confirmed by the data results. Children aged 7–12 have higher completion rate of the transition task than children aged 4–6, which indicates that children in these two age groups have difference in perception, cognition and thinking. Children aged 7–12 have higher product preference than children aged 4–6, which shows the difference in the development of emotion. All of these show that it is necessary to do more research about the children in different age groups: 4–6 years old and 7–12 years old. The detailed data is shown in Table 2.
There is no obvious difference in the task completion rate, understanding of product structure and preference for products when children aged 4–6 use the product with or without animation effect. Besides, from the interview, we found that children from this age group cannot understand the function of animation effect, which might cause distraction and confusion for them. Therefore, applying animation into the application aged 4–6 years old needs careful consideration.
Children aged 4–6 were asked to complete 3 tasks, then, researchers compared the data collected from these 3 tasks. In Task 1, subjects were asked to find certain icons and return to the page of the upper level. By comparison of the number of false click and the number of tips given by examiners, we found that there was no difference in completion rate for 4–6 year-old children when they used the 2 demos with or without animation effect. By comparing the completion time, we found that the completion efficiency is higher when subjects used the demo with animation effect than without animation effect. In the Task 2, subjects were asked to remember the product with or without the assistance of entrance animation. Through comparing the time of memorization, time of placement and the correct number of pictures situated, we found that subjects who used the demo with animation effect spend less time on remembering and putting cards, and have higher accuracy of putting cards in corresponding positions than those used the demo without animation effect. Therefore, we can conclude that animation can improve 4–6 year-old children’s memory of product content. In the Task 3, subjects were asked to remember the product structure with or without the assistance of transition animation effect. Through comparing the time of memorization, time of placement and the correct number of pictures situated, we found that children who used the demo with animation effect spend less time on learning and remembering product structure than those who used the demo without animation effect. However, there is no significant difference in time spent on putting cards and the accuracy of pictures situated. Moreover, there is also no significant difference in product preference and mood change between these subjects, which indicates that animation cannot obviously improve subjects’ preference for products. The detailed data is shown in Table 3.
Children aged 7–12 have better performance in task completion rate, completion efficiency, remembering product content and understanding product structure when they used the VOD products with animation effect than those used the VOD product without animation effect. Therefore, we suggest to develop animation for the products used by children aged 7–12.
Children aged 7–12 were asked to complete 3 tasks, in which the subjects were required to use the product with animation effect or without animation effect. Then, researchers compared the data collected from these three tasks. In the Task 1, subjects were asked to find certain icons and return to the page of the upper level. Through the comparison of the number of false click, the number of tips given by examiners and the completion time, we found that children aged 7–12 who used demo with animation effect showed higher completion efficiency than those used demo without animation effect. Therefore, animation can improve children’s task completion rate and completion efficiency. In the Task 2, subjects were asked to remember the position of 8 cartoons with or without the assistance of entrance animation. By comparing the time of memorization, time of placement and the correct number of pictures situated, we found that subjects who used the demo with animation effect spend less time on recall and putting the cards back in place with a higher accuracy than those used the demo without animation effect. Therefore, we can conclude that animation can improve 7–12 year-old children’s memory of product content. In the Task 3, subjects were asked to understand and remember the product structure with or without the assistance of transition animation effect. By comparing the time of memorization, time of placement and the correct number of pictures situated, we found that children aged 7–12 who used demo with animation effect perform better than those use demo without animation effect. Therefore, we can conclude that dynamic design can improve 7–12 year-old children’s understanding of product structure. Moreover, there is a significant difference in mood change and no significant difference in product preference between these two groups of subjects, which indicates that animation cannot obviously improve subjects’ preference for products. The detailed data is shown in Table 4.
In order to explore more deeply about the effect of product preference on children’s cognition, we separately analyzed the data collected from 4–6 year-old group and 7–12 year-old group to find the association between product preference and other test items respectively in these 3 tasks. For children aged 4–6, their product preference only has significant association with the understanding of product structure, and the association between these 2 variables is positive. For children aged 7–12, product preference has significant association with task completion rate, completion efficiency and the understanding of product structure. Product preference is positively correlated with task completion rate, completion efficiency and the understanding of product respectively. The detailed data is shown in Table 5.
We can illustrate from the table that children aged 4–6 and 7–12 have different performance when using demo with different animation effect. By analyzing the association between product preference and several indicators for task completion, we can conclude that: the association between age 4–6 children’s product preference and the status of task is relatively independent; whereas, age 7–12 children pay more attention to the design which is reflected by their preference for product. Besides, there are many differences in the psychological development between children aged 4–6 and 7–12, which causes their different needs for animation effect. We will explore more in next stage.
5 Discussion
The value of this study is to find the effect of the animation design on children’s cognition by analyzing the situation in which children use the application as usual. Researcher examined the concept of cognition from aspects memory, learning and emotion, and designs 3 experimental tasks to measure these indicators. The operation designed for these tasks is as similar as possible to the original condition when children use VOD application in daily life. Therefore, the effect of the animation on task completion rate and completion efficiency found in this study can reflect children’s use of application in normal times.
This study finds that animation design can improve age 7–12 children’s task completion rate, confirming that animation design can improve children’s experience of using applications in daily life. The memory of product content and understanding of product structure are contained in the usual process of using applications. For instance, whether children can find a certain function smoothly will depend on their memory of the location and icon of the function. Whether children can successfully find the page they want to go will depend on their understanding of the product structure. The tasks in this study detach these elements, exclude the impact of unrelated elements and explore the effect of animation design on memory and understanding of products. Moreover, this study explored the subjects’ preference for product and mood change before and after these tasks, while there are few previous studies referring to the effect of emotion. After doing correlation analysis about these relative variables and performance in tasks, we found that children aged 7–12 have more preference for products with animation effect than without animation effect, whereas children aged 4–6 do not have any difference in product preference.
From the viewpoint of the cognitive development of children, the attention spansFootnote 3 of children aged 4–6 normally are no more than 4 [40]. When watching the interface of the product, children initially put their attention to the cover of the cartoon, ignoring the prompt animation. However, children aged 7–12 have larger attention spans, which means that they can focus on more details and perform better in the perception of animation effect. From the interview, we also found that children aged 7–12 have better perception of the animation design, while age 4–6 children focus more on using the application (watching cartoons). In general, the study about the preference supports the finding that animation design impacts children’s cognitive development.
By analyzing the data collected from the experiment and interview, we found that children of different ages have different performance when they use the product with or without animation effect. When children aged 7–12 use the product with animation effect, they perform better in all aspects than those use the product without animation effect. However, children aged 4–6 only perform better in memory and completion efficiency when they use the product with animation effect. This conclusion can be explored further from the aspects of thinking development and institutional development. From the aspect of thinking development, the main characteristic of thought of children aged 4–6 is concrete image [10], which makes difficult for them to understand the assistance of transition animation. After completing the task, examiners directed age 4–6 children’s attention to the animation and asked them to repeat what they saw and feelings. We find that these children do not understand the meaning of transition animation even though they have noticed it under examiners’ guidance. Children said “I notice a block turns blue and bigger, but I do not know what it means”, “I see a small button flash, but I do not know what to do”. It indicates that animation effect causes distraction for age 4–6 children when they learning about the product. However, the characteristic of thought of children aged 7–12 is abstract-logic thinking. They not only feel the animation effect clearly but also understand the meaning of “guiding click” of prompt animation and the support role of “expend and return to the original condition” of transition animation. It makes age 7–12 children complete tasks more quickly with the assistance of animation effect and have better preference for products, whereas age 4–6 children do not have these performances.
Another explanation for “age 4–6 children do not have different performance in task completion rate” is that they are not familiar with searching through clicking. The content is presented in the form of function points in the homepage, which lacks of intuition for children aged 4–6. In the additional test, even though subjects were informed shortcuts, they still chose to sideslip to find content. In the task of understanding product structure, age 4–6 children did not show any difference when using 2 different application, which means it is difficult for them to understand complex structure of the product. As children aged 4–6 do not have the ability of structural thinking, they cannot realize the supporting role of animation effect which designed for helping them to understand. Therefore, we suggest to develop animation design for the products for children aged 7–12, and be more cautious about adding animation into the products for children aged 4–6. In what kind of status children aged 4–6 need more intuitive design is also a problem worthy of further study.
Moreover, researchers explore the effect of speed in transition animation to figure out if animation influences user experience through children’s understanding or through sub-consciousness. According to the previous perception research by Jin [33], children can barely notice the existence of animation when it lasts less than 0.5 s, but they can recognize sub-consciously. The result shows that fast animation can’t enhance the efficiency of completing tasks for children (Number of tips: t = 0.83, p = 0.41; Number of false click: t = 0.83, p = 0.41; Time of completion: t = 1.57, p = 0.12). Therefore, animation improves user experience through children’s understanding and a reasonable speed is expected.
The present research indicates that the best design varies for children of different age group. Moreover, with the different level of children’s psychological development, children of 4–6 and 7–12 perform differently over animation products. As for the animation, this research base on Novick’s conclusion of animation types [8] to design the test demos, which includes change of position and size. These two animation modes work differently under different circumstances. For example, under content searching circumstance, children memorize better when animation appear from different positions. While under different interface transition circumstance, the transfer animation can improve children’s understanding of product structure, and help them remember the position of these pages. However, the impact of animation is different in different age groups, which indicates the need of field study towards children of different age when setting application scenarios and designing styles. Future study may build up a more complete children development design system through similar research on interface structure design, sound design and visual design (Fig. 9).

The role of animation in different ages and scenes.
6 Conclusion
Animation Design has different impact on children’s product application and cognition of diverse age group. From the perspective of Developmental Psychology, there is a significant difference in the attention span, memory mode, thinking mode and emotional development between children aged 4–6 and 7–12. Children aged 4–6 have a relatively small attention span, and rely mainly on mechanical memory and imagery thinking. While 7–12 aged children have a bigger attention span and are capable of abstract logical thinking, also, they tend to develop partnership according to their emotional development. These differences show the distinction of information processing complexity among these two age-range groups. This research finds that animation can provide different impact on children’ comprehension and interaction with user interface. When interacting with user interface, animation has a positive effect on comprehension, memory, task completion rates and efficiency, preference among children of 7–12 years old, however, there is no significant effect on task completion rates, comprehension and preference among children aged 4–6. According to the result of tasks and interview, 4–6 year-old children are not able to understand the meaning of animation in application products. In consideration of their attention span and thinking model, animated user interface might have adverse effect on their interaction with user interface. From another aspect, this indicates that children aged 4–6 prefer a more direct way of information transmission. The limitation of our research is that not every type of animation was tested in our study. The animation we used in the demos, if sorted by function in the application, can be summed up as transition and entrance. Because the main point of this research is to figure out the impact of animation on children among diverse age groups, there is not much discussion over the types and function of animation in different usage scenarios, and this can be further studied in the future.
Notes
- 1.
The Kids VOD is a popular video on demand mobile application for children in China. “VOD” is the abbreviation of “Video on Demand”.
- 2.
iResearch is a provider of online audience measurement and consumer insights in China. http://www.iresearchchina.com/.
- 3.
The attention spans means the amount of content a person can be aware of at the same time.
References
Dessart, C.-E., Genaro Motti, V., Vanderdonckt, J.: Showing User Interface Adaptivity
Liddle, D.: Emerging Guidelines for Communicating with Animation in Mobile User Interfaces, pp. 1–9 (2016)
Johnston, O., Thomas, F.: The Illusion of Life: Disney Animation (1981)
Chang, B.-W., Ungar, D.: Animation: From Cartoons to the User Interface (1995)
Apple: iOS Human Interface Guideline. Visual Design: Animation. https://developer.apple.com/ios/human-interface-guidelines/visual-design/animation. Accessed 4 Jan 2018
Google: Android Material Design: Motion. https://material.io/guidelines/motion/material-motion.html. Accessed 4 Jan 2018
Microsoft: The Fluent Design System: Motion. https://docs.microsoft.com/zh-cn/windows/uwp/design/fluent-design-system/index#motion. Accessed 4 Jan 2018
Novick, D., Rhodes, J., Wert, W.: The communicative functions of animation in user interface. In: Proceedings of the 29th ACM International Conference on Design of Communication (SIGDOC 2011). ACM, New York (2011). https://doi.org/10.1145/2038476.2038478
Idler, S.: 5 Key Difference between Kids and Adults (2013)
Piaget, J., Inhelder, B.: The psychology of the child. Br. Med. J. 1753–1755 (1913)
Nielson, J.: Children’s Websites: Usability Issues in Designing for Young People (2010)
Hanna, L., Risden, K., Alexander, K.: Guidelines for Usability Testing with Children (1997)
Sim, G., MacFarlane, S., Read, J.: All work and no play: measuring fun, usability, and learning in software for children. Comput. Educ. 235–248 (2006)
Crain, W.: Theories of Development: Concepts and Applications, 6th edn. Pearson Education, Inc., Upper Saddle River (2011). ISBN 978-0-205-81046-8
Taslim, J., Wan Adnan, W.A., Abu Bakar, N.A.: Investigating children preferences of a user interface design. In: Jacko, J.A. (ed.) HCI 2009. LNCS, vol. 5610, pp. 510–513. Springer, Heidelberg (2009). https://doi.org/10.1007/978-3-642-02574-7_57
McKnight, L., Read, J.C.: Designing the record button: using children’s understanding of icons to inform the design of a musical interface. In: Proceedings of the 8th International Conference on Interaction Design and Children. ACM (2009)
Leif Azzopardi, D.D., Marshall, K.A.: YooSee: a Video Browsing Application for Young Children (2012)
Dyer, S., Adamo-Villani, N.: Animated Versus Static User Interfaces: A Study of MathsignerTM (2008)
Jin, Q.C.: Experimental study on threshold of moto perception. Acta Psychol. Sinica (1957)
Burroughs, B.: YouTube Kids: the App Economy and Mobile Parenting (2017)
Livingstone, S., Haddon, L., Görzig, A., Ólafsson, K.: Risks and safety on the internet: the perspective of European children (2013)
Neumann, M.M., Neumann, D.L.: Touch screen tablets and emergent literacy. Early Childhood Educ. J. 42, 231–239 (2013)
iResearch: Research about the Use of Internet of Chinese teenager and children in 2015. http://www.iresearch.com.cn/report/2383.html#chart. Accessed 4 Jan 2018
Bradwell, J.: Does User Experience Match User Expectation in VOD Services? (2015)
Krefetz, N.: User experience: to keep viewers, online video must be a joy (2015)
Bederson, B.B., Angela, B.: Does animation help users build mental maps of spatial information? In: Proceedings of 1999 IEEE Symposium on Information Visualization, Info Vis 1999 (1999)
Thomas, B.H., Victor, D.: Evaluation of animation effects to improve indirect manipulation. In: First Australasian User Interface Conference, AUIC 2000. IEEE (2000)
Ognjanovic, S., Jason, R.: Don’t talk to strangers! peer tutoring versus active intervention methodologies in interviewing children. In: Extended Abstracts on Human Factors in Computing Systems, CHI 2013. ACM (2013)
Erikson, E.: The problem of ego identity. J. Am. Psychoanal. Assoc. 4, 56–121 (1956). https://doi.org/10.1177/000306515600400104. Accessed 28 Jan 2012
Sauro, J., Lewis, J.R.: Quantifying the User Experience: Practical Statistics for User Research. Morgan Kaufmann, Burlington (2015)
Jin, Y.J., Du, Z.F., Jiang, Y.: Sampling Techniques, pp. 29–30. China Renmin University Press, Beijing (2015)
Questmobile 2017: Q2 Summer Report of the Internet. http://www.questmobile.com.cn/blog/blog_98.html. Accessed 4 Jan 2018
Jin, Q.C.: Experimental study on threshold of moto perception. Acta Psychol. Sinica (1957)
Angold, A., et al.: Development of a short questionnaire for use in epidemiological studies of depression in children and adolescents. Int. J. Methods Psychiatr. Res. (1995)
Reliability: http://myweb.fcu.edu.tw/~mhsung/Research/Research_Methods/DOE/Reliability.htm. Accessed 4 Jan 2018
Lewis, J.R., Sauro, J.: The factor structure of the system usability scale. Paper Presented at the First International Conference on Human Centered Design (2009)
QUIS: Questionnaire for User Interaction Satisfaction. About the QUIS, version 7.0. http://lap.umd.edu/quis/. Accessed 4 Jan 2018
Lewis, J.R.: IBM computer usability satisfaction questionnaires: psychometric evaluation and instructions for use. Int. J. Hum.-Comput. Interact. (1995)
Wong, D.L., Baker, C.M.: Pain in children: comparison of assessment scales. Pediatr. Nurs. 14(1), 9–17 (1988)
Huifang, C., Huashan, C.: Experimental study on the development of attention span between 4 and 14 years old. Psychol. Sci. 1, 47–49 (1989)
Author information
Authors and Affiliations
Corresponding author
Editor information
Editors and Affiliations
Rights and permissions
Copyright information
© 2018 Springer International Publishing AG, part of Springer Nature
About this paper

Cite this paper
Li, W., Zhang, X., Zhang, Y.S. (2018). How Animation Improve Children’s Cognition in User Interface: A Study of the Kids VOD Application. In: Marcus, A., Wang, W. (eds) Design, User Experience, and Usability: Users, Contexts and Case Studies. DUXU 2018. Lecture Notes in Computer Science(), vol 10920. Springer, Cham. https://doi.org/10.1007/978-3-319-91806-8_16
Download citation
DOI: https://doi.org/10.1007/978-3-319-91806-8_16
Published:
Publisher Name: Springer, Cham
Print ISBN: 978-3-319-91805-1
Online ISBN: 978-3-319-91806-8
eBook Packages: Computer ScienceComputer Science (R0)