
Abstract
Nowadays, autonomous driving systems are being developed and utilized. And high precision 3D map data is said to be necessary to realize autonomous driving. This data contains position data of features such as “road line”, “road edge” and “road sign”. This map data is created with point cloud data taken by Mobile Mapping System (MMS), and to reduce cost, it is desirable that the map creation work is automated, but in fact it is difficult to fully automate. So first, features detection process will be performed by an automatic process, and then a manual confirmation process will be performed. Therefore, in order to reduce cost, it is important to improve a manual confirmation process. In this paper, we propose a system that improves a manual confirmation process by displaying features in different color using evaluation items unique to each feature type.
In experiment, we used actual MMS data on Tokyo Japan, performed auto features detection process and got features data with evaluation item values. We investigated whether an appropriate low evaluation item values is given for error detection. As a result, we confirmed the effectiveness of this system.
You have full access to this open access chapter, Download conference paper PDF
Keywords
1 Introduction
Nowadays, autonomous driving systems are being developed and utilized. Information for automated driving is mainly provided by car equipped sensors such as cameras or radars, but detection range of these sensors are limited. Therefore, high precision 3D map data is said to be necessary to realize autonomous driving. This data contains position data of features such as “road line”, “road edge” and “road sign” (see Fig. 1). Position data of road line can be used to recognize where to drive, it of road edge can be used to recognize where to escape in an emergency, it of road sign can be used to recognize self position precisely. Furthermore, to know road line shape over sensors range enable comfortable driving such as “changing lane for the destination in advance” or “decelerating before curved section”.

Image of high precision map data
3D map data is created with point cloud data taken by Mobile Mapping System (MMS) (see Fig. 2) and map creation process should be automated to reduce cost. However, complete automation is much difficult because some road line may be faded, or some road edge may covered with grass, so manual confirmation process will be necessary. Therefore, in order to reduce cost, it is important to improve efficiency of manual confirmation process. In this paper, we develop system that can improve it.

Assumed components of MMS
2 High Precision Map Creation
In this paragraph, the overall flow of high precision map creation system is described. High precision map is generated through processing shown below.
-
Getting measured data using MMS
-
Automatic map creation processing by software
-
Manual confirmation and modification processing
2.1 Getting Measured Data Using MMS
MMS is the car which has equipment for self-location grasping such as GPS antenna or IMU (Inertial measurement unit) and equipment for surrounding measurement such as radar or cameras. MMS can measure high precision 3D point cloud data and image data about the traveling road, although when a car is running by the side of MMS, MMS cannot get data about the back of it. And point data contains reflectance data as well as 3D position data.
2.2 Automatic Map Creation Processing by Software
Automatic map creation processing is the function that creates high precision positioning data such as road line, road edge and road sign from MMS data. For example, road line can be detected where reflectance is high, road edge can be detected where height difference is larger compared to the surroundings. These feature detection method is being studied in various way [1, 2, 3]. However, it may be difficult to detect the appropriate feature position fully, for example, due to faded and losing lines or road edge covered with grass.
2.3 Manual Confirmation and Modification Processing
Automatic map creation processing may cause over-detected failure or undetected failure (over-detected failure means detecting feature that should not be detected, undetected failure means not detecting feature that should be detected). So manual confirmation and modification processing must be performed. We should check failure detection and modify it correctly. The map data created through these processing can be actually used for autonomous driving.
3 Method of Calculating Reliable Value
In this paragraph, the method of calculating reliable value for road line, road edge and road sign is described. The reliable value is used to clearly indicate which features are highly necessary to modify, and it is derived from evaluation item values. So, first, we show the method of deriving the evaluation item values and then show the method of calculating reliable value using the evaluation item value.
3.1 Method of Deriving the Evaluation Item Values
We use different evaluation items depending on features, so we explain evaluation items for each feature.
Road Line
-
Amount of change in reflectance.
This item value indicates vividness of the road line, we consider vivid line is reliable. So if the line is faded, the evaluation value will drop. To calculate this value, we use points in the transverse direction from the point on road line, and we obtain the difference in reflectance between the point near line and the point with low reflectance (see Fig. 3).
Fig. 3. 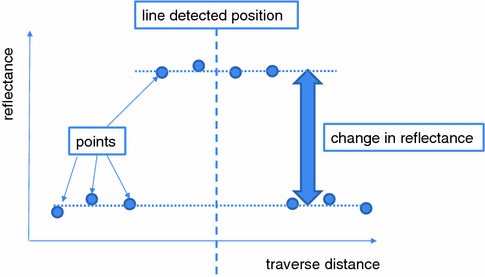
How to get “Amount of change in reflectance”
-
Linear shape
This item value indicates whether the line shape seems good or not, we consider straight or clean curve line is reliable, so if the detected line is jagged, the evaluation value will drop. To calculate this value, we approximate a point sequence constituting a line to a function, and we obtain the sum of errors of approximation.
-
Distance from MMS
This item value indicates the distance from measuring car (MMS) to the detected line, point cloud is dense near MMS, and is sparse far from MMS, so we consider detected line near MMS is more reliable.

Road Edge
-
Amount of change in height
This item value indicates height of the road edge, we consider high edge is reliable. So if the edge is gentle, the evaluation value will drop. To calculate this value, we use points near the edge, and we obtain the height difference of these points.
-
Linear shape
Same as Linear shape in road line.
-
Distance from MMS
Same as Distance from MMS in road line.
Road Sign
-
Direction of surface
This item value indicates coincidence between direction of detected road sign surface and direction of MMS trajectory, we consider road sign which confronts to driver is reliable. To calculate this value, we create clusters by grouping nearby points, and fit clusters to a plane.
-
Relationship between height and size
This item value indicates properness of detected road sign size when considering its height, because the higher sign should be display larger in order to have the driver recognize the sign. To calculate this value, we create clusters and calculate its bounding box size.
-
Distance from MMS
Same as Distance from MMS in road line.
3.2 Method of Calculating Reliable Value Using the Evaluation Item Value
Reliable value is calculated by adding weighted evaluation item values. All evaluation item values range from 0 to 1. And in this system, all evaluation item values are equally weighted. To get better weighting or new function which derives better reliable value, it is possible to use machine learning and learn the correlation between features modified in manual processing and its evaluation item values.
4 Reliable Value Displaying System
In this paragraph, reliable value displaying system which uses detected feature data with reliable value is described. In this system, features are displayed in different colors, and point clouds data is also displayed on the background (see Fig. 4). A red feature indicates low reliability and a blue one indicates high reliability. The user can change view point position by mouse operation, and can check whether detections are correct.

Image of reliable value displaying system. (Color figure online)
5 Experiment
In this paragraph, we perform experiment using reliable value displaying system. We used actual 35 km MMS data on highway in Tokyo Japan (details is shown in Table 1 and data image is shown in Fig. 5), performed auto features detection process and got features data with reliable value. We counted the number of wrong detections, wrong detections with reliable value lower than 0.8 and correct detections with reliable value lower than 0.8. Result of experiment is shown in Table 2, and example of detections with reliable value are shown in Figs. 6, 7, 8, 9, 10, 11 and 12.

Enlarged image of experiment use data

Example of line wrong detection with low reliable value. (Color figure online)

Example of line wrong detection with high reliable value. (Color figure online)

Example of edge wrong detection with low reliable value. (Color figure online)

Example of edge wrong detection with high reliable value. (Color figure online)

Example of edge correct detection with high reliable value. (Color figure online)

Example of sign wrong detection with low reliable value. (Color figure online)

Example of sign wrong detection with high reliable value. (Color figure online)
Considerations on the results for each feature type are shown below.
Line:
Low reliable value rate among wrong detection (b/a) was not so high. Most of wrong detection were due to marks on road surface such as sign for destination or deceleration, and these marks were often arranged regularly. Therefore “Linear shape” value and reliable value became high. In order to set reliable value appropriately, it is necessary to use item for evaluating line spacing.
Wrong detection rate among detection with low reliable value (b/(b + c)) was also not so high. Because there were some faded line, and “Amount of change in reflectance” value and reliable value became low. But this evaluation item seems to be necessary, because line wrong detection may occur on the road surface.
Edge:
Both rate (b/a and b/(b + c)) were high. Most of wrong detection were due to shielding by parallel running vehicle and grass near the edge, and these were reflected in “Linear shape” value.
Sign:
Low reliable value rate among wrong detection (b/a) was not so high. Some wrong detection were due to the side of the bridge. In order to set reliable value appropriately, it is necessary to use item for Image recognition. MMS can get Image data, so using image data and image recognition, wrong detection on the side of the bridge can be set low reliable value.
6 Conclusion
To realize autonomous driving, high precision 3D map data is said to be indispensable, and it is important to reduce the cost of creating maps. We have proposed a novel system that displays features in a color according to reliable value, and enables to find suspicious map data quickly. Reliable value is calculated using evaluation item values unique to each feature type. Experiment result showed that the proposed system could recognize error detection to a certain extent, and it is assumed that more appropriate reliable value can be obtained by adding suitable evaluation items. Furthermore, we used reliable value calculated with the function which weights all evaluation item value equally, there will be a better function. In the near future, we will develop a better function using machine learning. And it is also necessary to investigate and improve the display method for making it easier for users to confirm error detection.
References
Guan, H., Li, J., Yu, Y., Wang, C., Chapman, M., Yang, B.: Using mobile laser scanning data for automated extraction of road markings. ISPRS J. Photogram. Remote Sens. 87, 93–107 (2014)
Pu, S., Rutzinger, M., Vosselman, G., Elberink, S.: Recognizing basic structures from mobile laser scanning data for road inventory studies. ISPRS J. Photogram. Remote Sens. 66, S28–S39 (2011)
Boyko, A., Funkhouser, T.: Extracting roads from dense point clouds in large scale urban environment. ISPRS J. Photogram. Remote Sens. 66, S2–S12 (2011)
Liu, W., Anguelov, D., Erhan, D., Szegedy, C., Reed, S., Fu, C.-Y., Berg, A.C.: SSD: single shot MultiBox detector. In: Leibe, B., Matas, J., Sebe, N., Welling, M. (eds.) ECCV 2016. LNCS, vol. 9905, pp. 21–37. Springer, Cham (2016). https://doi.org/10.1007/978-3-319-46448-0_2
Author information
Authors and Affiliations
Corresponding authors
Editor information
Editors and Affiliations
Rights and permissions
Copyright information
© 2018 Springer International Publishing AG, part of Springer Nature
About this paper

Cite this paper
Watanabe, M., Sakairi, T., Shimazaki, K. (2018). Evaluation of High Precision Map Creation System with Evaluation Items Unique to Each Feature Type. In: Meiselwitz, G. (eds) Social Computing and Social Media. User Experience and Behavior. SCSM 2018. Lecture Notes in Computer Science(), vol 10913. Springer, Cham. https://doi.org/10.1007/978-3-319-91521-0_12
Download citation
DOI: https://doi.org/10.1007/978-3-319-91521-0_12
Published:
Publisher Name: Springer, Cham
Print ISBN: 978-3-319-91520-3
Online ISBN: 978-3-319-91521-0
eBook Packages: Computer ScienceComputer Science (R0)