
Abstract
Markets of Biobased Resources and Products: This chapter takes a closer look at the global market for biobased products and resources and its interactions with agricultural and food markets. In particular, it describes the effect of increasing demand for biobased products on market prices and thus the quantity of agricultural resources demanded and supplied. Furthermore, we discuss factors that may drive or limit demand and supply of biobased products. We analyse the market for biobased resources and products, considering products that are already established in the market, such as biofuels, as well as products that could acquire a substantial market acceptance in the future, such as bio-plastics. In addition, we briefly introduce selected policy instruments applied to support biobased products.
The chapter provides a simple example of a perfectly competitive market for biobased products to introduce the market model. It starts by presenting the supply and demand curves and discussing the differences between price changes and those of other determinants of supply and demand with respect to their effects on the respective curve. It then explains how the supply and demand curves jointly determine the equilibrium price and quantity on the market and how the market price regulates surpluses and shortages under the assumption of an autarkic country. We apply this market model to demonstrate the effect of one particular policy for promoting the production of biobased products on the equilibrium market price and quantity.
Sustainable Development and Sustainability Management: In the last decade(s), the idea of sustainable development has become a widely acknowledged topic which is supported by many actors in modern society.
Companies, as central economic players, are increasingly pressured by a wide set of stakeholders to engage in sustainability management and to contribute their share towards sustainability. Against this background, this chapter first introduces the general idea of sustainable development with its elements of intragenerational and intergenerational justice and illustrates the roots of sustainable development as a normative-anthropocentric concept. Since sustainability is a contested idea with many different notions, the different understandings of weak, strong and quasi-sustainability are introduced and the status quo of sustainability in society is highlighted.
Following this general introduction, actors of sustainability in society are named and the relevance of sustainability management for companies is discussed. In the remainder of this chapter, three base strategies to achieve sustainability (i.e. eco-efficiency, eco-effectiveness and sufficiency) are explained along with their opportunities and limitations in achieving sustainability. Finally, some exemplary elements and tools of sustainability management from the areas of sustainability accounting and management control as well as of sustainable supply chain management are introduced to provide a first glimpse of possibilities for companies to engage with sustainability.
Life Cycle Sustainability Assessment: The bioeconomy is based on the three pillars of sustainability and aims to balance the environmental, economic and social aspects. For this task, tools are required that provide qualitative and quantitative information on the environmental, economic and social performance of biobased products and on the trade-offs between the goals of the three dimensions of sustainability. In this chapter, a methodological approach for a Sustainability Assessment based on ‘Life-Cycle Thinking’ is presented. This approach combines the use of three forms of assessment: Life-Cycle Assessment (LCA) for the environmental aspects, Life-Cycle Costing (LCC) for the economic aspects and Social Life-Cycle Assessment (sLCA) for the social aspects. Together these form the most comprehensive methodology for sustainability assessment: Life-Cycle Sustainability Assessment (LCSA). A hypothetical example of an LCSA is elaborated for a biobased product to illustrate the different assessment steps.
Entrepreneurial Ventures and the Bioeconomy: Entrepreneurship is based on entrepreneurial opportunities and the bioeconomy offers a plethora of such opportunities. As the bioeconomy—at least partially—addresses humanity’s greatest challenges, it consequently offers the greatest entrepreneurial opportunities as well. One useful tool to break down the idea generation process and manage the entrepreneurial process is the business model canvas, which makes it possible to clearly describe the value proposition of a new venture in the bioeconomy. The lean start-up approach can help entrepreneurs in the bioeconomy to move efficiently through the entrepreneurial process and to quickly develop a value proposition and a validated business model.
The original online version of this chapter was revised. An erratum to this chapter can be found at https://doi.org/10.1007/978-3-319-68152-8_13.
Individual section’s authors are indicated on the corresponding sections.
You have full access to this open access chapter, Download chapter PDF
Keywords
- Market mechanisms
- Biobased resource and product markets
- Food and feed markets
- Demand and supply curves
- Policy instruments
- Carbon tax
- Sustainability
- SDGs
- Stakeholder
- Eco-efficiency
- Eco-effectiveness
- Sufficiency
- Value chain assessment
- System analysis
- Life-cycle thinking
- Life-cycle assessment
- Life-cycle costing
- Social life-cycle assessment
- Life-cycle sustainability assessment
- Entrepreneurial opportunity
- Business model
- Start-up process
In the year 2013, the turnover of the total European (EU 28) bioeconomy, including the primary sectors agriculture and forestry as well as the sectors of food, pulp and paper, forestry-based industries, bioenergy and others, was 2.1 trillion euros (based on Eurostat data of 2013). Roughly half of this is accounted for by the food and beverages sector, almost a quarter by the primary sectors (agriculture and forestry), while the other quarter comes from biobased industries, such as bio-chemicals, bio-plastics, pharmaceuticals, pulp and paper products, forest-based industries, textiles, biofuels and bioenergy (see Fig. 8.1).

Turnover in the European (EU 28) bioeconomy in the year 2013 (Piotrowski et al. 2016)
The relevance of the different bioeconomic sectors may differ between regions and countries. However, it becomes clear that, presently, food production is the economically most important sector in the bioeconomy, followed by agriculture, forest-based industry and pulp and paper production (Fig. 8.1). The resources for the forest-based industry and pulp and paper production mainly come from forestry. Most other biobased resources used in the bioeconomy, especially for food production but increasingly also for chemicals, plastics, pharmaceuticals, textiles and other products, stem from agricultural production and therefore may indirectly, via land use, or directly, via use of edible raw material, interfere or compete with food supply. Markets for biobased resources therefore overlap with food markets to a large extent. To avoid negative effects on food security, it is necessary to understand how markets for biobased products function. Thus, in Sect. 8.1 explains market mechanisms and market influencing factors of biobased resource and product markets, e.g. an increasing demand for biobased resources for biofuel production and policy instruments, such as subsidies.
The precondition for a sustainably growing bioeconomy is that sustainably produced biobased products are brought onto the market. Section 8.2 therefore provides guidance on how companies, as central economic players, can engage in sustainability management and contribute their share towards sustainability. Actors of sustainability in society are named and the relevance of sustainability management for companies is discussed. Important elements and tools of sustainability management from the areas of sustainability accounting and management control as well as of sustainable supply chain management are introduced to provide a first glimpse of possibilities for companies to engage with sustainability. Life-Cycle Sustainability Assessment (LCSA) is so far the most comprehensive methodology for sustainability assessment and Life-Cycle Assessment (LCA) is a tool broadly used by companies to assess the ecological and energetic performance of biobased value chains. These tools and their use are described in Sect. 8.3.
Finally, the bioeconomy will only grow if entrepreneurs take the initiative to develop novel and innovative biobased products and bring them onto the market. The bioeconomy offers great entrepreneurial opportunities. Section 8.4 introduces the business model canvas, a useful tool to break down the idea generation process and manage the entrepreneurial process. This tool makes it possible to clearly describe the value proposition of a new venture in the bioeconomy. This lean start-up approach can help entrepreneurs in the bioeconomy to move efficiently through the entrepreneurial process and to quickly develop a value proposition and a validated business model.
1 Markets of Biobased Resources and Products
Abstract
This chapter takes a closer look at the global market for biobased products and resources and its interactions with agricultural and food markets. In particular, it describes the effect of increasing demand for biobased products on market prices and thus the quantity of agricultural resources demanded and supplied. Furthermore, we discuss factors that may drive or limit demand and supply of biobased products. We analyse the market for biobased resources and products, considering products that are already established in the market, such as biofuels, as well as products that could acquire a substantial market acceptance in the future, such as bio-plastics. In addition, we briefly introduce selected policy instruments applied to support biobased products.
The chapter provides a simple example of a perfectly competitive market for biobased products to introduce the market model. It starts by presenting the supply and demand curves and discussing the differences between price changes and those of other determinants of supply and demand with respect to their effects on the respective curve. It then explains how the supply and demand curves jointly determine the equilibrium price and quantity on the market and how the market price regulates surpluses and shortages under the assumption of an autarkic country. We apply this market model to demonstrate the effect of one particular policy for promoting the production of biobased products on the equilibrium market price and quantity.

© Uli Maier
Learning Objectives
After reading this chapter, you should be able to
-
Understand the challenges on the market for biobased products, and explain driving and limiting forces of supply and demand for biobased products
-
Understand the functioning of resource and product markets and the price mechanism
-
Analyse the effects of supply and demand shocks on the market for biobased products, and understand interlinkages with food and feed markets
-
Explain policy effects and how they can be used to influence the markets for biobased products
1.1 Introduction
Concerns about the exhaustion of natural resources and climate change have raised interest in the production of biobased products. This has been driven in particular by the depletion of limited global natural resources such as oil reserves (Sect. 2.1), the dependency on oil-producing countries and the increasing number of agreements on environmental protection and climate change mitigation. As a consequence, governments are increasingly endeavouring to support the production of biobased products through policies. The associated political objectives include sustainable production and achievement of sustainable development goals, reduction of environmental pollution, mitigation of climate change effects, and increased self-sufficiency in energy production thus lowering dependence on oil-producing countries, such as Organization of the Petroleum Exporting Countries (OPEC) members and other politically unstable regions.
However, the market for biobased resources and products also faces several limiting factors. The production costs of biobased products are much higher than those of “unsustainable” products already established on the market. As a result, biobased products are often not competitive at current market prices. Their future competitiveness requires continued research and development, which—due to market failures—may not occur without some temporary government intervention, such as subsidies, public procurement, blending mandates and the establishment of labelling or certification programs that distinguish these products from traditional ones, attesting their higher value and thus justifying the charging of viable prices. Figure 8.2 lists the major driving and limiting factors in the demand and supply of biobased products and resources.

Major driving and limiting forces in demand and supply of biobased resources and products
The continuous growth in global population, together with changes in diets through improved living standards, has led to sharp increases in the demand for food and feed products. On the other hand, climate change and finite resources are driving additional demand for biobased products. Since biobased products are often at least partly based on primary agricultural commodities, this creates a conflict with food security objectives through the competition for limited resources, such as land, water and other inputs to agricultural production. For example, additional demand for agricultural products as feedstock for biofuels production has been identified as one factor that triggered the food price spikes in 2007/2008 and 2011. These interdependencies with food demand and supply and thus food security hamper the implementation of policy instruments to support sustainable production, because this requires comprehensive consideration of the entire nexus between development, food security and environmental objectives.
1.2 Developments on the Markets for Biobased Products (and Resources?)
The OECD (2012) defines biobased products as goods excluding food and feed that are “composed in whole or in significant parts of biological products, forestry materials, or renewable domestic agricultural materials, including plant, animal or marine materials”. In this section, we briefly introduce market developments for biobased products that can be divided into three main categories: biofuels, biochemicals and biomaterials (see Fig. 8.3 for further explanations).

Categories of biobased products
First, we take a closer look at the market for biofuels, the largest of the three biobased product groups and one which has existed for more than three decades. Markets for the other two, biochemicals and biomaterials, are still in development and information on these is scarce.
Global liquid biofuel production has continuously increased over the last three decades. Figure 8.4a shows the development of the world ethanol and biodiesel production from 2007 to 2015. In 2015, global biofuel production amounted to 146 billion litres, almost double that of 2007. Ethanol production accounts for nearly 80% of total biofuel production (OECD/FAO 2016). In 2015, North America was the major producer of biofuels, followed by Latin America (including the Caribbean) and the European Union (Fig. 8.4b). According to Gallagher (2008), around 1% of total global cropland was used for biofuel production in 2006. OECD/FAO (2016) predicts an increase in production of 11.1% for biodiesel and 31.1% for ethanol by 2025.

Development of global liquid biofuel production (OECD.Stat 2016)
As a result of the 1973 oil embargo initiated by OPEC, which led to a dramatic increase in oil prices, Brazil started the production of ethanol from sugar cane with a view to becoming less dependent on oil-producing countries. This move was facilitated by the low international sugar prices at that time and by Brazil’s implementation of several policies promoting the further expansion of ethanol production. In 2009, Brazil produced around one third of global ethanol, only exceeded by the USA with a share of more than 50%, mainly produced from maize (Janda et al. 2012). The EU is the major producer of biodiesel (80%). In Germany, 760,000 ha of agricultural land were cultivated with rapeseed in 2016 for the production of biodiesel and vegetable oil (FNR 2017). However, the production of biodiesel from soybean is increasing in the USA. Figure 8.5 depicts the development in demand for three crops used for biofuel production from 2000 until 2015. It becomes obvious from these graphs how much biofuel production has increased the demand for the agricultural products maize, sugar cane and vegetable oils. While the biofuel demand for sugar cane (vegetable oils) accounted for around 11% (less than 1%) in 2000 it increased to 21% (more than 12%) in 2015. The graph for sugar cane demand in particular highlights the food price spikes in 2007/2008 and 2011 and shows increased demand for biofuels due to very high oil prices with one year lag.

Crop product demand for biofuel production (OECD.Stat 2016). Note: Red line: % of total crop production, blue bars: biofuel use in tons
A high crude oil price may be an important factor for the competitiveness of biofuels. However, energy also contributes to the total production cost of biofuels. The extent differs between countries and crops used for production. Van Lampe (2007) assess biofuel production costs by considering energy, processing and feedstock costs and subtracting the value of by-products. A simple indicator of the biofuel competitiveness can be derived from the ratio of crude oil to biofuel feedstock prices. The demand for alternative fuels, such as biofuels, increases with rising crude oil prices. This, in turn, increases the demand for agricultural commodities, such as maize, rapeseed and sugar cane, and raises their prices. Consequently, higher oil prices increase biofuel production and feedstock costs. In addition, the contribution of by-products may diminish, because outlets become satiated, increasing biofuel production costs even further. Figure 8.6 reveals that the price index for commodity fuels tracks the price index for crude oil, whereas the index for agricultural raw materials follows to a lesser extent. During the crude oil price spikes in 2007/2008 and 2011–2014, biofuel feedstock prices, represented by the index for agricultural raw materials, increased less than the crude oil price, thus increasing the competitiveness and economic viability of biofuels.

Price indices for different commodity aggregates (IMF 2016 and World Bank 2016). Note: Commodity Agricultural Raw Materials Index includes timber, cotton, wool, rubber and hides price indices. Commodity Index includes both fuel and non-fuel price indices. Commodity Fuel (energy) Index includes crude oil (petroleum), natural gas, and coal indices. Crude Oil (petroleum) Price index is simply the average of three spot prices: Dated Brent, West Texas and the Dubai Fateh
The markets for biochemicals and biomaterials are less developed than that for biofuels. Biochemicals and biomaterials can still be regarded as infant industries but they could acquire a substantial market acceptance in the future.
Both the number of biochemicals produced from biomass and the range of products made from these biochemicals are very high. Due to this diversity, the OECD (2011) classifies the biochemical market according to the different chemical industry segments. In 2007, the sale of chemicals made from biobased raw materials in the chemical industry amounted to EUR 48 billion, which represents only a minor fraction (3.47%) of the total output produced (Festel 2010).
In 2007, the EU 27, North America including Canada, the USA and Mexico (NAFTA), and Asia dominated the market for biochemicals, accounting for more than 90% of total sales. All other countries (ROW = rest of the world) made up the remaining 10%. Active pharma ingredients, organic chemicals and cosmetics are of particular importance (Fig. 8.7).

The market for biochemicals (adapted from OECD 2011, p 52). Note: Biotechnology sales per segment 2007 in EUR billions; ROW = rest of the world
The EU is the major player in the biochemicals market. In 2013, around 6% of total chemical products can be considered as biobased. However, at EU member state level we see large differences. Denmark and Latvia reach shares of biochemicals of over 35%, while France, Germany and the Netherlands only of around 5%, and many of the newer member states of even less (Piotrowski et al. 2016). According to Hatti-Kaul et al. (2007), the EU average is estimated to increase to 20% in 2020. In the USA, the share of biochemicals in total chemicals sales is less than 4%. Asia is gradually increasing its market share.
The market for bioplastics dominates the category biomaterials and increased substantially in recent years. Bioplastics are plastics derived from renewable biomass sources, such as vegetable fats and oils, starches, cellulose, biopolymers and a variety of other materials. In 2013, 300 million tons of plastic are produced annually of which only 1% can be categorised as bioplastic (European Bioplastic 2016). However, due to the high rise in the demand for bioplastics, this market has the potential to boost its market share. Estimates indicate that the production of bioplastics could increase from 4.2 million tons in 2016 to approximately 6.1 million tons in 2021 (European Bioplastic 2016).
Figure 8.8 presents the market for bioplastics in 2016 which is clearly dominated by Asia (1.81 million tons) followed by Europe (1.13 million tons) and North America (0.97 million tons). The land used to grow the renewable feedstock for the production of bioplastics was about 0.68 million hectares in 2014, around 1% of the global agricultural land (European Bioplastic 2016). Within the bioplastics industry, bio-based Polyethylene Terephthalate (PET) and Polylactic Acid (PLA) are the leading biobased plastics products and grow faster than others. Baltus et al. 2013 state a production capacity of bio-based PET equal to around 5 million t per year in 2020. PLA is used mainly in packaging but it also has a large number of other durable applications. The world’s PLA production has doubled within the time period 2011–2015 to around 400,000 t per year and has been projected to increase even faster in the near future, by around 800,000 t per year in 2020 (Baltus et al. 2013). The company “Nature Works” from Thailand and the USA holds a PLA market share of almost 80% in 2011 (140,000 t from a total of 180,000 t per year), whereas the other producers have a current capacity varying between 1500 and 10,000 t per year (bioplastic Magazine 2012).

The market for bioplastics (European Bioplastic 2016). Note: Bioplastic Production in 2016 in million tons by region
Of the global agricultural land in 2008, 18% were allocated to food, 71% to animal feed, 4% to bioenergy and 7% to material use (Raschka and Carus 2012).
In this section, we have briefly introduced the recent developments on the markets for biobased products and how these developments are reflected in the demand for agricultural commodities, land use and prices. How does this additional demand for maize, sugar cane and vegetable oils (on top of food and feed demand) affect the market for agricultural commodities? To answer this question, we analyse supply and demand on the market for maize, exemplary for an input to the production of biobased products.
1.3 The Market for Biobased Resources and Products: Deriving Demand and Supply Curves
How supply and demand on a market interact and how they depend on and affect other markets is explained using a market diagram. Here, we are going to use the maize market as an example for introducing the market diagram due to its omnipresence in all areas of the bioeconomy, i.e. food, feed, biofuels, bioplastics as well as biochemicals. For a comprehensive introduction to theory of markets, the reader is referred to standard textbooks of microeconomics, e.g., Varian (2014). In the market diagram presented in Fig. 8.9a, the horizontal axis represents the quantity demanded, whereas the vertical axis represents the price. The demand curve (D) shown in black depicts the relationship between the price for maize and the quantity of maize consumers are willing and able to buy at each particular price where—according to the law of demand—the quantity demanded depends negatively on the price. This normal, negative demand reaction to price increases is the result of two separate effects: (1) If the maize price increases, the consumer can afford less quantity of maize at the given income and thus demands less. This is the income effect. (2) When the price of maize increases, the consumer will look for alternative products similarly satisfying the need and thus substitute some of the consumption of maize, for instance, with wheat. This is the substitution effect. Both effects will cause the consumer to buy less maize if its price increases, so that the total quantity of maize demanded will decrease. Usually, a demand curve in a market reflects the aggregate demand of all consumers in the market. In Fig. 8.9 we assume that consumer 1 (blue curve) represents the maize demand by food and feed producers, whereas consumer 2 (green curve) represents the maize demand by producers of for example biofuels and bioplastics. Both curves together add up to the total maize demand.

Supply and demand functions
If the price for maize increases, both consumers want to buy less of it. The strength of the consumers’ reaction to the price increase is measured by the price elasticity of demand.Footnote 1 A price elasticity of demand equal to one means that for example a 20% increase in the price for maize leads to a 20% decrease of the quantity demanded. A price elasticity of demand of less than one means the fall in demand is less than 20% and the demand curve is steeper and the demand is said to be less elastic. If the elasticity is greater than one, then the quantity demanded increases by more than 20% and the demand curve is flatter and the demand more elastic.
Figure 8.9b displays the supply side of the maize market in the same type of diagram. The supply curve (S) shown in black depicts the relationship between the price for maize and the quantity of maize producers in the country are willing and able to supply. Usually, supply is positively related to the price due to factors causing production costs to increase with increasing level of production output, depending on the particular product market. This is illustrated by two examples. Increasing the production of maize could be achieved, for example, by allocating additional land or using more fertilizer. Both would increase the production costs of a ton of maize: Commonly, all good quality, suitable land is already under productive use and thus the farmer would need to offer a higher land rental price than others to obtain additional land. Likewise, applying additional fertilizer increases the maize yield but the particular gain in yield per hectare for the next unit of fertilizer applied is the lower, the more fertilizer is already applied to the field (diminishing marginal productivity). Thus, the quantity of maize that can be profitably produced increases with the market price of maize and the quantity supplied to the market increases. The supply curve represents the aggregated supplies of all sellers, here supplier 1 and 2, just as the demand curve is the sum of the demand of all consumers.
This simple example of a market is general and equivalently applies to the demand and supply of any other market, such as those for sugar, fuels or bioplastics.
1.4 The Market for Biobased Resources and Products: Determining the Equilibrium Price and Quantity
In the previous section, we have graphically analysed the demand and supply curves using the example of maize. Now, we combine demand and supply curves in a market diagram to determine the equilibrium quantity and price at which a good is traded in the market.
Figure 8.10 represents the market by combining the supply and demand curves in a single diagram. The market equilibrium (E) is the point at which the demand and supply curves intersect. This point defines the market price (equilibrium price) at which the quantity supplied on the market equals the quantity demanded, thus the price at which the market is cleared. Usually, the market price automatically settles in the equilibrium due to the interactions between consumers and producers. Let’s consider again our maize example. Suppose that in the initial situation the market price for maize is higher than the equilibrium price. At this price, the quantity supplied is larger than the quantity demanded (excess supply or surplus). As a result, not all suppliers are able to sell their maize at the current price and they reduce their prices. At a lower price, consumers demand more maize and producers supply less. This process of lowering the price of maize and the corresponding reactions of buyers and sellers will continue until the quantity of maize supplied equals the quantity demanded, equivalent to movements along the demand and supply curves, respectively, towards the equilibrium point.

The equilibrium of supply and demand
Besides the market price, there are other factors which determine the quantities supplied and demanded, respectively. We can observe movements along the demand curve and shifts of the demand curve. Continuing the example, if the price for maize decreases, the result is an increase in the quantity demanded which is equivalent to a movement along the demand curve. Similarly, the price decrease declines the quantity of maize supplied and is equivalent to a movement along the supply curve. By contrast, an increase (decrease) of the quantity demanded at a given price reflects a shift of the curve to the right (left) and analogously for the quantity supplied. What are causes for such shifts of the demand and supply curves?
Let us start with the demand side. Usual factors that lead to a shift of the demand curve are: changes in the price of goods related to the observed good, income changes, changes of tastes and preferences and changes in expectations. In our maize example, concerns about the climate impacts of fossil oil-based industries increase the demand for biofuels. This results in a shift of the demand curve for biofuels to the right and consequently also in a shift to the right of the demand curve for the biofuel feedstock maize (change in preferences). Conversely, a decrease in the fossil oil price would lead to a decrease in biofuel demand and thus also decreases the demand for maize shifting the demand curve to the left (change in the price of a good related to biofuels).
From an economic perspective, biofuels are a substitute for fossil oil. Products are called substitutes, if an increase in the price of one commodity (fossil oil) leads to an increase in the demand for the other commodity (biofuels). However, in other cases an increase in the price of one commodity would lead to a decrease in the demand of another commodity, e.g. fossil oil and cars. Such products are called complements.
How are the equilibrium price and quantity on a market affected by a price increase of a related product?
Figure 8.11 presents the effects of a rise in the oil price on the market for biofuels (Fig. 8.11a) and on the market for the biofuel input maize (Fig. 8.11b). Due to the increase in the fossil oil price, the market price for fuels also increases so that biofuels become relatively cheaper and demand for biofuels increases at every price, indicated by the demand curve shift to the right (D1 → D2). At the old price (P1) demand exceeds now supply. This excess demand induces suppliers of biofuels to raise the price. Consequently, the increased oil price raises the equilibrium price for biofuels (P1 → P2) and the equilibrium quantity of biofuels sold (Q1 → Q2).

Supply and demand effects on the resource market
An increase of the equilibrium biofuel quantity in diagram (a) raises the demand for its inputs such as maize. This is shown in diagram (b). At every price, the demand for maize is increased as represented by a shift of the demand curve to the right (D1 → D2). This results in an increase of the equilibrium price and quantity for maize, which in turn affects biofuel producers.
Shifts of the supply curve are usually caused by changes in input prices, technological changes or changes in expectations. For the production of biofuels several inputs are required, among them maize. If the price of maize increases as described in Fig. 8.11b, this increases the input costs of biofuel production and therefore leads to a reduction of biofuel quantity supplied at every price, as represented by a shift of the supply curve to the left (Fig. 8.12a), Whereas technological progress decreases the production costs of biofuels and shifts the supply curve to the right. If biofuel producers expect a further increase in oil prices and therefore decide to expand the biofuel production, the supply curve shifts to the right.

Supply and demand effects on the market for biobased products
Effects on the supply of inputs that cause increased input prices are for example a drought that leads to a reduced maize harvest, an increase in the rental price for land, and an increase in fertilizer prices (effects shown in Fig. 8.12b). The effects of increased input costs are shown in Fig. 8.12a. The reduced supply of biofuels leads to an increase in the equilibrium price and a reduction of the equilibrium quantity.
When analysing the effects on the market for biobased products and resources, we also need to consider the effects on factor markets, e.g. land. In the real world, we have to cope with limited land supply. The options for gaining additional land area for farming via for example deforestation or polder landscape are limited. In addition, desertification and soil erosion cause loss of land. Therefore, an increase in the demand and supply of biobased products and consequently an increase in the amount of crops produced for the biobased market are only possible by a reallocating land from the production of food to the production of biobased resources. This increase in the demand for land leads to an increase in the price of land, which increases input costs and thus makes production of biobased products less cost efficient.
So far, we treated the markets for fossil oil, agricultural raw materials and biobased products in the same way. However, as stated in the introduction, most of the biobased products are relatively new so that the corresponding production processes often need substantial further research and development before the products eventually might become competitive with their established non-biobased substitutes. Figure 8.13 shows the average cost curves for fossil fuel and biofuel production. Currently, Q1 litres of fossil fuel are sold on the market at price P1. At this price, the average cost curve for biofuels lies below the average cost curve for fossil fuel implying that biofuels potentially could be sold cheaper. However, the fossil fuel industry got established first and is able to sell fuels at price P1, which is below the start-up cost of C0 of the biofuel industry. Due to the current lack of experience and market share to gain from economies of scale, the biofuel industry cannot compete on the market, due to its higher production costs. This provides a reason for temporary support of the biofuel industry through the government—often referred to as the infant industry argument. Through the support (or protection) of the biofuel industry at its initial development stages, the industry can develop and reduce its production costs through the development of new technologies and economies of scale so that it might be able to compete with the fossil fuel industry in the future. Another argument for government support of the biofuels sector could be made due to the additional environmental costs fossil fuels cause and which are not included in their price. This will be discussed in a later chapter under the concept of externalities (see Chap. 10).

Developing markets and the infant industry argument
1.5 Policy Instruments to Support Biobased Products
In the previous sections, we have introduced the drivers of and barriers to the demand and supply of biobased products. Objectives such as sustainable development, energy security, independence from fossil fuels, food security, waste reduction and climate change mitigation require an increase in the production and the use of biobased products. However, the only recently developed biobased products have a disadvantage in the market due to their particularly high production costs compared to products already established in the market (see Fig. 8.13). Conventional products based on fossil energy sources (e.g. crude oil, natural gas or coal) have an advantage over renewable fuels/energy, because they have gained from economies of scale due to mass production and learning effects which have decreased their production costs over time. However, the use of these products is associated with high carbon dioxide and GHG emissions that lead to additional cost for society, e.g. through increasing occurrences of severe weather events, melting ice caps and increasing air pollution. These external costs, equal to the value of agricultural production losses, health costs, costs of destruction through storms and flooding, and the like, are not covered by the market price of these products, leading to an inefficient allocation of resources, i.e. a market failure.
In light of the reasons pushing the development of biobased products listed in the introduction to this chapter, governments aim to correct the market failures associated with the use of fossil energy sources and to provide an enabling environment for renewable alternatives which should allow these industries to mature and become competitive. To this end, governments introduce various policy instruments that aim to promote the development of biobased products by enabling the development of better technologies, to increase the production quantity and thus the market share, and to discourage the use of fossil fuels (see Chap. 10). Technological progress and economies of scale would then lead to a decrease in production costs and consequently increase the competitiveness of biobased products.
The comparison of the policy landscape of different biobased products clearly reveals that the policies implemented to support bioenergy and liquid biofuels are the most advanced. Biochemicals and biomaterials are found to be at a relative disadvantage, because many of the policies applied to support biofuel and bioenergy production reward the use of biomass in these industries. According to the Renewable Energy Policy Network for the twenty-first century (REN21), nearly all countries worldwide (146 countries) apply policies to support the provision of renewable energies (REN21 2016). Most of them established bioenergy targets. In general, countries use manifold ways and policies to support biofuel production, e.g. establishing targets for the share of bioenergy in total energy use (more than 70 countries), applying policy instruments to support the production of biofuels (more than 100 countries), and imposing policy instruments which improve market access (more than 50 countries) (OECD 2014).
A large number of policy instruments have been applied to stimulate bioenergy and biofuel production. In this section, we provide a general but brief overview of applied instruments to support biobased products, particularly used for bioenergy and biofuels, and explain their economic rationale using the example of energy and carbon taxes.
Different instrument types are applied to support biobased products. One distinction can be made between direct policy instruments, e.g. tariffs and subsidies on different (biobased) products either domestically produced or traded, and indirect policy instruments, e.g. environmental taxes (carbon tax) or voluntary agreements. Direct policy instruments can either be provided to support renewable products, e.g. a subsidy on the production of biobased products or a subsidy on agricultural products, such as maize, sugar or grains, to enhance the production of biomass or a tariff on the imports of biobased products to support domestic producers. Governments provide subsidies across the entire biomass value chain to facilitate suitable conditions for biobased product deployment. By contrast, indirect policies are mainly applied to fossil-based products by taxing these products to account for their negative external effects on the environment. This will be further explained instantly. All of these policies are price-driven, e.g. in the case of a subsidy on biobased products, the policy drives a wedge between the market price and producer price, so that the producers achieve a price higher than the market price. Feed-in tariffs serve as another example for creating price-driven incentives that are often applied in the renewable energy market. Producers of renewable energy can feed-in the full production of green electricity at fixed prices. This policy provides specific support to producers of renewable energies for a defined period. Specifically, the producer price for renewable energies equals the market price for energy plus the feed-in tariff rate, so that producers of renewable energies are paid a cost-based price for their energy supply that exceeds the fossil energy source-based price. Governments also promote the use of biobased products, particularly biofuels, through excise tax reductions or exemptions that decrease the price paid by consumers.
Box 8.1 Energy and Carbon Taxes
Energy and carbon taxes are imposed to restrain the production of for example energy from fossil fuels and enhance the production of biofuels. This simple instrument provides product group specific taxes and aims to correct a market failure by charging a price for GHG emissions, e.g. fossil fuel production is taxed due to the high GHG emissions of its use.
What is the underlying economic rationale behind a policy instrument such as energy and carbon taxes impose additional costs on the use of fossil energy sources such as oil, natural gas and coal in proportion to the amount of carbon these resources contain. These additional costs to the use of fossil energy sources is passed through to the price of the final good such as fuels, electricity or any goods that use these sources intensively. The policy instrument corrects the market failure by incorporating these additional environmental costs into the market price, thereby modifying the incentives for producers and consumers such that the quantity produced and consumed is decreased.
Figure 8.14 presents the effects of energy and carbon taxes and shows how these policy instruments stimulate the production of biofuels. Let us assume that all energy products based on fossil fuels are taxed by an ad valorem tax t that drives a wedge between the market price P M and the producer price P S equivalent to the size of the tax.

Effects of a carbon tax on fossil fuel
For each quantity of energy from fossil fuels sold on the market producers have to pay the tax. Consequently, they receive less per unit of output and reduce their supply on the market, which in turn leads to a market price increase.
In Fig. 8.14 we analyse the effects of energy carbon taxes on the fuel market considering both the supply of fossil fuel and biofuel. \( {S}_{\mathrm{TF}}^1 \) represents the total supply of fossil fuels and biofuels together (\( {S}_{\mathrm{FF}}^1+{S}_{\mathrm{BF}}={S}_{\mathrm{TF}}^1 \)), whereas D TF shows the total demand on the fuel market. The supply curve is upward-sloping indicating that the supply of fuel increases as the market price increases. The demand curve is downward-sloping showing that a price increase leads to a decrease in fuel demand. In the equilibrium (intersection of \( {S}_{\mathrm{TF}}^1 \) and D TF) at the market price P M the quantity \( {Q}_{\mathrm{TF}}^1 \) is sold on the market of which \( {Q}_{\mathrm{FF}}^1 \) are fossil fuels and \( {Q}_{\mathrm{BF}}^1 \) are biofuels. What happens when the government decides to impose an energy and carbon tax? This tax affects the fossil fuel producers, because they pay now a tax per unit of output based on fossil fuels, therefore, the supply curve of fossil fuels shifts to the left in the panel (a) of Fig. 8.14 reflecting that at every price producers sell less fossil fuel due to the tax. However, the tax does not directly affect biofuel producers. Consequently, the biofuel supply curve in panel (b) of Fig. 8.14 does not change. In accordance with the change in panel (a), the total fuel supply curve in panel (c) also shifts to the left (\( {S}_{\mathrm{TF}}^2 \)). At any market price for fuel less quantity is supplied. The new market equilibrium reveals a decrease in the quantity of fuels supplied and demanded at a higher price. However, at this higher price biofuel producer sell a higher quantity of biofuels at the market so that the share of biofuel relative to fossil fuel quantity has increased due to the implementation of carbon taxes.
After this excursus on the economic rationale of a price-driven policy, we now briefly introduce other types of policies also often imposed in the markets for bioenergy and biofuels. Examples for quantity-driven policies are, e.g. blending mandates that define a specific share of biofuels in transport fuel sold on the market. This policy is relatively cost neutral for the government, however, it increases the demand for biofuels at the expenses of the final consumer due to higher production costs of biofuels. Also (tradable) green certificates provide quantity-driven incentives to increase the production of biobased products. They are based on a quota-like-mechanism that obliges producers to produce a specified fraction of their supply from renewable resources. These instruments are successfully applied to support bioenergy, e.g. low carbon energy.
In addition to price- or quantity-driven policy instruments, governments provide other budgetary support measures such as investment subsidies and new technology support. These subsidies are available in a large variety of different designs. Examples are funding for capital investments associated with a new project, or subsidised loans/interest rates or grants for production facilities. The objective is to increase the efficiency of biomass use for the production of biobased products to increase supply and reduce production costs. Other measures are support provided to research or rural development.
Why is the amount of support provided to biofuels much higher than the amount provided to biochemicals and biomaterials? According to OECD (2014) the share of crude oil used for energy production exceeds 90% in most of the countries. In addition, simpler and a smaller number of standards is applied to biofuels compared to biochemicals. Consequently, controls on the chemicals market are much higher which increases the number of obstacles that need to be overcome by new products to enter the market. Plastic is a material used for a large variety of purposes, which in return increases the number of expectations on the properties of plastics compared to fuel (OECD 2014). This large variety with regard to standards, applications and expectations aggravates the design and implementation of policy instruments to support biochemicals and biomaterials. By contrast, the development of all three product groups depends on the same resource (biomass) and related technologies. Crude oil prices determine their competitiveness in the market and there are beneficial effects from sharing production facilities.
1.6 Conclusions
This chapter provides a brief introduction to the market of biobased products that might become increasingly important in the future. The future global challenges lead to an increasing demand and supply of biobased products. In addition, this market is highly interlinked with the demand and supply of primary agricultural commodities and thus food security. We introduce market diagrams representing the demand and supply functions for biobased products to show how the equilibrium price on the market is determined. We apply these diagrams to show the effects of supply and demand side shocks on the market for biobased products, but also on the market for agricultural commodities and fossil fuels. The particularly high production costs of the relatively new developed biobased products compared to conventional products already established in the market, which are often based on fossil fuels, create a disadvantage for biobased products. In addition, the prices for conventional products do not include the additional environmental costs they create due to for example high carbon emissions, and thus lead to a market failure corresponding to an inefficient allocation of resources. Politicians use these two arguments as major justifications for implementing policies to support biobased products. We provide a brief overview of selected policy instruments and explained the effects of carbon taxes on prices, and demand and supply on the market for biofuels using a graphical market model.
Review Questions
-
1.
Name and discuss reasons why the production of biobased products has gained importance in recent years?
-
2.
Explain how high crude oil prices influence the demand for biofuels?
-
3.
What are the challenges on the market for biobased products?
-
a.
Explain driving and limiting forces for the supply of biobased products using 1 example for each.
-
b.
Explain driving and limiting forces for the demand of biobased products using 1 example for each.
-
a.
-
4.
The demand for bioplastics is expected to considerably increase in the future.
-
a.
How would this increase in the demand for bioplastics affect the market price and quantity sold of bioplastic material? Please use a market diagram to illustrate and explain the results.
-
b.
In addition, the government aims to support the production of bioplastics. Please explain and discuss appropriate policy instruments the politicians might introduce.
-
a.
-
5.
Assume that the bioplastics industry is able to considerably decrease their costs for producing bioplastics due to technological change.
-
a.
How would this affect the supply of bioplastics? Please use a market diagram to show and explain the effects.
-
b.
Bioplastics are produced from starch. How would therefore an increase in the production of bioplastics affect the market for wheat, maize and potatoes? Is there empirical evidence for the effect?
-
c.
What would be potential effects on prices and supply of food products and thus food security?
-
a.
-
6.
Governments often use the infant industry argument to justify the introduction of policy instruments to support relatively new industries such as biofuel producers. Please explain and discuss this argument using biofuels as an example.
-
7.
Please use a graph similar to the initial situation in Fig. 8.14 as starting point. Assume that the government starts to pay a specified amount of euros to the producer for each ton of biofuel produced (a subsidy).
-
a.
How does this output subsidy for biofuels affect the market equilibrium of biofuels (producer price, market price, quantity)?
-
b.
What are the effects on the total fuel market (equilibrium price and quantity)?
-
a.
2 Sustainable Development and Sustainability Management
Abstract
In the last decade(s), the idea of sustainable development has become a widely acknowledged topic which is supported by many actors in modern society.
Companies, as central economic players, are increasingly pressured by a wide set of stakeholders to engage in sustainability management and to contribute their share towards sustainability. Against this background, this chapter first introduces the general idea of sustainable development with its elements of intragenerational and intergenerational justice and illustrates the roots of sustainable development as a normative-anthropocentric concept. Since sustainability is a contested idea with many different notions, the different understandings of weak, strong and quasi-sustainability are introduced and the status quo of sustainability in society is highlighted.
Following this general introduction, actors of sustainability in society are named and the relevance of sustainability management for companies is discussed. In the remainder of this chapter, three base strategies to achieve sustainability (i.e. eco-efficiency, eco-effectiveness and sufficiency) are explained along with their opportunities and limitations in achieving sustainability. Finally, some exemplary elements and tools of sustainability management from the areas of sustainability accounting and management control as well as of sustainable supply chain management are introduced to provide a first glimpse of possibilities for companies to engage with sustainability.
Keywords
Sustainability; SDGs; Stakeholder; Eco-efficiency; Eco-effectiveness; Sufficiency

Agrophotovoltaic plant in combination with potato production © Andrea Ehmann
Learning Objectives
After studying this chapter, you will be able to:
-
Characterise sustainable development with its various conceptual elements and understandings.
-
Discuss the main actors of sustainability management and their influence on corporate sustainability.
-
Distinguish eco-efficiency, eco-effectiveness and sufficiency as base strategies in sustainability management and highlight their potential and limitations.
-
Exemplarily illustrate elements of sustainability management.
2.1 Sustainable Development: Characterisation and Historical Roots
“Sustainable development is development that meets the needs of the present without compromising the ability of future generations to meet their own needs” (WCED 1987, p. 41). This probably most widely cited characterisation of sustainable development stems from the 1987 report of the United Nations World Commission on Environment and Development (WCED; also called Brundtland report after the chairperson of the commission, then Norwegian Prime Minister Gro Harlem Brundtland).
This broad characterization covers the two main pillars upon which sustainable development rests: Intragenerational and intergenerational justice. Meeting the needs of the present (i.e. within today’s generation) verbalizes the idea of intragenerational justice and was already at the centre of thinking in the WCED report despite often being less prevalent in many discussions around sustainable development. In fact, the report highlights the overriding priority for needs of the poor and gives a voice to the large group of unprivileged poor in the world. Fulfilling these needs, for example, in terms of providing enough food, safe drinking water, sanitation, or minimum social security is thus a cornerstone without which sustainable development cannot be achieved. At the same time, the concept of sustainable development gives future generations a voice through the idea of intergenerational justice, which calls for preserving societal and ecological systems in a way that future generations are not inhibited in their own development.
This latter perspective, which mainly focuses on natural sources and sinks, is also included in the historical roots of sustainable development, which trace back to the times of medieval forestry. Already here, central aspects of a sustainable resource utilisation (i.e. permitting only as much logging as could be grown again) were known and practiced. Both elements of justice illustrate that sustainable development is a normative (i.e. relating to an ideal standard or model) and anthropocentric (i.e. relating to the influence of human beings on nature) concept. As such, it is widely acknowledged but still contested and there is no rule of nature that determines whether or not mankind has to adhere to the principles of sustainable development, but it is instead an ethical decision (see for example Hahn 2009, 2011).
Box 8.2 Intragenerational and Intergenerational Justice and the Role of the Bioeconomy
Some products and activities from the bioeconomy sector provide a good perspective on why intragenerational and intergenerational justice are sometimes difficult to align and why achieving sustainability is such a complex task. Take the example of biofuels or bioplastics made from renewable energy sources such as plant material. From an intergenerational perspective, such products are favourable because they potentially allow for carbon-neutral products, which have no or at least less impact on climate change compared to conventional fuel sources or plastics. However, the production of the renewable agricultural raw material for the biobased products might lead to a crowding out of staple crops on limited cultivable surfaces. This could have detrimental effects on intragenerational justice if food prices increase or if, in extreme cases, food supply is limited (also known as food vs. fuel debate; see, for example, Kuchler and Linnér 2012).
But when would sustainable development be achieved? Despite providing some general yardsticks for orientation, the above-cited characterisation still allows for different interpretations and some even note that sustainable development is a journey that will never be finished. For others, however, sustainable development is easier to achieve. This is especially the case when following an interpretation of sustainable development known as “weak sustainability” (for overviews of the different concepts see Sect. 10.2; Ayres 2007; Hediger 1999; Neumayer 2013). In this perception, sustainability is achieved if the total sum of anthropogenic (i.e. man-made) capital and natural capital are held constant. This bears the main assumption that natural capital can generally be substituted by anthropogenic capital and still ensure the continuation of human well-being on earth. Main strategies to achieve sustainability under this assumption are a focus on efficiency (i.e. achieving the same output with less input or more output with the same input) and consistency (i.e. entirely closed systems with no input of raw materials and no emissions and waste production) through technology, growth, and markets. The drawback of this notion of sustainability is, however, that a full substitutability of natural with man-made capital is likely to be impossible due to technical limitations and laws of nature. Once all non-renewable resources as well as the Earth’s biodiversity and biocapacity are depleted, it is unlikely by all known standards that mankind can still survive at the same level of prosperity as before, if at all.
The counterpart to weak sustainability is “strong sustainability” (see Sect. 10.2). The general idea of this perception of sustainability is to live only from the “interest” of the natural capital, that is, to use only those natural goods and services that are continuously added. It would thus not be permitted to use non-renewable resources (because they are not reproduced and hence generate no “interest”) and renewable resources can only be utilised below their regeneration capacity. If followed through, this would mean renouncing any further growth of consumption and production due to the status quo of intergenerational justice as further depicted below. To walk this path, society would need to aim at sufficiency (i.e. asking how much is enough) and efficiency at the individual and political level. The drawback of this notion of sustainability is that is has a rather metaphorical character. A complete abdication of any growth is unlikely and would also mean that intragenerational justice could only be achieved through a very drastic (and thus unrealistic) redistribution of worldwide wealth.
Weak, Strong, and Quasi/Critical/Ecological Sustainability
These are different understandings of sustainability, which lead to fundamentally different implications for actions and strategies.
The middle ground between the two extremes is occupied by the idea of “quasi”, “critical”, or “ecological” sustainability. It builds upon the principle of prudence and puts critical levels or critical boundaries, for example, of the Earth systems into the middle of thinking (for an explanation of such critical boundaries see, for example, Steffen et al. 2015). Such thresholds should not be exceeded and, for example, a substitution of natural capital by man-made capital has to be well justified. To achieve this, a mixture of the three strategies might be needed but the technological feasibility and the socio-political enforceability of these strategies is uncertain.
2.2 Status Quo of Sustainable Development
When looking at the current state of the world, it seems to be safe to say that neither intragenerational nor intergenerational justice have been achieved despite some scientific debates and uncertainties on specific issues. Although the last 25 years have seen some progress, today still more than 830 million people live in extreme poverty (earning less than US$1.25 per day), 6 million children under the age of five die annually, 2.4 billion people have no access to improved sanitation and almost 800 million people are illiterate (United Nations Human Development Programme 2015), while at the same time less than 10% of the world’s population accumulate almost 85% of total wealth (Stierli et al. 2015). Looking at rich versus poor countries, people living in high-income countries use roughly six times more natural resources than those living in low-income countries (WWF International 2016). This directly links to the perspective of coming generations. Today’s human population uses almost double the amount of the world’s available biocapacity, thus already at present living at the expense of future generations. In their seminal study, Steffen et al. (2015) identified seven planetary boundaries which, if crossed, bear a high risk of destabilising the Earth system. Of these seven boundaries, two (biosphere integrity and biochemical flows) have certainly already been exceeded according to scientific standards and two others (climate change and land-system change) are marked with an increasing risk so that the need to act is urgent if sustainable development is a favoured goal.
Eventually, however, the concepts of intragenerational and intergenerational justice need to be broken down into actionable pathways and concrete fields of action, no matter what perception of sustainability one follows. Therefore, in 2015 the United Nations proposed a set of seventeen aspirational “Sustainable Development Goals (SDGs)” with 169 sub-targets as depicted in Fig. 8.15. The SDGs are supposed to influence and provide guidance not only to worldwide politics but also to businesses and individuals in their actions to serve the idea of sustainable development.

The sustainable development goals (Maria Gershuni; CC BY-SA 4.0 via https://commons.wikimedia.org)
Another often-mentioned reference to reduce complexity is the so-called “IPAT-Equation” (e.g. Meadows et al. 2004, pp. 124–126), which illustrates the human impact on ecological ecosystems. The “Impact” refers to the ecological footprint of any population or nation upon the planet’s sources and sinks. “Population” counts the number of people influencing the ecological footprint. “Affluence” is determined by the impact or throughput generated by the material, energy, and emissions associated with consumption. “Technology” illustrates the damage caused by the particular technologies chosen to support that affluence (i.e. the energy needed to make and deliver material flows, multiplied by the environmental impact per unit of energy). Changes in any factor of the equation lead to changes in the ecological footprint we leave on the Earth system.
IPAT-Equation
It illustrates the human impact on Earth systems through the term: Impact = Population × Affluence × Technology.
2.3 Actors and Understandings of Sustainability Management
To steer the world society in the direction of sustainable development and to promote the SDGs, multiple actors need to play along (see Fig. 8.16). Politicians need to recognise the need to embed sustainability goals and principles into rules and regulations at different levels, consumers need to recognise how their behaviour adds up and contributes to or hinders sustainability, civil society organizations need to recognise their influence on other players and advocate different elements of sustainability, and of course companies, as central and powerful players in modern society, need to contribute their share by means of various elements of sustainability management either through reducing their environmental and social footprint or through actively and positively contributing to sustainable development with sustainability-oriented business models, goods, and services.

Elements and actors of sustainable development and sustainability management
To make a company more sustainable (or less unsustainable), the management needs to balance a multitude of interests and bring in line various actors (see Fig. 8.16). Certain types of investors or stockholders, for example, might pressure a company to actively pursue the idea of sustainability while others fear that measures of sustainability management are costly and could thus reduce their earnings. Many potential employees nowadays are increasingly demanding when it comes to the social responsibility of their future employer and at the same time many people still do not see the need to change their own behaviour and, for example, do not switch off the computer monitor when leaving the office. Customers often claim to value sustainability and the market for organic and fair-trade products is constantly growing around the world but the willingness to pay a higher price for fair and sustainable products is still often limited. Supply chains and networks of most goods and services are extremely complex and easily cover thousands of suppliers, which makes it difficult for companies to monitor the sustainability performance, while at the same time many pressure groups actively advocate better working conditions and environmental standards. In sum, the management of sustainability is a complex endeavour.
Stakeholder
“Any group or individual who can affect or are affected by the achievement of the firm’s objectives” (Freeman 1984, p. 25). This encompasses internal (e.g. employees, management and owners/stockholders) and external stakeholders (e.g. suppliers, government, customers, creditors and society).
But why then should a company embrace the idea of sustainable development at all? First, it is the pressure of many different stakeholder groups, for example regulators, governments, or sustainability-oriented activists who demand a responsible business conduct and who lobby for sustainability management. Second, a growing sustainability-consciousness among consumers and businesses as well as changing regulations produce new market opportunities in this area and companies with a distinct sustainability profile might also reap reputation benefits. Third, sustainability management can lead to reduced costs when, for example, more resource- or energy-efficient products and processes lead to material or energy savings. Fourth, some consider sustainability management to also be part of an active risk management, because many of the most pressing risks companies face are connected to sustainability issues (e.g. reputation risks in (un)sustainable supply chains, raw material shortages or price volatilities, natural catastrophes and extreme weather events, social instability).
However, beyond such examples of a business case for sustainability management (i.e. beyond win-win paradigms in which sustainable management is good for the financial bottom line of a company), there are also numerous tensions and trade-offs companies have to cope with (Hahn et al. 2015b). For example, various measures in sustainability management require substantial upfront investments, which may put pressure on short-term financial objectives and benefits of sustainability management are sometimes hard to measure so that a (financial) quantification is not always straightforward. Another example from the area of the bioeconomy illustrates such dilemmas on a larger scale. Individual organizations usually strive for efficiency and they are likely to adopt similar solutions when acting under similar external conditions (e.g. monocultures as efficient means of cultivating agricultural produce). Such a homogenization, however, could lead to a lower resilience of the entire agricultural system due to a loss of (bio)diversity. Society is called to recognise such trade-offs and tensions and develop solutions to cope with such difficulties (see again Hahn et al. 2015b, for initial suggestions).
As can be seen from these remarks, sustainability management is a task with a myriad of potential fields of action, not all of which are relevant for each and every company in the same way. To make the elusive concepts of intragenerational and intergenerational justice within sustainable development more comprehensible and manageable at the company level, the concept is often broken down into three distinct pillars of action in which companies present their actions: economic, ecological, and social responsibility (e.g. Elkington 1997), sometimes also termed the 3P of people, planet and profit. In the corporate domain, the economic pillar (“profit”) is usually understood as the responsibility of a company to generate profits to be sustainable in an economic sense. Furthermore, aspects such as economic prosperity and development are also often mentioned. In the ecological pillar (“planet”), topics such as environmental protection and resource preservation and respective corporate actions to achieve these goals are discussed. The social dimension (“people”) covers topics such as social justice and equal opportunity and is often connected to employees and suppliers with issues such as fair compensation, diversity, labour conditions, work–life balance and so on. This also shows that the distinction of previously often separately covered topics such as sustainability and corporate social responsibility (CSR) is in fact very blurred. Nowadays, some companies have a CSR department or CSR manager while others have a sustainability officer, both of which often cover similar tasks and also in academia the concepts and terms are increasingly used interchangeably (see, e.g. Hahn 2011).
2.4 Base Strategies in Sustainability Management
As illustrated in the beginning, the road to sustainability can only be successfully taken if intragenerational and intergenerational justice are pursued simultaneously. This implies that we need to decouple the human development on the one hand from the ecological impact caused and the consumption of resources on the other hand. To achieve such a decoupling, three basic sustainability strategies are often discussed: eco-efficiency, eco-effectiveness/consistency and sufficiency (for an overview see, e.g. Hahn 2008).
Eco-efficiency
The general approach of eco-efficiency is to aim at a more efficient use of natural resources or of emissions caused in producing goods or services. It thus follows the idea of relative improvements through the quantitative reduction of resource usage and emissions of products “from cradle to grave” (i.e. from raw material extraction at the beginning of a product life cycle to the final disposal at the end of the cycle). With successful examples of eco-efficiency, less resources or emissions are needed to produce the same amount of goods and services compared to a previous status quo (i.e. easing the environmental burden for a constant level of consumption) or more goods and services can be produced with the same amount of resources and emissions (i.e. enabling development without further deteriorating the environment). This strategy mainly aims at technological solutions and innovations either at the product level (i.e. more energy-efficient electrical household consumer devices, fuel-efficient cars etc.) or already in the production stage (i.e. more resource or energy efficient processes) and there are numerous examples of successful eco-efficiency innovations. Different academics point to the enormous potential of eco-efficient products and processes which could lead to an improved efficiency of resource and energy consumption of up to factor 4 or 10 (Schmidt-Bleek 1998; Weizsäcker et al. 1996). The strategy is comparably easy to translate into the corporate domain because companies already regularly aim at an efficient use of various (especially financial) resources and technological innovations are an established means of progress in many firms. However, the success of the eco-efficiency strategy (as well as the success of the other strategies discussed below) is limited by the so-called rebound effect (for an overview see for example Figge et al. 2014; Hahn 2008). This effect illustrates that an improved eco-efficiency is often counteracted by increased consumption. The improved efficiency often, for example, leads to cost savings, which in turn lead to a disproportionate growth in overall demand for goods and services, if the reduced costs are associated with lower prices. The same pattern might occur in a psychological dimension when, for example, improved eco-efficiency can induce people to buy more products or buy products that they do not need just because they are supposedly eco-friendlier than before. Furthermore, the introduction of a partly sustainable product or process might have negative impacts on other aspects of sustainability, which have not been considered before. The automotive industry, for example, increasingly substitutes metal with lightweight synthetic and composite materials to help improve fuel efficiency. However, such materials can cause problems during the production and disposal processes (e.g. if their production requires hazardous substances and/or if they are difficult to disassemble for recycling).
Eco-effectiveness
Other than eco-efficiency, eco-effectiveness (or consistency) tries to decouple economic development from environmental burden by organising economic processes entirely without waste, emissions, or other environmental impacts through closed-loop systems. It thus aims for a qualitative change of material flows by way of fundamental structural change (e.g. Braungart et al. 2007; Huber 2000; McDonough and Braungart 2002). The idea of the “cradle-to-cradle” thinking of eco-effectiveness is the abdication of using (finite) natural resources and/or of generating waste by creating non-polluting production and consumption processes in which each end-product of a consumption or production process serves as a basis for other processes. Closed-loop systems can come either in form of biological loops or of technological loops (Ellen MacArthur Foundation 2013). Biological loops are closely related to processes in the bioeconomy. Biological materials are farmed, processed to goods, which are then used or consumed and finally end up in the biosphere again as biological waste products. Examples are compostable clothing, houses made from organic building materials etc. In technological loops, recyclability of materials is ideally already included in the design phase of products, which then, for example, allow for easy disassembling or maintenance and refurbishment. Following the use phase, products are disassembled and either used as parts again in new products or materials are recycled to be used in new production processes. If it is feasible to develop and implement such kinds of sustainable innovations, they provide the opportunity to fully decouple growth and development from environmental impact by aligning nature and technology. However, such closed biological or technological loops usually require some fundamental changes in terms of extensive technological innovations and organizational transformations usually beyond the boundaries of a single company, which are not easy to find or implement. Furthermore, critiques describe rebound effects also for the eco-effectiveness strategy especially in the form of growth effects and psychological effects (see again above). Furthermore, uncertainties about the future side effects of innovations are another obstacle. Since innovations are, by definition, the introduction of something new, their ecological, economic, and social impacts cannot be entirely assessed ex ante.
Sufficiency
While eco-efficiency and eco-effectiveness are mainly driven by (technological) innovations, sufficiency is a behaviour-based concept which seeks an appropriate level and forms of consumption (e.g. Bocken and Short 2016; Schneidewind et al. 2012). A sustainable lifestyle following this strategy reduces the absolute amount of consumption and/or changes consumption in a qualitative way, both leading to absolute resource savings. Sufficiency in terms of a quantitative reduction of consumption requires a downgrading of individual aspiration levels and consequently also of the accumulated macro-economic intensity of resource utilisation especially in developed countries with their resource-intensive lifestyle. Sufficiency in terms of a qualitative change of consumption patterns seeks a flexible adjustment of needs and/or a substitution of non-sustainable by sustainable (or at least less harmful) forms of consumption. Examples include reuse of products and relying on services instead of owning products (e.g. through new business models in the so-called sharing economy), longevity of consumer goods, moderated mobility (e.g. regional holidays rather than air travel abroad), or an increased regional perspective (e.g. in supply chains or for food products). The direct impact of successful sufficiency efforts can relieve environmental pressures in a similar way to the eco-efficiency approach. In contrast to the unpredictable outcomes of technology-based innovations, sufficiency measures may achieve reliable and measurable outcomes. Problems with the implementation of sufficiency measures, however, arise when unsustainable consumption patterns are deeply anchored in the consumer’s mind and also in businesses’ mind-sets. Finally, there might again be the issue of rebound effects if the achieved savings from reduced consumption in one area lead to additional consumption in other areas.
Sharing Economy (also Collaborative Consumption, Peer Economy etc.)
Economic and social activities that deviate from individual, linear consumption patterns. Builds upon an effective management of repeated shared use of used, common, or idle resources as opposed to acquiring new resources for private use and final disposal (e.g. Roos and Hahn 2017).
Given the different opportunities and obstacles of the three basic strategies, it seems that an isolated pursuit of these approaches offers only limited chances of success so that a combination of strategies might be needed depending on the respective products, production and consumption patterns, cultural contexts, and so on.
2.5 Exemplary Elements of Sustainability Management
Due to the diverse nature of topics discussed in the broader context of sustainable development, corporate sustainability management is vast and crosses all functional areas of businesses. Aspects of corporate sustainability can nowadays be found in areas such as sustainability marketing, sustainable finance, sustainability accounting and management control, sustainable human resource management, sustainable operations, sustainable supply chain management, sustainable innovation management and so on. In the following section, the areas of sustainable accounting and control and of sustainable supply chain management will be briefly introduced and exemplary management tools and approaches are highlighted to provide a first glimpse of possible courses of action for companies.
Sustainability accounting and management control deals with instruments and systems that internally provide the management of a company with the means to make decisions which enable a (more) sustainable business conduct (sustainable management control) and externally provides interested stakeholders with information about a company’s conduct and performance with regard to sustainability aspects (sustainability accounting). Internally, a company needs adequate information about the sustainability performance of its products, processes, and supply chains to be able to pursue a purposeful sustainability management. Internal information systems, for example, should provide detailed information on material flows, and emissions. Several tools have been developed to assess the sustainability performance of products and processes. In a life cycle analysis (LCA; Finnveden et al. 2009; see also Sect. 8.3), for example, inputs, outputs and sustainability-related impacts of a product system are compiled and evaluated throughout the entire life cycle of a product. While ecological LCAs are widespread and often already standardised, social LCAs are slowly beginning to develop as well (Arcese et al. 2016; Kühnen and Hahn 2017). It is not enough, however, to simply assess performance. Actions need to be put in place to improve performance. In this regard, management systems, which coordinate and systemise corporate activities are widely used also in a sustainability context. Such systems follow defined and documented control and feedback mechanisms. They are usually subject to an external audit, which is supposed to check the implementation of the respective system in a firm. Environmental management systems such as those defined by standards such as ISO 14001 or EMAS III (Neugebauer 2012) aim at improving the organization of environmental management and thus ultimately of a company’s environmental performance. Social management systems such as SA8000 (Sartor et al. 2016) also exist. They are, however, much less widespread than environmental management systems. Another tool to integrate sustainability aspects into management processes is the Sustainability Balanced Score Card (Hansen and Schaltegger 2016), which aims at linking long-term strategic objectives of sustainability with short-term actions and tries to illustrate how sustainability aspects are linked to financial goals.
When turning to the external perspective, sustainability accounting has become a major issue in sustainability management. Companies are increasingly pressured (by various stakeholders or even through governmental regulations) to not only publish information on their financial situation (as, for example, in annual reports) but also to disclose sustainability information. In the European Union, for example, most companies with more than 500 employees are required to publish information on their sustainability strategies and performance and many other countries have similar regulations in place. While publishing certain sustainability information is increasingly mandatory, the modalities of disclosure are often not prescribed. Many companies publish sustainability reports which broadly cover environmental and social aspects, others integrate financial and sustainability information into one single report, or they disclose specific information on issues such as climate change (Hahn and Kühnen 2013; Hahn et al. 2015a). Two trends seem to consolidate, though. First, the voluntary standard for sustainability reporting published by the non-governmental Global Reporting Initiative has become a de facto standard in sustainability reporting and most companies implicitly or explicitly refer to these specifications. Second, especially large companies increasingly acquire an external assurance for their sustainability disclosure, because they want to receive expert advice on their reporting practices or because they want to increase the perceived reliability of their reports (Gürtürk and Hahn 2016; Reimsbach et al. 2017). Such an external assurance is usually mandatory for financial reports (e.g. annual reports) but it is voluntary for sustainability reporting.
Another area of sustainability management is sustainable supply chain management which can be characterised as “the management of material, information and capital flows as well as cooperation among companies along the supply chain while taking goals from all three dimensions of sustainable development, i.e. economic, environmental and social, into account which are derived from customer and stakeholder requirements.” (Seuring and Müller 2008, p. 1700). The main question of this area of sustainability management is how can supply chains be organised and managed so that they are economically stable and at the same time reduce ecological burdens and allow for decent working conditions? Regular media reports, for example, on horrible working conditions and on forms of modern slavery especially in developing countries as well as and on the environmental burden of contemporary production systems illustrate that the economic success of modern supply chains very often builds on otherwise unsustainable practices. Finding an answer to the mentioned question is an inherently complex task due to the highly complex and intransparent nature of many modern supply chains which regularly include several thousand suppliers and many upstream (raw material extraction and processing etc.) and downstream (manufacturing of finished goods, several distribution channels etc.) stages. The literature roughly distinguishes between supplier management for risks and performance as a rather reactive approach and supply chain management for sustainable products as a rather proactive approach (Seuring and Müller 2008).
In a supplier management for risks and performance, focal companies (i.e. those companies in the centre of the supply chain that usually design the product, that are visible for the end consumers often through a brand name, and that chose suppliers and distributors and thus orchestrate main parts of the supply chain) try to minimise risks in their supply chains and ensure a certain minimum performance to avoid social and environmental scandals which could, in extreme cases, even bear the risk of chain termination. Prevalent instruments are a supplier management, which includes the selection of suitable suppliers, their auditing and monitoring, as well as the development of suppliers through trainings, incentives, and a close integration into relevant processes. Often, companies have their own codes of conduct which suppliers are supposed to adhere to and some companies actively ask their suppliers to have environmental management systems (such as EMAS III or ISO 14001) or, albeit much less prevalently, a social management system (such as SA8000). With a supply chain management for sustainable products (e.g. Seuring 2011) companies move one step further and try to implement products that are (more) sustainable from the beginning. This includes defining minimum sustainability standards, which might require environmental and/or social LCAs to be conducted to determine the impact of the product throughout its lifespan. To arrive at sustainable products, an extensive cooperation throughout the supply chain is necessary to ensure that sustainability aspects are considered in all phases. Furthermore, chain-wide controlling systems need to be active and accompanying sustainability marketing measures should be put in place to convince the consumer of the product.
Review Questions
-
How do “weak”, “strong” and “quasi sustainability” differ in their understanding of how sustainable development can be achieved?
-
What is the status quo of intragenerational and intergenerational justice?
-
What are the different base strategies for decoupling development and environmental burden and what are their opportunities and limitations?
-
Why is sustainability management a complex endeavour?
3 Life-Cycle Sustainability Assessment
Abstract
The bioeconomy is based on the three pillars of sustainability and aims to balance the environmental, economic and social aspects. For this task, tools are required that provide qualitative and quantitative information on the environmental, economic and social performance of biobased products and on the trade-offs between the goals of the three dimensions of sustainability. In this chapter, a methodological approach for a Sustainability Assessment based on ‘Life-Cycle Thinking’ is presented. This approach combines the use of three forms of assessment: Life-Cycle Assessment (LCA) for the environmental aspects, Life-Cycle Costing (LCC) for the economic aspects and Social Life-Cycle Assessment (sLCA) for the social aspects. Together these form the most comprehensive methodology for sustainability assessment: Life-Cycle Sustainability Assessment (LCSA). A hypothetical example of an LCSA is elaborated for a biobased product to illustrate the different assessment steps.
Keywords
Value chain assessment; System analysis; Life-cycle thinking; Life-cycle assessment; Life-cycle costing; Social life-cycle assessment; Life-cycle sustainability assessment

Rosalie: Lichtwirbel 2016, Schauwerk Sindelfingen © Ulrich Schmidt
Learning Objectives
In this chapter, you will:
-
Gain an understanding of the requirements of system analysis and value chain assessment in the bioeconomy
-
Learn methods for environmental, social and economic sustainability assessments and their combined application
3.1 The Requirements for System Analysis and Value Chain Assessment in the Bioeconomy
The bioeconomy is expected to contribute towards meeting global challenges such as climate change and food security. However, bioeconomic activities are not sustainable per se. The controversial discussions surrounding the topic of modern bioenergy make this all too apparent (see Lewandowski 2015). Bioenergy is one important sector of the bioeconomy. Although the introduction of advanced bioenergy in Europe has been a success story with regard to the achievement of the GHG emission reduction goals (about 64 million tonnes of CO2-equivalent emissions were reduced through bioenergy in Germany, 25% of the German GHG reduction goal), it requires subsidies to be economically viable. In addition, the reputation of bioenergy is suffering from the possible competition between food and fuel production. The development of bioenergy has been accompanied by many unintentional and unanticipated environmental, social and economic side effects. It has become obvious that there are various trade-offs between the achievement of environmental, economic and social goals. The example of bioenergy makes it clear that the introduction of sustainable bioeconomic products requires prior assessment which:
-
Takes into account their effect on the bioeconomy system as a whole and not only the isolated optimization of specific bioeconomic sectors or activities (to avoid competition leading to food supply problems);
-
Gives consideration to and finds a balance between economic, environmental and social aspects, instead of focusing on the optimization of the performance of just one of these sustainability aspects;
-
Identifies and models potential trade-offs between economic, environmental and social goals.
When planning a bioeconomic activity, the combined environmental/social/economic assessment, referred to here as “Sustainability Assessment”, should ideally be performed ex-ante. This means it should be performed well in time to serve as a source of information for the discussion process with stakeholders, the negotiation of best compromises and as decision support for the planning of the activity. Based on the results of this sustainability assessment, potential trade-offs between economic, ecological and social targets can be identified and—where appropriate methods are available—also quantified.
Trade-offs
A trade-off describes a negative correlation. It is a situation in which the methods of achieving two goals are opposed to each other and a balance has to be struck between them.
An example of an environmental trade-off can be seen in the production of miscanthus-based bioethanol and its subsequent use in a combustion engine. The use of bioethanol in place of fossil fuels makes a positive contribution to GHG emission reduction and thus to climate change mitigation. However, at the same time, the cultivation of miscanthus, in particular the application of nitrogen fertilizer, has a negative impact on the eutrophication potential.
The assessment of the three dimensions of sustainability needs to be based on a Life-Cycle Thinking approach (see Fig. 8.17). This approach ensures:
-
The recognition and modelling of trade-offs between the fulfilment of economic, social and environmental goals. It does not make sense to improve one step of the life cycle if that improvement has negative consequences for other parts of the system which may outweigh the advantages achieved.
-
The assessment of the “true” costs of a product. These include environmental and social costs in addition to production costs.
-
The identification of “hot spots” in the environmental, social or economic performance of the life cycle or value chain of a biobased product, and starting points for improvement.
-
The identification of “future” problems (negative impacts that will become apparent in the future, for example global warming effects) and ways of avoiding transferring such problems into the future.

The concept of life-cycle thinking
Life Cycle
The life cycle of a product comprises all steps of a production process, from raw material extraction, through supply of intermediates, manufacture, transport and use phase, to the End-of-Life (EoL) of the product, which can be disposal and/or recycling (i.e. from “cradle to grave”). It includes all stakeholder interactions in each of the above steps.
This understanding of a life cycle is different from the product life cycle in economics, which refers to the life cycle of products on the market.
The difference between ‘value chain’ and ‘life cycle’ is that ‘value chain’ does not necessarily include the life cycle stages product use and End-of-Life (EoL); often it just refers to the production of a product.
Following a life-cycle approach in bioeconomic sustainability assessment enables an understanding of the system behind the production and supply of biobased products and services. A biobased value chain is the sequence of processes from biomass production through to manufacture of the biobased product, together with its opportunities for value generation, including economic, social and environmental values (see Sect. 5.2). An integrated biobased value chain optimizes the interaction of these processes and the material flows involved, with the objective of enhancing the overall performance in economic, environmental, social and thus sustainability terms (Lewandowski 2015). As can be seen for the case of bioenergy, a value chain can only perform sustainably if all processes involved are sustainable. A biofuel, for example, cannot be considered sustainable if its use contributes to the reduction of GHG emissions (by substituting a fossil reference) but its feedstock supply (biomass production) does not comply with rules for sustainable agricultural production (see Sect. 6.1.11).
A sustainability assessment performed for the whole value chain—also described as “along the life cycle”—can evaluate the overall performance of a biobased product or service, and at the same time identify “hot spots” of low or non-performance. This is true for ex-ante assessments as well as for the analysis of existing bioeconomic activities. In the latter case, a sustainability assessment can steer the optimization process.
3.2 Methodology for Sustainability Assessment
The combination of Life-Cycle Assessment (LCA), Social Life-Cycle Assessment (sLCA) and Life-Cycle Cost Assessment (LCC) is seen as the most advanced and comprehensive approach to sustainability assessment. All of these three methods embrace Life-Cycle Thinking and together they cover the three dimensions of sustainability. Here, the methods LCA, sLCA and LCC are first described, and then the case study of ethanol production from miscanthus and sugar cane is presented to show how these three methods can be combined to form an overall Life-Cycle Sustainability Assessment (LCSA). In this context, the term “product” is used in the broad sense of goods and services.
3.2.1 Life-Cycle Assessment (LCA)
Life-Cycle Assessment, most commonly referred to as LCA, is a standardised (ISO 14040 and 14044) method of assessing the potential environmental impacts of products, processes and services in relation to a ‘functional unit’. The basic approaches underlying LCA are Life-Cycle Thinking and the aggregation of environmental interventions into impact categories.
Functional Unit and Reference Flow
According to ISO 14040, the Functional Unit (FU) is the “quantified performance of a product system for use as a reference unit” (ISO 14040 2006, p. 10). The results of all impact categories can be related to this reference unit. In the case of energy-producing systems, such as bioethanol production, it could be, for example, 1 GJ. This enables a comparison with other bioenergy sources or with a fossil reference.
The Reference Flow is the output from processes in a given product system that is necessary to fulfil the function expressed by the FU. So, with a FU of for example 1 GJ, the reference flow (e.g. in litres) is higher for bioethanol than for fossil gasoline, because the energy content of bioethanol is lower.
In LCA, emissions, use of energy and resources, and material streams are assessed for all defined process steps or modules along the whole life cycle of a product. In the following sections, the life cycle of bioethanol from miscanthus (a perennial C4 grass, for more information see Lewandowski et al. 2016) is used as an example. The process tree for this example is shown in Figs. 8.18 and 8.19 and concrete examples of process modules are “soil preparation” and “planting and establishment” for the process of biomass production, and “shredding” and “pre-treatment” for the process of biomass conversion to ethanol. Material streams are shown as inputs (e.g. “fertilizer”) or outputs (e.g. “ethanol”) (see Figs. 8.18 and 8.19). Emissions, such as GHGs, are an output from process modules. At the beginning of an LCA study, the so-called “system boundaries” of a life cycle are defined (see Figs. 8.18 and 8.19). These should include not only the production process modules, but also the treatment and recycling of wastes and side streams (see Figs. 8.18 and 8.19). If the defined system also includes the use phase and the End-of-Life (EoL) of the product, we refer to this as a “cradle-to-grave” analysis. It is also possible to perform a so-called “cradle-to-gate” analysis. In the example chosen here, this would encompass the biomass cultivation process modules up to the farm gate only, including crop production, harvest and transport from field to farm.

Life-cycle description and system boundaries for miscanthus biomass cultivation

Life-cycle description and system boundaries for the conversion of miscanthus biomass to ethanol
Figure 8.20 shows the aggregation of environmental interventions (e.g. emissions, material streams) into midpoint categories (also called impact categories) and endpoint categories (also called damage categories). The approach for aggregating environmental interventions is comparable for midpoint and endpoint categories. Here this aggregation, which consists of three mandatory steps, is explained using the impact category “climate change” as an example. You can find a more in-depth explanation in the ISO 14044 standard.

Overall framework linking environmental interventions via the midpoint categories to damage categories (adapted from Jolliet et al. 2003)
Category Indicator and Characterisation Model
According to ISO 14040, the category indicator is the “quantifiable representative of an impact category”.
The characterization model describes the relationship between the Life-Cycle Inventory (LCI) results (the environmental intervention) and the category indicator. An example of a characterization model is the GWP100.
GWP100: Potential contribution of a greenhouse gas to the heating of the atmosphere over a 100-year time horizon. The global warming potential (GWP) measures how much energy the emissions of a gas absorbs relative to the emissions of the same amount of carbon dioxide (CO2).
In the first step, the impact category to be analysed (here climate change) is chosen. For this impact category, the corresponding category indicator is infrared radiative forcing and the characterisation model is GWP100. In the second step, relevant environmental impacts (or environmental interventions) are assigned to this impact category. An example of an environmental impact of miscanthus cultivation (see Fig. 8.18), which is assigned to the impact category “climate change” is GHG emissions (e.g. CO2, CH4 and N2O). These are mainly caused by the production and application of nitrogen fertilizer. All these GHGs impact the climate and lead to global warming. However, the extent to which they influence the climate varies significantly. For each GHG, there is a characterization factor, which expresses its global warming potential in kg CO2-equivalents/kg gas based on the characterisation model. For example, N2O is a much more potent GHG than CO2. It has a characterization factor of 265, which means that 1 kg N2O has a global warming potential of 265 kg CO2-equivalents. This is taken into account in the third step, the calculation of the results for this impact category.
The impact category “climate change” belongs to the so-called “midpoint categories”. These indicate environmental problems that lie along the environmental mechanism, at an intermediate point between the environmental interventions and the final damage to the area of protection (see Fig. 8.20). An environmental mechanism is defined in ISO 14044 (2006) as a:
System of physical, chemical and biological processes for a given impact category, linking the life cycle inventory analysis results to category indicators and to category endpoints (ISO 14040 2006, p. 12).
Midpoint categories quantify, for example, the amount of CO2 equivalents emitted, but they do not give any information on the effect on the damage category. In our example, this could be the effect of species extinction caused by global warming on the damage category “ecosystem quality”. Thus the endpoint categories (damage categories) represent the area of protection affected by the environmental intervention.
One weakness of current LCA approaches is that not all relevant environmental impacts can yet be described by impact categories. This is especially true for impacts on biodiversity and soil quality, both of which are relevant for biomass production. Section 9.3.3 presents approaches on how land use and biodiversity aspects can be integrated into LCA.
The choice of impact categories included in an LCA is not standardised. Climate change and resource depletion are most commonly chosen. However, for biomass production and utilization, relevant potential ecological impacts also include land and water use, marine ecotoxicity, human toxicity and freshwater eutrophication (Wagner et al. 2017). Therefore, it is recommended that those impact categories should be chosen for which relevant impacts are anticipated in the biobased value chain under analysis (Wagner et al. 2017).
An LCA is performed in the following steps:
-
1.
Definition of goal and scope
Specification of the objective of the study as well as intended application and audience, setting of system boundaries, choice of impact categories to be considered.
-
2.
Life-Cycle Inventory (LCI)
Data acquisition and derivation of assumptions underlying the study.
-
3.
Life-Cycle Impact Assessment (LCIA)
Calculating the potential ecological impact according to chosen impact categories.
-
4.
Interpretation
Description and interpretation of results, development of conclusions and recommendations.
The objectives of an LCA (step 1) can be manifold and include, among others:
-
The assessment and quantification of the potential environmental impact of a product or service for one or more environmental impact categories,
-
The identification of environmental hot spots in a production process or unit,
-
The quantification of environmental trade-offs,
-
The provision of decision support for the environmental improvement of a production process or unit,
-
The development of a database for customer information and “green” marketing strategies.
The practical performance of an LCA study can be supported by calculation programs, such as Excel, or professional LCA programs, such as GaBi (www.gabi-software.com), SimaPro (www.pre.nl/simapro/default.htm) and Umberto (https://www.ifu.com/umberto/). One example of a licence-free, open-access LCA program, which is very simple to use, is CCalc2 (http://www.ccalc.org.uk/ccalc2.php). However, this program only covers selected impact categories and is limited in its utilization possibilities. An example of an open-access LCA software with features comparable to those of professional programs is openLCA (http://www.openlca.org/). The major benefit of using LCA programs is that they offer structured data processing and performance of the impact assessment step. Users can back these up with their own data banks for the inventory analysis. LCA data can also be accessed from commercial databases, such as ecoinvent (www.ecoinvent.ch), or open-access databases, such as the ELCD database (http://eplca.jrc.ec.europa.eu/ELCD3/), the NEEDS Life Cycle Inventory database (http://www.needs-project.org/needswebdb/) and ProBas (www.probas.umweltbundesamt.de) from the German Umweltbundesamt.
3.2.2 Life-Cycle Costing (LCC)
Life-cycle costing, abbreviated to LCC in the following sections, is the economic equivalent of LCA. “Environmental” LCC was actually developed as an economic counterpart to LCA and sLCA. LCC summarizes all costs of the physical life cycle of a product or service that are borne by one or more of the parties involved in the life cycle (e.g. farmers, producers, consumers/users). This is different from conventional cost accounting in that “true” costs are assessed, including costs of waste removal and recycling, and “hidden” costs, such as for environmental protection and financial risks. These are then clearly attributed to a particular product system. This allows the costs of environmental intervention to be assessed (Swarr et al. 2011).
Overall, LCC can serve as a tool:
-
To understand the cost drivers of a product system,
-
To gain a realistic evaluation of costs beyond production prices,
-
To perform a trade-off evaluation (such as price-versus-disposal costs),
-
To assess “ignored costs” or externalities,
-
To identify options for improvement,
-
To validate pricing strategies,
-
For decision support.
In order to avoid double accounting with LCA, the costs assessed in “environmental” LCC must relate to real money flows and thus do not include monetarised environmental impacts (Swarr et al. 2011). That means, if for example CO2 emissions are quantified in the LCA, they should not be priced in the LCC for instance in form of costs of CO2 certificates. In LCA, environmental impacts are quantified in physical units (e.g. kg CO2eq.); in LCC, costs are quantified in monetary units (Euro or other currencies). Besides internal also external costs are included, if these impacts are not already accounted for in the LCA or sLCA.
Internal and External Costs
Internal costs are costs for the production, use and end-of-life of a product that are paid by an entity or stakeholder directly involved in the product system value chain.
External costs are costs that are borne by third parties outside the product system value chain (e.g. waste recovery fees, indirect health costs) (Swarr et al. 2011).
LCC adopts the structure given in ISO 14040 for LCA. It also uses corresponding product system boundaries, a functional unit and defines indicators that are quantifiable, measurable and monitorable. But in LCC, the only unit of measurement is the currency. For this reason, the life-cycle impact assessment stage is not included and so LCC only consists of the three steps: (1) Definition of goal and scope, (2) Inventory analysis and (3) Interpretation. There is no impact assessment, because the aggregated data provide a direct measure of impact.
Through LCC, the cost assessment can be performed from the different perspectives of multiple agents along the life cycle. This means that, for our example of bioethanol production, the costs can be assessed from the perspective of a manufacturer of bioethanol, a consumer of bioethanol and a municipality intending to support the establishment of miscanthus production for a bioethanol plant. In practical application, LCC can support the assessment of CO2 mitigation costs for miscanthus-based ethanol production.
3.2.3 Social Life-Cycle Assessment (sLCA)
Social life-cycle assessment, abbreviated here to sLCA, is the social counterpart of LCA. The UNEP/SETAC Life Cycle Initiative defines sLCA as a
Social impact (and potential impact) assessment technique that aims to assess the social and socio-economic aspects of products and their potential positive and negative impacts along their life cycle (Benoȋt and Mazijn 2009, p. 100).
It has the same structure as LCA with the steps (1) Definition of goal and scope, (2) Inventory analysis, (3) Impact Assessment and (4) Interpretation. It also follows the life-cycle approach, but with significant differences to LCA as no standards comparable to ISO 14040/44 have been established and the social impact categories in sLCA are less well developed than the environmental impact categories of LCA.
Social aspects assessed in sLCA are the consequences of positive or negative pressures on social endpoints (e.g. well-being of stakeholders). These social endpoints are comparable to damage categories in LCA. The social aspects assessed are generally related to: (1) the behaviour (e.g. decision taking), (2) socio-economic processes (downstream effects of socio-economic decisions), or (3) impacts on human, social or cultural capital (Benoȋt and Mazijn 2009). In sLCA, sub-categories are defined as socially significant themes or attributes. Two complementary sub-category classification schemes have been proposed: classification according to stakeholder and classification according to social impact pathway. These lead to two methods of categorising social impact categories (Benoȋt and Mazijn 2009):
-
1.
Classification of social impact categories according to the stakeholder affected e.g. worker, consumer, local community, society, value chain actors not including consumers (see Table 8.1). The indicator results of the sub-category are aggregated into impact categories. However, there are no characterization models available for this that are generally accepted by sLCA practitioners.
Table 8.1 Classification of social impact categories according to the stakeholder affected (Benoȋt and Mazijn 2009) -
2.
Classification of social impact categories according to the social impact pathway, e.g. human rights, working conditions, health and safety (see Fig. 8.21).
Fig. 8.21 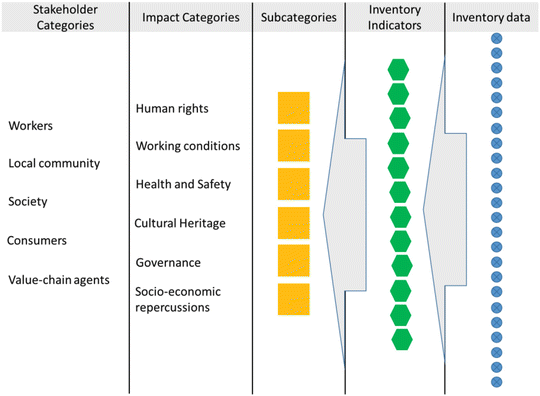
Classification of social impact categories according to the social impact pathway (Benoȋt and Mazijn 2009)

Results can be aggregated over the life cycle, for example 75% of the life cycle of a certain product are free from child labour.
At each geographical location in the value chain, the social and socio-economic inputs may be performed by five main stakeholder groups: workers, local communities, society (national to global), consumers and value chain actors (see Table 8.1).
A stakeholder category is a cluster of stakeholders that are expected to have shared interests due to their similar relationship to the investigated product system (Benoȋt and Mazijn 2009, p. 101).
Table 8.1 shows sub-categories for the different stakeholder groups. These sub-categories are assessed through the use of inventory indicators, which can be either quantitative or qualitative. An example of an inventory indicator for the stakeholder “worker” in the sub-category “Freedom of association and collective bargaining” could be evidence that this freedom is restricted. You can find more detailed information on the sub-categories and their inventory indicators in the puplication “The methodological sheets for subcategories in social life cycle assessment (s-lca)” (see further reading).
The identification and selection of subcategories for a planned sLCA should be performed in consultation with the stakeholders.
3.2.4 Life-Cycle Sustainability Assessment (LCSA)
The aggregation of LCA, LCC and sLCA into an LCSA reveals any trade-offs between the three pillars of sustainability.
The conditions for an LCSA are:
-
The use of consistent system boundaries for all three assessments,
-
The assessment is based on the physical (not marketing!) life cycle of a product, i.e. a cradle-to-grave approach,
-
The use of compatible inventory approaches for all three assessments.
The first step in an LCSA is the choice of appropriate functional unit. According to Benoȋt and Mazijn (2009), the following steps are required to define the functional unit:
-
Description of the product by its properties, including its social utility (which encompasses various social functions for the consumer such as convenience and prestige);
-
Determination of the relevant market segment;
-
Determination of relevant product alternatives;
-
Definition and quantification of the functional unit, in terms of the obligatory product properties required by the relevant market segment;
-
Determination of the reference flow for each product system.
3.2.5 Case Study LCSA
This section describes how an LCSA of ethanol production for the European market, based either on European miscanthus production or Brazilian sugar cane production, could be approached.
Definition of Goal and Scope
The goal of the study is to assess the sustainability of ethanol-based biofuels from various production options. The assumption is that, from an environmental, social and economic point of view, ethanol-based biofuel is more sustainable than the fossil reference gasoline. Although Brazilian sugar cane ethanol is state of the art and an economically viable option, ethanol produced regionally from lignocellulosic biomass derived from perennial non-food crops is perceived to be a more sustainable alternative for the European market.
The function we are looking for here is the supply of energy in the form of transportation fuel. Therefore, the functional unit chosen is 1 GJ (ethanol or gasoline).
The system boundaries for our analysis encompass: cultivation of the biomass including production of input substrates, transport of the biomass to the conversion plant, conversion into ethanol, transport of the ethanol to the end user/customer, and final use. The major differences between the production systems of ethanol from miscanthus and ethanol from sugar cane are: (a) the location of the biomass production (miscanthus in Europe, sugar cane in Brazil); (b) the form of transport as well as the transport distance; and (c) the conversion technology. The largest transport distance in the miscanthus chain is the transport of bales from the farm to the ethanol plant (<100 km). By contrast, sugar mills with integrated ethanol plants are located directly by the sugar cane fields, because sugar cane biomass needs to be processed immediately. The largest transport distance for sugar cane ethanol is that of the intercontinental shipping from Brazil to Europe (>8000 km), which occurs after the ethanol has been brought from the sugar mill to the harbour (<100 km). The conversion of polysaccharides into ethanol requires energy. In the case of a sugar cane ethanol plant, this can be fully supplied from the bagasse, which can even provide excess electricity. The conversion of lignocellulosic biomass from miscanthus into ethanol requires several pre-treatment steps, including the use of enzymes, and is thus very energy-intensive (Gilpin and Andrae 2017).
The environmental impact categories most relevant for perennial crop-based value chains are, among others: climate change, fossil fuel depletion, eutrophication and acidification (Wagner et al. 2017). These were therefore chosen for the LCA.
As working conditions in sugar cane plantations are often reported to be poor, we choose “workers” as the most relevant stakeholder group for the current example and included them in all sub-categories listed in Table 8.1. However, when analysing the impacts of biobased value chains, also other stakeholder categories, such as the “local community”, could be affected and should be considered.
For the LCC, all direct costs, including labour, material, energy and transport costs, were assessed.
Inventory Analysis
Figure 8.22 shows the midpoint and endpoint categories chosen for our ethanol case study. The data inventory can be performed through a literature search, from online databases (e.g. ILO for labour conditions) or commercially available databases (ecoinvent for life-cycle data on material and energy flows), from company and/or government online resources, and from measurements and stakeholder interviews. Stakeholder interviews for data acquisition require the most effort, involving travel and performance of the interviews, both of which are time-consuming. The assessment of data for the production of ethanol from miscanthus is challenging, because this value chain has not yet been implemented and the conversion technology is still at the R&D stage. For this reason, many assumptions have to be made in the LCI of this chain. For the LCA, environmental and impact assessment data for ethanol produced from miscanthus were based on the authors’ own calculations (unpublished). The environmental data for sugar cane-based ethanol production were taken from Muñoz et al. (2014) and Seabra et al. (2011). For the sLCA and the LCC, no data were acquired; instead best guesses were used.

Midpoint and endpoint categories, sub-categories of stakeholders and cost categories assessed in the case-study LCSA on bioethanol (adapted from Valdivia et al. 2011)
The reference values for gasoline were taken from the ecoinvent database (Weidema et al. 2013).
Impact Assessment
Figure 8.23 shows a high-level summarised approach for the qualitative presentation of the (hypothetical) results of the LCSA. The results were ranked in relation to the alternatives. That means, of the three systems (miscanthus-based ethanol, sugar cane-based ethanol and gasoline) the one with the lowest impact is shown in green and the one with the highest impact in red. As mentioned above, the LCA data stem from the literature (Muñoz et al. 2014; Seabra et al. 2011), but no real data were available for the LCC and sLCA, and therefore the cost and social impact information given in Fig. 8.23 is hypothetical. It is included here to show how LCA, LCC and sLCA can be integrated into an LCSA.

Comparative results for the LCA, LCC and sLCA assessment and its compilation into an LCSA; performed for ethanol production from miscanthus and sugar cane. Results for the LCA were taken from Muñoz et al. (2014) and Seabra et al. (2011). Results for the LCC and sLCA are hypothetical. GWP Global Warming Potential, FFD Fossil Fuel Depletion, AP Acidification Potential, EP Eutrophication Potential
Interpretation
Miscanthus-based ethanol is the most beneficial alternative from a social viewpoint, because working conditions in Europe are well defined and regulated. Another positive aspect is the fact that the production of miscanthus ethanol creates new jobs in Europe. By contrast, working conditions in sugar cane plantations are poor (Rocha et al. 2010) and human rights violations can occur, such as forced or child labour. Also, wages are low and work is only available seasonally. However, this social assessment ignores the question of the need for these jobs and income opportunities in Brazil.
The overall environmental performance is best for sugar cane. The efficient recycling of nutrients, the full autonomy of energy supply through bagasse, and low fertilizer demands lead to the best environmental performance with regard to GWP and FFD, and a better performance than miscanthus with regard to EP and AP. Both biobased ethanol production pathways perform better environmentally than the fossil alternative with regard to GWP and FFD. However, they perform worse with regard to AP and EP, mainly due to fertilizer-induced emissions.
Miscanthus-based ethanol production carries the highest production costs because wages in Europe are higher and the second generation ethanol production technology is much more expensive than that for sugar crops. Anticipated transport costs for the import of sugar cane ethanol to Europe are relatively low because it is transported by ship.
Overall, miscanthus-based ethanol is to be preferred from a social point of view and sugar cane ethanol from an environmental point of view (for those impact categories considered in the LCSA).
Here, the results are only demonstrated qualitatively. When conducting an LCSA, quantitative data are used for all impact categories to quantify the relative performance and trade-offs between the product pathways.
Review Questions and References
-
What are the purposes and goals of system and value-chain/life-cycle assessments in the bioeconomy
-
What is Life-Cycle Sustainability Assessment (LCSA)?
-
What are the conditions and methodological steps for the performance of a consistent LCSA?
-
What can the results of an LCSA be used for and by whom?
Further Reading
Baumann H, Tillman AM (2004) The Hitch Hiker’s guide to LCA: an orientation in life cycle assessment methodology and applications. Studentlitteratur, Lund
Benoît Norris C, Traverso M et al (2009) The methodological sheets for subcategories in social life cycle assessment (s-lca). Available on: http://www.lifecycleinitiative.org/wp-content/uploads/2013/11/S-LCA_methodological_sheets_11.11.13.pdf
4 Entrepreneurial Ventures and the Bioeconomy
Abstract
Entrepreneurship is based on entrepreneurial opportunities and the bioeconomy offers a plethora of such opportunities. As the bioeconomy—at least partially—addresses humanity’s greatest challenges, it consequently offers the greatest entrepreneurial opportunities as well. One useful tool to break down the idea generation process and manage the entrepreneurial process is the business model canvas, which makes it possible to clearly describe the value proposition of a new venture in the bioeconomy. The lean start-up approach can help entrepreneurs in the bioeconomy to move efficiently through the entrepreneurial process and to quickly develop a value proposition and a validated business model.
Keywords
Entrepreneurial opportunity; Business model; Start-up process

Starting up and growing © Singkham/Fotolia
Learning Objectives
After studying this chapter, you will be able to:
-
Understand the challenges the bioeconomy faces and to be able to interpret them as entrepreneurial opportunities.
-
Know the key tools that entrepreneurs in the bioeconomy can use to manage the start-up process.
-
Get an initial idea of the first steps necessary to become an entrepreneur in the bioeconomy.
4.1 Entrepreneurial Opportunities and the Bioeconomy
Humans being conscious of their footprint on this planet is not a novelty. More than 40 years ago the Club of Rome (Meadows et al. 1972) introduced the world to different model-based scenarios that illustrated the limits of economic growth, which directly correlate with the finite natural resources of planet earth. Despite significant public awareness, those same issues remain pressing and relevant. The bioeconomy addresses these challenges, but the transition to it will not happen overnight.
Government interventions might be one solution, but private initiative from entrepreneurs has promising potential too (Kuckertz and Wagner 2010). Providing business solutions to accomplish the switch from our current fossil fuel based economy is the main task of entrepreneurs in the bioeconomy. Entrepreneurs are likely to provide valid answers to questions like how we might produce more with less and how we can secure more high quality food, more energy, and more social stability with fewer resources, less space, less water, less energy, and less risk.
Addressing those challenges with a meaning in mind and not with a given fixed set of objectives and resources is an ongoing process, in which entrepreneurs use their existing networks to accomplish targets that will eventually lead to newly established companies addressing the challenges of the bioeconomy. This is not just an altruistic mindset but also the starting point for a business opportunity in areas such as energy, food security and resource efficiency.
There are several barriers hindering the development of the bioeconomy. Companies and individuals might be aware of the threats to planet earth, but at the same time business practices today often do not value, for instance, free natural assets. Therefore, natural assets are especially prone to abuse by society and individuals (Dorfman 1993). Governments might provide funds and support to reduce this market failure. However, at the same time this market failure with an environmental impact provides grounds for many entrepreneurial opportunities in the bioeconomy.
Entrepreneurial Opportunity
The opportunity to establish a new firm which in the bioeconomy often results from market failure. Huge market failures provide huge opportunities for entrepreneurs to establish new ventures that create value by addressing the challenges facing humanity.
If the market failure creates a problem, an individual can engage in entrepreneurial activity and generate profit by discovering the opportunity to provide a solution, evaluating the opportunity, and ultimately exploiting it by providing the solution (Shane and Venkataraman 2000; Dean and McMullen 2007). When providing such bioeconomic solutions, entrepreneurs contribute to the mitigation of the market failure and hence to the development towards the bioeconomy. The Visioverdis case study is a perfect example of the tremendous creativity that entrepreneurs can apply to address the huge challenges of the bioeconomy.
Box 8.3 Case Study Visioverdis: The GraviPlant
Alina Schick, a biologist with expertise in botany with focus on plant physiology who received her PhD in agricultural sciences from the University of Hohenheim in Germany, has been wondering about one of those big challenges for society. More specifically, Alina has been asking herself: How should the cities of the future be designed? If population density concentrates in metropolitan areas, how can air pollution be minimised? Pollution concentration in major cities also brings two major side effects: Green areas tend to disappear and land prices increase exponentially making it almost impossible to have parks in the city or to maintain existing green areas.
Alina’s start-up called Visioverdis (Visioverdis 2017) solves this problem with the GraviPlant, a tree that can be installed on building facades and grows perpendicular to the wall (see Fig. 8.24). The idea is based on Alina’s doctoral studies during which she managed to grow trees horizontally by rotating them in their own axis and giving them precise doses of water and nutrients (Clinostat). After testing different types of trees and building the first prototype she proved the existence of a business opportunity for her research by participating in and winning several start-up idea competitions. In 2017, Visioverdis managed to acquire a contract to integrate trees into the facade of the building designed for the world show that celebrates the 500th anniversary of the protestant reformation in Wittenberg, which offers an opportunity to present the idea to a global audience.

The GraviPlant ©Alàbiso/Visioverdis
The tree rests in a sealed container with a high-tech plant care system. The container is just docked to a water pipe and the tree grows fully independently, requiring no maintenance for a four-year period. Currently available solutions (like vertical planting systems or creeper plants) in contrast require constant maintenance to prevent damage to the building’s infrastructure. Visioverdis’ goal is not only to conquer the European market, but also to unleash the potential of the GraviPlant in countries that currently suffer from severe air pollution and drought such as China and Saudi Arabia.
What exactly constitutes an entrepreneurial opportunity has been debated in the academic literature for quite some time (Kuckertz et al. 2017). There seems to be consensus that the process of recognising entrepreneurial opportunities involves being alert, actively searching for them, and gathering information about new ideas on products or services. Economic theory (Schumpeter 1934; Kirzner 1973; Drucker 1984) suggests that entrepreneurs should particularly look for four different types of trends and developments, as these are likely to trigger entrepreneurial opportunities. These are:
-
Information asymmetries and incongruences
-
Exogenous shocks
-
Changes in demand
-
Changes in supply
For instance, it appears obviously incongruent that each year eight million people die of hunger caused by scarcity of water and agricultural land (Conforti 2011), whereas at the same time in the developed world “redundant” food is being destroyed. Resolving such incongruity constitutes an opportunity for bioeconomy entrepreneurs. Similarly, climate change [or other earth system processes that are in danger (Rockström et al. 2009)] could be interpreted as exogenous shocks that are likely to be addressed with new technologies brought to the market by innovative entrepreneurs. In a similar vein, such exogenous shocks can prompt changes on the demand side: End consumers now tend to want ethical, green, and sustainable products and services, and entrepreneurs can cater for such desires with new offerings.
Given the sometimes enormous failure rates of entrepreneurial ventures, entrepreneurs need to assess whether a particular opportunity has the potential to be turned into a profitable business. There is obviously no way to do so in an objective and completely reliable manner, however, to assess whether an entrepreneurial opportunity is interesting, it may help to think about these opportunities as a professional investor would. That investor might be a venture capital firm (Kollmann and Kuckertz 2010) or a unit investing in promising start-ups on behalf of a larger corporation (Roehm et al. 2017). Such investors would look for opportunities:
-
Where entrepreneurs can create significant value for customers or users
-
Where the opportunity matches the experience and competence of the entrepreneur or the venture team
-
Where an important problem is addressed or needs will be met for which customers are willing to pay a significant premium
-
Where they can be active in a large and growing market
-
Where there is a balance of risk and potential
The potential to become entrepreneurially active in the bioeconomy is therefore enormous, as an equilibrium of natural sources and an ideal bioeconomy is unfortunately not yet in sight. The potential is also reflected by the current estimated value of the bioeconomy exceeding two trillion euros and employing 22 million people in Europe (agriculture, forestry, fisheries, food, and chemicals) (European Commission 2012). Each euro invested in the bioeconomy is estimated to generate 10 € of added value by 2025. This is fertile ground for entrepreneurial activity.
4.2 Managing the Start-Up Process in the Bioeconomy
In general, entrepreneurship deals with the question of how individuals effectively organise any growth-oriented creation process on the basis of opportunity (Kuckertz and Mandl 2016). Having an idea of what product or service in the bioeconomy customers could benefit from is thus often the first step towards exploiting such an entrepreneurial opportunity and founding a start-up (Kuckertz et al. 2017). However, traditional market research instruments often fail to assess the potential of a product or service, which does not yet even exist. The only way to find out is to develop and test the product early.
Business Model
Explains the key components of a business and how they relate to each other in order to create value.
A popular approach to become entrepreneurially active is the lean start-up method, which describes founding a business in a very lean and resource-conscious manner. It stands in opposition to more traditional approaches of managing the start-up process that usually include writing a detailed business plan and approaching the market only when a close-to-perfect offering has been developed. The lean start-up method is related to the Japanese car manufacturer Toyota’s lean manufacturing, an approach seeking to eliminate as much waste as possible from production processes (Womack and Jones 1996). Similarly, the lean start-up method seeks to eliminate as much unnecessary effort as possible from start-up processes.
Eric Ries (2011) is credited with applying lean principles to founding start-ups. The lean start-up method is an iterative and agile method to develop a start-up based on listening to the needs of potential customers and testing their willingness to pay for the service or product offered by the start-up. During the process, the focal question is whether the product or service solves a real problem from real customers and whether a valid business model can be developed. Instead of planning far into the future, the aim is to learn by doing, and by introducing the product or service to the market as early as possible. This naturally involves a risk of failure, but as failure never can be completely avoided, it is reasonable to embrace it as early as possible. Failure creates opportunities to learn and to try again to succeed (Blank 2013a) and thus many entrepreneurs go through many failed projects before they eventually find a valid business model (Mandl et al. 2016).
The first step of the lean start-up method involves making basic assumptions concerning possible customer requirements and the potential market. Assumptions should initially be validated by talking to and listening to potential customers. The potential failure and learning then needs to be enabled quickly by developing a so-called minimum viable product. For instance, the German start-up betula manus is currently trying to establish whether there is money making potential in tree bark, which is a waste product from the paper industry (Betula Manus 2017). To do so, betula manus is testing the market potential of tree bark with different minimum viable products in different industry segments such as bicycles and door handles.
Minimum Viable Product
Constitutes a reduced offer that is subjected to customer feedback as quickly and often as possible in order to test a start-up’s hypotheses about actual market needs.
The minimum viable product represents a prototype that might be far from perfect, but which works. Once there is a minimum viable product, the build-measure-learn cycle can be initiated (Blank 2013b). The cycle aims to enable validated learning by continuously improving the minimum viable product based on customer feedback. The development of the minimum viable product towards a functioning business model might include numerous incremental changes, but might also require a pivot, that is, a more radical correction from the original idea towards a new value creation if some underlying assumptions prove invalid.
Especially in the bioeconomy with potentially highly innovative products, customers and entrepreneurs might need to discover the product’s added value together in order to arrive at a functioning business model. The minimum viable product illustrated in Fig. 8.25 exemplifies the incremental change in farming tools according to the needs of the farming sector. Even the first approach to a farming tool is fully functional, but it takes several iterations to arrive at the final, smart solution. While a minimum viable product helps to test the market, it is not sufficient to build a company around it. Instead entrepreneurs need to think in terms of business models, which answer the question of what key components of the company interact to generate value for the customer and therefore provide a competitive advantage for the company.

Minimum viable product of basic farming tools developing into software-based precision agriculture
The business model canvas is a powerful, iterative tool (see Fig. 8.26) to think beyond a specific idea or product and develop the business model. The canvas consists of nine distinct components that describe how an organization creates, delivers, and captures value (Osterwalder and Pigneur 2010). The business model canvas is useful to understand and visualise the interplay of the different components creating value. While it might be helpful to understand existing business models, the business model canvas is also suitable to design business model innovations, which describe novel approaches towards the design of single components and the interplay of such components.

The canvas can be compared to a theatre. The left side of the canvas represents the backstage, the creative arena of the organization, which is usually not visible to customers. The right side of the canvas represents the stage, the value part of the organization, which needs to be clear to customers. The nine components of a business model are described below on the basis of the bioeconomy start-up UrbanFarmers. This company has spent the last six years delivering a commercial scale aquaponic solution. Aquaponics is the integration of two separate established farming technologies: recirculating water fish farming (aquaculture) and soil-less plant farming (hydroponics).
The combination of food production systems creates a symbiotic relationship that requires a minimum input as all the water and its nutrients are recirculated in a closed loop system where both fish and plant production can take place (Carlsson 2013).The combination results in production yields higher than are available from soil-based cultures (Savidov et al. 2007), a sustainable use of natural resources like the elimination of 90% of the fresh water requirement (Blidariu and Grozea 2011), and an organic production method free from pesticides and antibiotics. The aquaculture (fish farming) wastewater (effluent) is used as organic fertilizer for plants, with significant water savings. The use of the aquaculture wastewater as an organic fertilizer negates the need for fossil-based fertilizers.
Business Model Canvas
Combines nine components associated with a firm to illustrate how value is created and can be utilised to understand existing business models, but also to create innovative business models.
Central to the business model is the value proposition, which addresses the added value the company provides to its customers. The value proposition of UrbanFarmers is a functional aquaponics branded urban farm (this includes design, development, operations, and sales). It offers its customers a system that is 20 times more productive than a conventional soil-based greenhouse. The value proposition might be different for each customer segment, the term to describe who the company creates value for. UrbanFarmers is a business to business company and its customer segments include supermarkets and commercial growers. The channels are used to reach customers and point out the value proposition to them. UrbanFarmers approaches potential customers through business meetings, and makes presentations to investors and potential farm buyers. Moreover, UrbanFarmers uses the UrbanFarmers-BOX (a container-sized demonstrator) and its pilot farms in Basel and The Hague to create interest in the firm’s products. Media coverage of their current reference projects showing the interest of end consumers in UrbanFarmers’ salad and UrbanFarmers’ fish production is an important proof of concept of a profitable business for future investors and farm buyers. The customer relationships describe how the relationship with the relevant customer segment is created and maintained. Revenue streams are generated through selling the value proposition. In other words, it answers the question of where the money is made. UrbanFarmers generates one time revenues from the development and construction of a farm and recurring revenues from the technical service, audits, key account management, and communication services of the farm. Recurring revenues also include royalty fees for licensing the UrbanFarmers proprietary software and using the UrbanFarmers brand.
Whether the revenue streams are sufficient to make the business model work depends on the components on the left side of the model. The key activities are required to create the value proposition. In the case of UrbanFarmers, its key activities are the farm design, commissioning, operations and maintenance services and brand management. The key resources are needed to realise the key activities. To achieve a functional farm, the key resources of UrbanFarmers are the team, software platform, the brand, and the expertise in delivering a functional aquaponic farm to its customers acquired over the past six years. The activities and resources might be internal or come from a key partner outside the organisation. UrbanFarmers cooperates with several key partners such as greenhouse constructors that can deliver commercial greenhouses modified for aquaponic production purposes, and suppliers of consumables such as the fish food and seedlings. Another important key partner for UrbanFarmers is the media helping to popularise and sustain the brand UrbanFarmers. Investors and commercial producers who do not want to get involved in the operations and maintenance of the farm can also be key partners. As a whole the left side of the business plan creates costs, which form the cost structure of the business model. In other words, the left side of the plan answers the question of how much it costs to create the value. UrbanFarmers is becoming an international company with a franchise model, and its cost structure is currently a combination of salaries, farm construction, payment to suppliers, and maintenance of the platform.
The goal of any entrepreneur is thus to create a business model that not only creates value, but that also creates a favourable balance of cost structure and revenue streams. Only when this goal has been achieved can a firm say it has a viable business model.
Box 8.4 Hands on: Let’s Get Started!
If you have an idea, that is great! We just managed to motivate you to change the world. Here, you will find a simplified set of steps that can help you to get started. First, check your idea. To create a better world is always a great starting point for any start-up. However, at some point you will need money to progress your idea. Therefore, the basis for a financially sustainable company is an idea with market potential. Use the following “W” questions to test the market viability of your idea. If you cannot answer all the questions that is ok, answering them all is a learning process you will have to go through. Remember? Build, measure, learn!
-
1.
What is the business idea?
-
2.
What makes your idea special?
-
3.
Who are the customers and how big is the target group?
-
4.
What is the business model?
-
5.
Who are the competitors? (includes products/solutions similar to yours)
-
6.
Who is part of the founder team? Who is missing?
Once you can answer all these questions, you should take four steps that can help to develop your idea further and move towards a sustainable business model in the bioeconomy:
-
1.
Join a start-up event in your city and get to know the start-up scene in town. These events are the perfect place to network and exchange your ideas with others.
-
2.
Pitch your idea and discuss it with people you do not know. In this way, you can obtain valuable input about the first problems your idea may encounter.
-
3.
Find a team that can help you to make your idea a reality. Only when the entire team shares the same vision, can objectives be accomplished.
-
4.
Work with the business model canvas intensively. And look for a mentor who can provide valuable feedback.
Review Questions
-
What is an entrepreneurial opportunity and why is the bioeconomy likely to offer many entrepreneurial opportunities?
-
What is a business model and how can it be described? Try to identify start-ups in the bioeconomy and describe their business model.
-
What is a minimum viable product and why is it preferable to a wholly developed product, especially at the point of starting up?
Notes
- 1.
More precisely, the price elasticity of demand measures by what percentage the quantity demanded decreases if the price increases by 1%. In general, the price elasticity of demand is a negative number but the minus sign is often omitted for the sake of simplifying the discussion of the value.
References
Arcese G, Lucchetti MC et al (2016) State of the art in S-LCA: integrating literature review and automatic text analysis. Int J Life Cycle Assess. https://doi.org/10.1007/s11367-016-1082-0
Ayres RU (2007) On the practical limits to substitution. Ecol Econ 61(1):115–128
Baltus W, Beckmann J, Carrez D, Carus M, Dammer L, Essel R, Kaeb H, Ravenstijn J, Sanz Mirabal A, Scholz L, Sibilla F, Zepnik S (2013) Market study on bio-based polymers in the world‑capacities, production and applications: status quo and trends towards 2020. Nova-Institut GmbH, Huerth, Germany
Benoȋt C, Mazijn B (eds) (2009) Guidelines for social life cycle assessment of products. United Nations Environment Programme, Paris
Betula Manus (2017) Home – Betula Manus. http://www.betula-manus.de/en/home-en. Accessed 28 Mar 2017
Bioplastic Magazine (2012) Growth in PLA bioplastics: a production capacity of over 800,000 tonnes expected by 2020. Bioplastics MAGAZINE. Polymedia Publisher GmbH. http://www.bioplasticsmagazine.com/en/news/meldungen/PLA_Growth.php. Accessed 15 Dec 2016
Blank S (2013a) The four steps to the epiphany: successful strategies for products that win, 1st edn. BookBaby, Portland
Blank S (2013b) Why the lean start-up changes everything. Harv Bus Rev 91(5):63–72
Blidariu F, Grozea A (2011) Increasing the economical efficiency and sustainability of indoor fish farming by means of aquaponics-review. Sci Papers Anim Sci Biotechnol 44(2):1–8
Bocken N, Short SW (2016) Towards a sufficiency-driven business model: experiences and opportunities. Environ Innov Soc Trans 18:41–61
Braungart M, McDonough W, Bollinger A (2007) Cradle-to-cradle design: creating healthy emissions – a strategy for eco-effective product and system design. J Clean Prod 15(13–14):1337–1348
Carlsson D (2013) Aquaponics system: potentials in Northern latitude. http://miun.diva-portal.org/smash/record.jsf?pid=diva2:633765. Accessed 22 Feb 2017
Conforti P (2011) Looking ahead in world food and agriculture: perspectives to 2050. Food and Agriculture Organization of the United Nations (FAO). http://www.fao.org/docrep/014/i2280e/i2280e.pdf. Accessed 23 Jan 2017
Dean TJ, McMullen JS (2007) Toward a theory of sustainable entrepreneurship: reducing environmental degradation through entrepreneurial action. J Bus Ventur 22(1):50–76
Dorfman R (1993) Some concepts from welfare economics. Econ Environ 3:79–96
Drucker PF (1984) Converting social problems into business opportunities: the new meaning of corporate social responsibility. Calif Manage Rev 26(2):53–63
Elkington J (1997) Cannibals with forks: the triple bottom line of twenty-first century business. Capstone, Oxford
Ellen MacArthur Foundation (2013) Towards the circular economy. http://www.mckinsey.com/~/media/mckinsey/dotcom/client_service/sustainability/pdfs/towards_the_circular_economy.ashx
European Bioplastic (2016) Bioplastics market data. http://www.european-bioplastics.org/market/. Accessed 19 Dec 2016
European Commission (2012) Investing in success – research and innovation to boost growth and jobs in Europe. Publications Office of the European Union. http://ec.europa.eu/research/horizon2020/pdf/success-stories-h2020_2012.pdf. Accessed 13 Feb 2017
Festel G (2010) Industrial biotechnology: market size, company types, business models, and growth strategies. Ind Biotechnol 6(2):88–94
Figge F, Young W, Barkemeyer R (2014) Sufficiency or efficiency to achieve lower resource consumption and emissions?: the role of the rebound effect. J Clean Prod 69:216–224
Finnveden G, Hauschild MZ et al (2009) Recent developments in life cycle assessment. J Environ Manage 91(1):1–21
FNR (2017) Fachagentur für nachwachsende Rohstoffe e.V. https://energiepflanzen.fnr.de/. Accessed 18 Apr 2016
Freeman RE (1984) Strategic management: a stakeholder approach. Pitman, Boston, MA
Gallagher E (2008) The Gallagher review of the indirect effects of biofuels productions. Renewable Fules Agency. https://www.researchgate.net/publication/235704395 The_Gallagher_Review_of_the_Indirect_Effects_of_Biofuel_Production. Accessed 18 Apr 2017
Gilpin GS, Andrae ASG (2017) Comparative attributional life cycle assessment of European cellulase enzyme production for use in secondgeneration lignocellulosic bioethanol production. Int J Life Cycle 22(7):1034–1053. https://doi.org/10.1007/s11367-016-1208-4
Gürtürk A, Hahn R (2016) An empirical assessment of assurance statements in sustainability reports: smoke screens or enlightening information? J Clean Prod 136:30–41
Hahn R (2008) Sustainable development at the BoP – on integrated approaches beyond trade-off-thinking. In: Kandachar P, Halme M (eds) Sustainability challenges and solutions at the base of the pyramid: business, technology and the poor. Greenleaf, Sheffield, pp 446–461
Hahn R (2009) The ethical rational of business for the poor – integrating the concepts bottom of the pyramid, sustainable development, and corporate citizenship. J Bus Ethics 84(3):313–324
Hahn R (2011) Integrating corporate responsibility and sustainable development. J Global Respons 2(1):8–22
Hahn R, Kühnen M (2013) Determinants of sustainability reporting: a review of results, trends, theory, and opportunities in an expanding field of research. J Clean Prod 59:5–21
Hahn R, Reimsbach D, Schiemann F (2015a) Organizations, climate change, and transparency: reviewing the literature on carbon disclosure. Org Environ 28(1):80–102
Hahn T, Pinkse J et al (2015b) Tensions in corporate sustainability: towards an integrative framework. J Bus Ethics 127(2):297–316
Hansen EG, Schaltegger S (2016) The sustainability balanced scorecard: a systematic review of architectures. J Bus Ethics 133(2):193–221
Hatti-Kaul R, Törnvall U et al (2007) Industrial biotechnology for the production of bio-based chemicals – a cradle-to-grave perspective. Trends Biotechnol 25(3):119–124. https://doi.org/10.1016/j.tibtech.2007.01.001
Hediger W (1999) Reconciling “weak” and “strong” sustainability. Int J Soc Econ 26(7/8/9):1120–1144
Huber J (2000) Towards industrial ecology: sustainable development as a concept of ecological modernization. J Environ Policy Plan 2(4):269–285
IMF (2016) Primary commodity prices. http://www.imf.org/external/np/res/commod/index.aspx/. Accessed 15 Dec 2016
International Standard Organization (2006) ISO 14040: environmental management – life cycle assessment – principles and framework
Janda K, Kristoufek L, Zilberman D (2012) Biofuels: policies and impacts. Agric Econ Czech 58(8):372–386
Jolliet O, Brent A, Goedkoop M et al (2003) Final report of the LCIA definition study. Life Cycle Impact Assessment Programme of the Life Cycle Initiative
Kirzner IM (1973) Competition and entrepreneurship. University of Chicago Press, Chicago
Kollmann T, Kuckertz A (2010) Evaluation uncertainty of venture capitalists’ investment criteria. J Bus Res 63(7):741–747
Kuchler M, Linnér BO (2012) Challenging the food vs. fuel dilemma: genealogical analysis of the biofuel discourse pursued by international organizations. Food Policy 37(5):581–588
Kuckertz A, Mandl C (2016) Capturing the complexity and ambiguity of academic fields: determining consensual definitions for small business research, entrepreneurship and their shared interface. In: Berger ESC, Kuckertz A (eds) Complexity in entrepreneurship, innovation and technology research – applications of emergent and neglected methods. Springer, Berlin, pp 417–438
Kuckertz A, Wagner M (2010) The influence of sustainability orientation on entrepreneurial intentions—investigating the role of business experience. J Bus Ventur 25(5):524–539
Kuckertz A, Kollmann T et al (2017) Understanding, differentiating, and measuring opportunity recognition and opportunity exploitation. Int J Entrep Behav Res 23(1):78–97
Kühnen M, Hahn R (2017) Indicators in social life cycle assessment: a review of frameworks, theories, and empirical experience. J Ind Ecol. https://doi.org/10.1111/jiec.12663
Lewandowski I (2015) Securing a sustainable biomass supply in a growing bioeconomy. Glob Food Sec 6:34–42
Lewandowski I, Clifton-Brown J et al (2016) Progress on optimizing miscanthus biomass production for the European bioeconomy: results of the EU FP7 project OPTIMISC. Front Plant Sci. https://doi.org/10.3389/fpls.2016.01620
Mandl C, Berger ESC, Kuckertz A (2016) Do you plead guilty? Exploring entrepreneurs’ sensemaking-behavior link after business failure. J Bus Ventur Insights 5:9–13
McDonough WJ, Braungart M (2002) Cradle to cradle: remaking the way we make things, 1st edn. North Point Press, New York
Meadows D, Randers J, Behrens WW (1972) The limits to growth. Universe Books, New York
Meadows DH, Randers J, Meadows DL (2004) Limits to growth: the 30-year update. Chelsea Green Publ, White River Junction
Muñoz I, Flury K et al (2014) Life cycle assessment of bio-based ethanol produced from different agricultural feedstocks. Int J Life Cycle Assess 19:109. https://doi.org/10.1007/s11367-013-0613-1
Neugebauer F (2012) EMAS and ISO 14001 in the German industry – complements or substitutes? J Clean Prod 37:249–256
Neumayer E (2013) Weak versus strong sustainability, 4th edn. Edward Elgar, Cheltenham
OECD (2011) Future prospects for industrial biotechnology, OECD Publishing, Paris. https://doi.org/10.1787/9789264126633-en
OECD (2012) Recommendation of the council on assessing the sustainability of bio-based products – 17 July 2012 – C(2012)112 – C(2012)112/CORR1. http://webnet.oecd.org/OECDACTS/Instruments/ShowInstrumentView.aspx?InstrumentID=283&InstrumentPID=298&Lang=en&Book=False 17 July 2012 - C(2012)112 - C(2012)112/CORR1. Accessed 16 Jan 2017
OECD (2014) Biobased chemicals and bioplastics: finding the right policy balance. OECD Science, Technology and Industry Policy Papers No. 17 OECD Publishing, Paris. https://doi.org/10.1787/5jxwwfjx0djf-en
OECD/FAO (2016) OECD-FAO agricultural outlook 2016–2025. OECD Publishing, Paris. https://doi.org/10.1787/agr_outlook-2016-en
OECD.Stat (2016) OECD-FAO agricultural outlook 2016–2025 data. http://stats.oecd.org/viewhtml.aspx?QueryId=71240&vh=0000&vf=0&l&il=&lang=en. Accessed 16 Dec 2016
Osterwalder A, Pigneur Y (2010) Business model generation: a handbook for visionaries, game changers, and challengers. Wiley, Hoboken
Piotrowski S, Carus M, Carrez D (2016) European bioeconomy in figures. Ind Biotechnol 12(2):78–82. https://doi.org/10.1089/ind.2016.29030.spi
Raschka A, Carus M (2012) Industrial material use of biomass – basic data for Germany, Europe and the world. nova Institute of Ecology and Innovation. http://bio-based.eu. Accessed 12 Apr 2017
Reimsbach D, Hahn R, Gürtürk A (2017) Integrated reporting and assurance of sustainability information: an experimental study on professional investors’ information processing. Eur Account Rev. https://doi.org/10.1080/09638180.2016.1273787
REN21 (2016) Renewables 2016 – global status report. Renewable Energy Policy Network for the 21st Century. http://www.ren21.net/wp-content/uploads/2016/06/GSR_2016_Full_Report.pdf. Accessed 12 Apr 2017
Ries E (2011) The Lean startup: how today’s entrepreneurs use continuous innovation to create radically successful businesses. Random House, New York
Rocha FLR, Marziale MHP, Oi-Saeng H (2010) Work and health conditions of sugar cane workers in Brazil. Rev Esc Enferm USP 44(4):978–983. https://doi.org/10.1590/S0080-62342010000400017
Rockström J, Steffen W et al (2009) A safe operating space for humanity. Nature 461(7263):472–475
Roehm P, Koehn A et al (2017) A world of difference? The impact of corporate venture capitalists’ investment motivation on startup valuation. J Bus Econ. https://doi.org/10.1007/s11573-017-0857-5
Roos D, Hahn R (2017) Does shared consumption affect consumers’ values, attitudes, and norms? A panel study. J Bus Res 77:113–123
Sartor M, Orzes G et al (2016) The SA8000 social certification standard: literature review and theory-based research agenda. Int J Prod Econ 175:164–181
Savidov NA, Hutchings E, Rakocy JE (2007) Fish and plant production in a recirculating aquaponic system a new approach to sustainable agriculture in Canada. Acta Hortic (742):209–221. 10.17660/ActaHortic.2007.742.28
Schmidt-Bleek F (1998) Das MIPS-Konzept: Weniger Naturverbrauch – Mehr Lebensqualität durch Faktor 10. Droemer, Munich
Schneidewind U, Palzkill A, Scheck H (2012) Der Beitrag von Unternehmen zur großenTransformation. In: Hahn R, Janzen H, Matten D (eds) Die gesellschaftliche Verantwortung des Unternehmens: Hintergründe, Schwerpunkte und Zukunftsperspektiven. Schäffer Poeschel, Stuttgart, pp 497–528
Schumpeter JA (1934) The theory of economic development: an inquiry into profits, capital, credit, interest, and the business cycle. Transaction, Piscataway
Seabra JEA, Macedo IC et al (2011) Life cycle assessment of Brazilian sugarcane products: GHG emissions and energy use. Biofuels Bioprod Bioref 5:519–532. https://doi.org/10.1002/bbb.289
Seuring S (2011) Supply chain management for sustainable products – insights from research applying mixed methodologies. Bus Strateg Environ 20(7):471–484
Seuring S, Müller M (2008) From a literature review to a conceptual framework for sustainable supply chain management. J Clean Prod 16(15):1699–1710
Shane SA, Venkataraman S (2000) The promise of entrepreneurship as a field of research. Acad Manage Rev 25(1):217–226
Steffen W, Richardson K et al (2015) Sustainability. Planetary boundaries: guiding human development on a changing planet. Science 347(6223):1259855. https://doi.org/10.1126/science.1259855
Stierli M, Shorrocks A et al (2015) Global wealth report 2015. Zürich. https://publications.credit-suisse.com/tasks/render/file/?fileID=F2425415-DCA7-80B8-EAD989AF9341D47E
Swarr TE, Hunkeler D et al (2011) Environmental life cycle costing: a code of practice. Society of Environmental Toxicology and Chemistry (SETAC), Pensacola
United Nations Human Development Programme (2015) Human development report 2015: work for human development. Human development report, vol 2015. United Nations Development Programme, New York
Urban Farmers (2013) Business model. https://urbanfarmers.com/company/business-model/. Accessed 20 Feb 2017
Valdivia S, Ugaya CML et al (eds) (2011) Towards a life cycle sustainability assessment – making informed choices on products. UNEP/SETAC Life Cycle Initiative. ISBN: 978-92-807-3175-0
Van Lampe M (2007) Economics and agricultural market impacts of growing biofuel production. Agrarwirtschaft 56:232–237
Varian HR (2014) Intermediate microeconomic, 9th edn. W.W. Norton, New York
Visioverdis (2017) Company. http://visioverdis.com/english/company.html. Accessed 2 Mar 2017
von Weizsäcker EU, Lovins AB, Lovins LH (1996) Faktor Vier: Doppelter Wohlstand – Halbierter Naturverbrauch. Droemer, Munich
Wagner M, Kiesel A et al (2017) Novel miscanthus germplasm-based value chains: a life cycle assessment. Front Plant Sci. https://doi.org/10.3389/fpls.2017.00990
WCED (1987) Our common future. Oxford University Press, Oxford
Weidema BP, Bauer C et al (2013) The ecoinvent database: overview and methodology. Data quality guideline for the ecoinvent database version 3
Womack JP, Jones DT (1996) Beyond Toyota: how to root out waste and pursue perfection. Harv Bus Rev 74(5):140–158
World Bank (2016) World bank GEM commodities. http://data.worldbank.org/data-catalog/commodity-price-data. Accessed 19 Dec 2016
WWF International (2016) Living planet report 2016: risk and resilience in a new era. WWF International, Gland
Author information
Authors and Affiliations
Corresponding authors
Editor information
Editors and Affiliations
Rights and permissions
Open Access This chapter is licensed under the terms of the Creative Commons Attribution 4.0 International License (http://creativecommons.org/licenses/by/4.0/), which permits use, sharing, adaptation, distribution and reproduction in any medium or format, as long as you give appropriate credit to the original author(s) and the source, provide a link to the Creative Commons license and indicate if changes were made. The images or other third party material in this chapter are included in the chapter's Creative Commons license, unless indicated otherwise in a credit line to the material. If material is not included in the chapter's Creative Commons license and your intended use is not permitted by statutory regulation or exceeds the permitted use, you will need to obtain permission directly from the copyright holder.
Copyright information
© 2018 The Author(s)
About this chapter

Cite this chapter
Urban, K. et al. (2018). Markets, Sustainability Management and Entrepreneurship. In: Lewandowski, I. (eds) Bioeconomy. Springer, Cham. https://doi.org/10.1007/978-3-319-68152-8_8
Download citation
DOI: https://doi.org/10.1007/978-3-319-68152-8_8
Published:
Publisher Name: Springer, Cham
Print ISBN: 978-3-319-68151-1
Online ISBN: 978-3-319-68152-8
eBook Packages: Biomedical and Life SciencesBiomedical and Life Sciences (R0)