
Abstract
A differential settlement at the end of a bridge near the interface between the abutment and the embankment is a persistent problem for highway agencies, commonly called “bumps at bridge approaches”. There are many undesirable effects of these uneven and irregular transitions such as: decrease in steering response, distraction to the driver, added risk and expense to maintenance operation, in addition to reduction in a transportation agency’s public image.
A 2-D finite element model (FEM) was developed, using PLAXIS software package, and verified against results of six large scale laboratory experiments. The six experiments were conducted using a special well-established laboratory model at Texas A&M University, USA, called Bridge to Embankment Simulator of Transition (B.E.S.T.) device. The developed FEM was also used to investigate mobilized differential settlements at two bridge approaches within El-Minia Governorate, Egypt; the estimated mobilized bumps were also compared with available field observations. The results show good agreement between numerical model and field observations of mobilized bumps for the investigated two bridges. The presence of the transition slab reduces the differential settlement as it distributes settlements between each end of the transition slab. The developed FEM satisfactory estimated settlements at the end of the bridge. Mobilized bumps are less severe when there is a transition slab, appropriate fill material, and/or well compacted subgrade.
You have full access to this open access chapter, Download conference paper PDF
Keywords
1 Introduction
Islam (2010) defines the bump at the bridge ends saying “roadways and embankments are built on sub-grade foundation and compacted fill materials, respectively, that undergo traffic load induced compression over time that leads to settlements. Bridge settlements are usually much smaller than the settlement of the roadway and/or adjoining embankment, which results in considerable differential settlement at the intersection, consequently there is a noticeable bump that develops at the bridge ends”. Seo (2003) refers the causes for that differential settlement of approach slab to compression of the fill material, settlement of the natural soil under the embankment, high traffic loads, poor drainage… etc. According to Saride et al. (2009) the major contributing factors to the bump phenomenon are: consolidation settlements of foundation soil, poor compaction of backfill material, incorrect materials specification, poor drainage, soil erosion, seasonal temperature variations and types of bridge abutments. Briaud et al. (1997) reported many solutions to minimize settlement at the end of the bridge such as: building abutment and embankment on strong foundation soil, constructing concrete approach slab of sufficient design, using well-compacted or stabilized fills, using appropriated fill material (to provide strength and resist erosion), effective drainage, adopting good construction methods and inspection, and waiting for sufficient period and/or surcharging between fill placement and paving. Guiyu et al. (2004) reported that “the soft soil layer in embankment foundation should be reinforced to minimize the settlement of bridge approach”. Dupont and Allen (2002) recommended selecting high quality coarse granular fill material with high internal frictional characteristics to successfully construct the approach embankments.
According to Yasrobi et al. (2016), settlement of bridge approach slabs and their supporting backfill has been reported by more than ten Departments of Transportation (DOT) throughout the United States. Recent inspection reports from Wyoming Department of Transportation indicates that, bridge approach slab settlements occurred not only on existing bridges but also on newly built bridges that were recently opened to traffic. These settlements typically create voids ranging from 150 mm to 305 mm (6–12 in.) between the base of the approach slab and the geotextile reinforced backfill. Abu-Frasakh and Chen (2014) performed field testing and monitoring on instrumented concrete approach slabs in United States. They concluded that the bump that frequently develops at the end of the bridge is considered one of the major national bridge maintenance problems that challenge most DOT engineers.
Yenigalla (2011) presented an overview of few case studies on different mitigation techniques applied on bridge approach settlement problems at various locations in the state of Texas. The employed mitigation methods included: Polyurethane injection, soil nailing, and potential utilization of geofoam and flowable fill. In 2003, Seo, J.B. built B.E.S.T. device, shown in Fig. 1, to simulate the bump at the end of the bridge problem using sand and clay soils. Running the test for a week generated about 200,000 cycles of loading at 2.76 km/hr. The purpose of his tests was to study the various factors influencing the differential settlement between the embankment and the bridge and to develop alternative solutions for eliminating or minimizing this differential settlement. The other goal was to perform a B.E.S.T. test to simulate new bridges. He concluded several important factors affect the bump at the end of the bridge as: Young’s modulus of soil, average velocity of vehicles, average weight of vehicles, type of approach slab, and number of cycles. He also developed a program to accurately predict the settlement of the approach slab as a function of time. The B.E.S.T. device was designed with 1/20th scale of field condition to simulate the transition zone. Seo (2003) showed that it could be away to predict the settlement at the approach slab in the laboratory.

Photo and sketch of B.E.S.T. device (After Seo 2003)
A total of 16 tests were conducted by Seo (2003) to evaluate the effectiveness of the approach slab using B.E.S.T. device. He concluded that: the soil with the higher compaction (higher Young’s modulus) developed less bump at the slabs than the lower compaction soil (lower Young’s modulus). The increase in weight of vehicles has increases the bump and differential settlement similarly the velocity of vehicles does. The velocity of the traveling wheel in the BEST device has effect on the total settlement under the approach slab. Therefore, the velocity of traveling vehicles in the field should be taken into consideration when the approach slab develops the bump.
In the present research, a 2-D finite element program PLAXIS 8.2 Professional Version was used to simulate 6 selected experiments performed by B.E.S.T. device. Experimental results were compared with the estimations of the finite element analysis to check the validity of the chosen computational procedures.
2 Development of the Numerical Modell
2.1 B.E.S.T. Device Experiments
The B.E.S.T. device was constructed to carry out model tests on the approach slab, bridge, and pavement assembly. It consists of a laboratory-scale driven wheel guided around a circular track by a rotating arm as shown in Fig. 1. A motor in the center of the tank runs the wheel at various speeds. The wheel passes over the embankment, approach slab, and bridge once during each cycle around the track. The height of embankment and length of approach slab have 1/20th of typical field conditions. The sleeper and support slabs are placed under the approach slab with 1/20th ratio. The data obtained during a test are the elevations of the riding surface as a function of time and cycles. Sand and clay soils were used for the tests with different densities. Seo (2003) opted to use readymade porcelain clay blocks, prepared using high vacuum, to ensure reaching uniform and high densities. However, formed gaps between the clay blocks were filled and leveled with sand. Sand was placed in the tank except at the bridge sections, which were supported by columns on the floor of the device. The compaction was done by using a hand tamper with an area 20 cm by 20 cm and weighing 4.5 kg. Each test for the sand has three layers. To keep the density of the sand consistent throughout the tests, 90 and 30 blows/m2/layer for the high and low levels of compaction effort, respectively, at the approach slab sections. The pavement section was compacted 90 blows/m2/layer. The finished height of the embankment was about 25 cm. The pavement was made of 0.015 m plywood and simply placed over the embankment.
Basic soil tests were obtained for the sand and clay soil samples to determine their engineering properties. Sand and porcelain clay were used to simulate the embankment in the B.E.S.T. tests. Sand was placed in the tank except at the bridge sections, which were supported by columns on the floor of the device. The finished height of the embankment was about 25 cm. The pavement was made of 0.015 m plywood and carefully placed over the embankment. The velocity of the rotating arm is V0 (1 cycle/2 s, 6.89 km/h) with a various weight on the top of the wheel. To monitor the vertical acceleration of the wheel, an accelerometer was fitted on top of the wheel. Settlements were measured using an LVDT. Sixteen tests were done. Different conditions were used to evaluate the bump at the end of the bridge. Among the conditions, dry unit weight of soil, soil type, type of approach slab, wheel load, velocity of the wheel. In this paper the authors have chosen 6 tests to study the effect of the type of approach slab, the effect of soil type, the effect of the compaction on the bumps results as shown in Table 1, the results of numerical modeling, using PLAXIS 2D of these cases were compared with measurement of B.E.S.T. device experiments.
2.2 Numerical Modeling for B.E.S.T. Device Experiments
Numerical modeling for B.E.S.T. experiments is sophisticated 3D problem with moving loads. Hakeem (2013) simplified the problem to a dynamic 2D problem by:
-
1.
Introducing a correction factor to the sleeper settlements results from the 2D analysis to reach those results of the 3D analyses.
-
2.
Replacing the wheel moving load by an equivalent stationary load acting on the sleeper with variable intensity. The stationary load values were estimated in such a way to produce the same settlement values under the sleeper slab due to the moving load.
2.3 Comparison Between Experimental and Theoretical Results
Figure 2, shows the settlements under sleeper slab both measured in B.E.S.T. device and estimated by numerical model. Comparing the experimental and numerical results revealed the following:

The Settlement of the sleeper slab at different cycles.
A good agreement between experimental and theoretical results has been noticed in Cases (1), (5) & (6), along the entire range of cycles (i.e. up to 200000 cycles) with a maximum difference of about 0.3 mm. However, in case (4), good agreement continues only up to about 20000 cycles followed by a significant divergence of results. This divergence also appears in case (3) up to 30000 cycles yet combined with consistent difference of settlement values of about 0.7 mm along the entire range of cycles.
In case (2), a similar consistent difference of settlement values of about 0.4 mm is also noticed. These consistent differences may be referred to some errors in experimental measurements as will be explained in the following section. Divergence of results appeared in cases 3&4, both uses very loose to loose sand (γd = 13.40 KN/m3), could be referred to PLAXIS 8.2 Professional Version limitations. Loose sands exhibits large settlements which compresses the foundation soils and increase its density, and stiffness. PLAXIS does not cater for such enhancement of soil stiffness and hence over estimates the settlements accumulated with increase of cycles.
In general, Figs. 2 and 3 indicate that the developed PLAXIS model satisfactory estimated settlements at the end of the bridge with the increases in number of cycles. The consistent difference of settlement values between B.E.S.T. device measurements and PLAXIS model results, appeared in cases (2) & (3), may be referred to the following:

The relation between the settlement of B.E.S.T. device and PLAXIS model, illustrate the line of perfect agreement.
-
The voids between the clay blocks as shown in Fig. 4a.
Fig. 4. 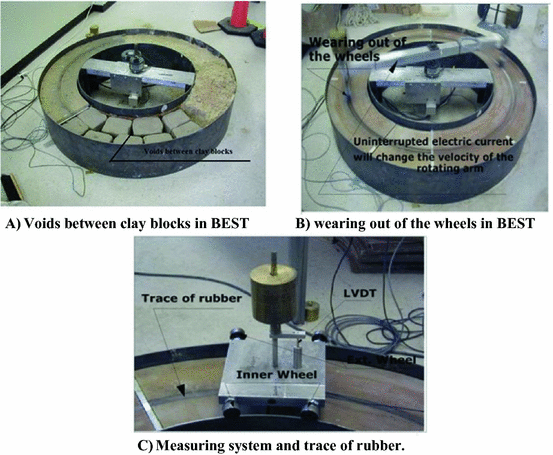
Preparation and operation of BEST model.
-
Probability of irregular density distribution for sand which was used as a pavement and approach slab base.
-
The traces of rubber on the top level of the model, due to wearing out of rotating wheels, as shown in Fig. 4b, which effected the measurements. In B.E.S.T. device, when the elevation of the roadway was to be measured, the test with the wheel was interrupted, the cart shown in Fig. 4c was placed, and the elevation was recorded with respect to the sides of the device through the use of an LVDT placed on the wheel. The presence of rubber traces reduced the measured settlement in B.E.S.T. device.

3 Two Case Studies for Bridges at El-Minia Governorate
Two bridges near El-Minia city were selected to investigate bump problems at the end of each bridge. Saft AL- Laban and Damaris bridges are located 12 km and 2 km north of the El-Minia city, respectively.
3.1 Numerical Modeling for the Two Bridges
The dynamic 3D modeling of this problem is sophisticated and very time consuming (number of loading cycles for Saft AL- Laban bridge reaches 247639 cycles after 8 years, for Damaris bridge reaches 361043 cycles after 10 years) which requires tremendous numerical efforts. Hence, the problem was simplified to a dynamic 2D problem in a similar way to B.E.S.T. model simulation by:
-
First, a moving load with a constant value was applied in a numerical model to calculate the stress under connection points. Applied moving load represented a car with single wheel load of 318 kN/m2 per axle.
-
This resulted in replacing the wheel moving load by for Saft AL- Laban bridge by a stationary load acting on sec. (A–A), (connection point between the roadway with the transition slab, as shown in Fig. 5a) and another stationary load acting on sec. (B–B), which connects the transition slab with the bridge as shown in Fig. 5b, both loads are with variable intensities.
Fig. 5. 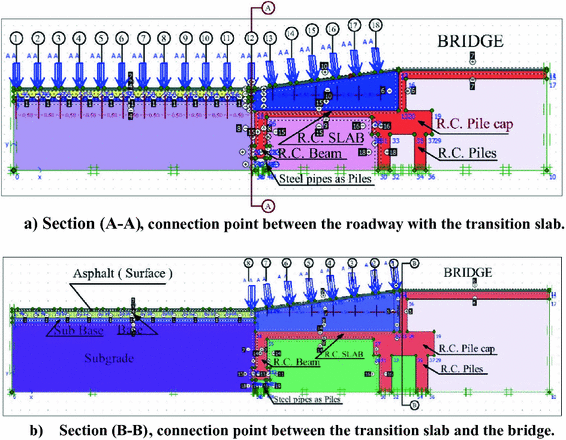
Points of applications of moving load to develop equivalent stationary loads with variable intensities at Saft AL- Laban Bridge.
-
However, in Damaris bridge, the wheel moving load by has been replaced by a stationary load with variable intensity acting on sec. (A–A) (the point that connects the roadway with the bridge as shown in Fig. 6). The stationary load values were estimated in such a way to produce the same settlement values under this point due to the moving load.
Fig. 6. 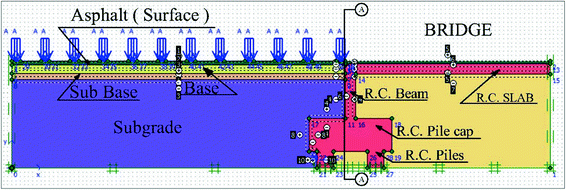
Points of applications of moving load to develop equivalent stationary loads with variable intensities at Damaris Bridge.
-
To estimate the total number of cycles, the Average Daily Traffic (A.D.T.) was determined. Egyptian Code for the Works of Urban and Rural Roads was used to obtain the equivalent load factor for traffic and to obtain growth factor. Finally, the ESAL number was determined; for example the total ESAL number was estimated to be around 0.215 × 10⁶ cycles after the first 7 years of operation.


The resulting stress profiles due to the moving load obtained from PLAXIS 8.2 Professional Version runs are shown in Fig. 7. Details of PLAXIS 2D model of Saft AL- Laban Bridge, which includes a transition slab connects between the bridge and the road are shown in Fig. 8. Details of PLAXIS 2D model of Damaris Bridge (without transition slab) are shown in Fig. 9.

Stress profile due to moving load. (Equivalent stationary load at the connection point)

Model of at Saft AL- Laban Bridge using PLAXIS 2D.

Model of Damaris Bridge using PLAXIS 2D.
The 15-node triangular element was selected for analysis for the 2D plain strain numerical simulation. Boundary conditions were assigned as full fixities at the bottom and rollers at sides allowing to the vertical movements. Interface elements, with interface ratio, R = 0.5, were assigned at interfaces between the foundation soil and the R.C. Beam, R.C. Slab, and R.C. Pile caps as shown in Figs. 8 and 9. A phreatic level was placed at the bottom of the geometrical model since the foundation soil was in dry conditions.
3.2 Material Models Parameters
Table 2 summarizes the developed parameters for the two bridges using similar procedures to development of B.E.S.T. Device model. Assumed parameters for reinforced concrete slab, reinforced concrete beam, reinforced concrete pile caps and reinforced concrete piles with parameters are as follows: Modulus of elasticity = 22.135 × 10⁶ KN/m2, Poisson’s ratio = 0.20, Unit weight = 25 KN/m3. In Saft AL- Laban Bridge, piles under transition slab were modeled as steel pipes with assumed parameters as follows: Modulus of elasticity = 2.0 × 10⁸ KN/m2, Poisson’s ratio = 0.30, Unit weight = 78.5 KN/m3.
4 Results
4.1 Measurement of the Actual Bump for the Bridges
For the two bridges, level surveying of six points at each section (total of 18 points) were taken measured June 2013 (i.e. after seven years from Saft Al- Laban Bridge construction, nine years from Damaris Bridge construction) and June 2014 (i.e. after eight years from Saft Al- Laban Bridge construction, ten years from Damaris Bridge construction). The six points were located at the center and the two edges of each section just before and after the bump, as shown in Fig. 10. The bump was calculated by subtracting the levels of each two pair of points across the bump. Then, the average bump height was calculated for each section. Results were recorded in Table 3 for Saft AL- Laban and Damaris Bridges.

Positions of selected points for Damaris Bridge, Section (A–A)
4.2 Field Measurements versus Results of Numerical Models
Figure 11 shows the settlement profile by time the two bridges. On the same figure, the results of numerical modeling, using PLAXIS 2D, were compared with measurement of the actual bump at bridge site to check the validity of the chosen computational procedures.

Settlement profile for Saft AL- Laban and Damaris Bridges.
Comparing the field measurements with the results of the numerical model revealed the following:
-
A good agreement between field measurements and theoretical results has been noticed in the two cases, with a maximum difference of about 4.34 mm and an average percentage difference of about 9.84% for all measurements.
-
The presence of the transition slab, in Saft Al-Laban Bridge) reduced the settlement by distributing it to each end of the transition slab.
5 Conclusions
Evaluating differential settlements (Bumps) at bridge approaches is a complicated 3D dynamic soil-structure interaction problem. A numerical analysis procedure was developed to simplify this problem to a dynamic 2D problem. Moving wheel loading was replaced by an equivalent stationary load of variable intensities in such a way to produce the some settlements. The 2D Finite element model (using PLAXIS) was then validated against results obtained by the large scale laboratory model (B.E.S.T.) device. Comparison of results revealed good agreement in settlement values obtained by PLAXIS model and measured in B.E.S.T. device.
The good agreement manifested in median sand and clay cases as well as in single and double-span approach slab cases. However, significant divergence of settlements results, increase with the increasing of cyclic loading, appeared in loose sand cases due to PLAXIS program limitations. PLAXIS 8.2 Professional Version does not cater for enhancement of soil stiffness associated with large settlements of loose sand and hence over estimates the settlements accumulated with increasing of cycles.
In addition, field investigations were conducted at two bridges in Minia Governorate, Saft Al-Laban and Damaris Bridges. The results show good agreements between the numerical model and the measurement of the actual bump at bridge sites. The results for two study sites show the capability developed numerical model using PLAXIS to simulate bumps at bridge approaches. The presence of the transition slab reduce the settlement by distributing it to each end of the transition slab.
Abbreviations
- E:
-
Young’s modulus (KN/m2)
- C:
-
Cohesion (KN/m2)
- \( \varvec{\nu} \) :
-
Poison’s ratio
- φ:
-
Friction angle (degree)
- Ψ:
-
Dilatancy angle (degree)
- E0 :
-
The Initial Tangent modulus (KN/m2)
- E50 :
-
The Secant Modulus at 50% Strength (KN/m2)
- σult :
-
The Asymptotic Value of the Stress for a Strain Equal to Infinity (KN/m2)
- m:
-
Power for Stress Level Dependency Stiffness
- \( \varvec{E}_{50}^{{\varvec{ref}}} \) :
-
Secant Stiffness in Triaxial Test (KN/m2)
- \( {\mathbf{E}}_{{{\mathbf{ur}}}}^{{{\mathbf{ref}}}} \) :
-
Unloading reloading Stiffness (KN/m2)
- \( \varvec{E}_{{\varvec{oed}}}^{{\varvec{ref}}} \) :
-
Tangent stiffness in oedometer test (KN/m2)
-
 :
: -
Soil Unit Weight above Phreatic Level (KN/m3)
-
 :
: -
Soil Unit Weight below Phreatic Level (KN/m3)
- I:
-
Moment of Inertia (m4)
- b:
-
Wood plate Width (m)
- h:
-
Wood plate high (m)
- A:
-
Cross Sectional Area (m2)
- EA:
-
Normal Stiffness (KN/m)
- EI:
-
Flexural Stiffness (KNm2/m)
- d:
-
Equivalent thickness (m)
 :
: :
:References
Abu-Farsakh, M.Y., Chen, Q.: Field demonstration of new bridge approach slab designs and performance. FHWA/LA. 13/520 (2014)
Briaud, J-L., James, R.W., Hoffman, S.B.: NCHRP Synthesis 234: Settlement of Bridge Approaches (The Bump at the End of the Bridge). Transportation Research Board, National Research Council, Washington, D.C. (1997)
Brinkgreve, R.B.J.: PLAXIS Version 8-Material Models Manual. Delft University of Technology & PLAXIS b.v., The Netherlands. In: Balkema, A.A. (ed.) Publishers Lisse, Abingdon, Exton (Pa), Tokyo (2002)
Cai, Z., Ross, R.J.: Mechanical properties of wood-based composite materials. General Technical report FPL–GTR–190 (1990)
Dupont, B., Allen, D.L.: Movements and Settlements of Highway Bridge Approaches. Report No. KTC-02–18/SPR-220-00-1F, Kentucky Transportation Center, Kentucky University, Lexington, Kentucky (2002)
Guiyu, L., Mingrong, S., Zhenming, S.: 3D FEM analysis of bridge approach settlement. Chin. J. Rock Mech. Eng. 23(1), 144–148 (2004)
Hakeem, B.M.: Investigation of bumps at bridge approaches. M.Sc. thesis, El-Minia University, El-Minia, Egypt (2013)
Hing, L.K.: Performance of multi-propped deep excavation kenny hill formation. M.SC. thesis, University Teknologi Malaysia (2008)
Islam, A.A.: On reducing bumps at pavement-bridge interface. Final report submitted to: YSU Center for Transportation and Materials Engineering (CTME). Youngstown State University, Youngstown, OH 44555 (2010)
National Center for Housing and Building Research. Egyptian Code to calculate the loads and force in the construction work and the work of buildings. The Arab Republic of Egypt, Ministry of Housing, Utilities and Urban Development, Code No.201, September 2012
Parolin, P., Worbes, M.: Wood densite of trees in black water floodplains of PioIau National Park, Amazonia, Brazil. Acta Amazonica 30(3), 441–448 (2000)
Saride, S., Puppala, A.J., Archeewa, E.: Bridge Approach Settlements-An Issue Due To Design Or Construction Practices. The University of Texas at Arlington, pp. 210–214 (2009)
Seo, J.B.: The bump at the end of the bridge: an investigation. Ph.D. thesis, Texas A&M University (2003)
Yasrobi, S.Y., Ng, K.W., Edgar, T.V., Menghini, M.: Investigation of approach slab settlement for highway infrastructure. Transp. Geotech. 6, 1–15 (2016)
Yenigalla, R.V.: An overview of mitigation strategies for settlements under bridge approach slabs. M.SC. thesis, The University of Texas at Arlington (2011)
Author information
Authors and Affiliations
Corresponding author
Editor information
Editors and Affiliations
Rights and permissions
Copyright information
© 2018 Springer International Publishing AG
About this paper
Cite this paper
Hassona, F., Hashem, M.D., Abdelmalak, R.I., Hakeem, B.M. (2018). Bumps at Bridge Approaches: Two Case Studies for Bridges at El-Minia Governorate, Egypt. In: Rodrigues, H., Elnashai, A., Calvi, G. (eds) Facing the Challenges in Structural Engineering. GeoMEast 2017. Sustainable Civil Infrastructures. Springer, Cham. https://doi.org/10.1007/978-3-319-61914-9_21
Download citation
DOI: https://doi.org/10.1007/978-3-319-61914-9_21
Published:
Publisher Name: Springer, Cham
Print ISBN: 978-3-319-61913-2
Online ISBN: 978-3-319-61914-9
eBook Packages: Earth and Environmental ScienceEarth and Environmental Science (R0)