
Abstract
The pressuremeter test is an in situ controlled load-deformation test that is performed on the wall of a borehole using a radially expanded cylindrical probe. From the test readings (volume variation based on controlled pressure), a plane deformation stress‐strain curve can be obtained for the soil.
Since the initial prototype, the pressuremeter has consistently been improved in its design, and the latest version of the pressuremeter, which is called the “auto-controlled Pressuremeter” has been developed to address the issues of repeatability and accumulation of approximations in a test. This apparatus is fully automatic and autonomous, and manages all steps of the test as instructed by the operator. The auto‐controlled Pressuremeter simplifies the work procedure for the operator, reinforces the reliability of the results, and reduces the time of set up.
The present paper describes the auto‐controlled pressuremeter, and compares it with the manual pressuremeter. The first part of the paper compares the deficiencies of the manual and auto‐controlled Pressuremeter. In the second part, test results of the two types of pressuremeter that have been performed in similar conditions are presented and commented.
You have full access to this open access chapter, Download conference paper PDF
1 Introduction
The pressuremeter test is an in situ controlled load-deformation test that is performed on the wall of a borehole using a radially expanded cylindrical probe. From the test readings (volume variation based on controlled pressure), a plane deformation stress‐strain curve can be obtained for the soil.
The first pressuremeter prototype was developed by Louis Ménard in January 1955. Since then, the pressuremeter has consistently been improved in its design.
The first pressuremeter prototype, which is called Type A, consists of a hand pump for injecting constant increments of water and a large probe with a diameter of 140 mm. After this first model, over the years, several prototypes have been designed by selecting better materials for pressure application, minimizing approximations, and improving the sensor and recording system; i.e. Types B, C, D, E, F, G, etc. (Cassan 2005).
Type G pressuremeter refers to devices with nested cell probes. Old notations GA, GC used in 1965–1966, correspond to pressure-volume controllers interchangeable with type G. For these devices, the guard cells are inflated with compressed air. The pressuremeter GB, has a totally different design, characterized by two guard cells inflated with water and by two volumeters.
From 1984, a pressuremeter identical to the GA was put into service, except that there is no differential pressure gauge. The latter is calculated by the operator from the pressures measured by gauges from the measuring cell and the guard cells. At present, it is the most used pressuremeter. Over three thousand pressuremeters have been built and used in all the word (over hundred countries).
Recently, there has been technological developments such as pressure gauges that connect to the circuit and allow working with automatic data acquisition (Geospad®). This system contains electrical recording components connected to pressure and volume sensors.
The last generation of pressuremeter follows the electronic and automatic technological developments. It is called the “auto-controlled pressuremeter” and has been developed to address the issues of repeatability and accumulation of inaccuracies in the test. According to ISO 22476‐4 standard, this apparatus is fully automatic, autonomous, and manages all steps of the test as preselected by the operator. The auto‐controlled pressuremeter simplifies the work procedure for the operator, enhances the reliability of the results, and reduces the time of preparation.
The first part of this paper describes the manual and the auto‐controlled pressuremeters. The second part of the present paper presents the process of correction of pressure loss provided by the auto-controlled pressuremeter. Finally, a comparison between tests that have been performed (in situ and in artificial ground) using the two types of pressuremeter, in similar conditions, are presented and commented.
2 Manual Ménard Pressuremeter –Type G
The manual Ménard pressuremeter consists of a CU (control unit), a plastic tubing and a 3-cell probe, which allow performing in situ tests according to the ISO 22476-4 and ASTM D4719-07 standards. The borehole is drilled to minimize wall disturbance and to keep the diameter of the hole in accordance with the selected probe size.
The CU is an aluminium box (86 cm × 43 cm × 26 cm), with a protective cover, standing on a 65 cm high tripod. It is handle transported, its weight is 24.5 kg (tripod, 3.5 kg) (Fig. 1). The tripod and level allow the vertical setting of the pressuremeter in all sites.

Ménard pressuremeter equipped with central unit computer (GeoBOX®) and central acquisition tool (Geospad®)
The CU consists of devices allowing the regulation of the applied pressure and the reading of the volume change. It includes an 800 cm3 sight tube volumeter for reading the volume changes of the measuring cell, regulators for both main and differential pressures, pressure gauges of 0 to 25 bars and 0 to 60 bars for both guard and measuring cells, and several valves and connectors (Fig. 1).
The probe is totally protected by a rubber cover (different types according to the soil stiffness), which is inflated by a gas in the 2 guard cells and by water in the measuring cell. The different cells’ applied pressures are controlled by the differential regulator to ensure a cylindrical deformation along the measuring cell and to avoid any adverse boundary condition. The pressure source is provided through an external nitrogen gas cylinder.
The pressuremeter can be equipped with system tools that allows instant display of test results via a central unit computer (GeoBOX®) and central data acquisition tools (Geospad®). It permits the automatic record of the test data and the specific test conditions and the visualisation of the evolution of the data during the test. The pressure of the measuring cell, the differential pressure, the volumes variation, the number of increments and time are displayed during the performance of the test. The records are automatically carried out after 0, 15, 30 and 60 s with optimized accuracy: 0.10 cm3 on the volume and 10 kPa on the pressures (in accordance to procedure B of ISO 22476‐4).
The acquisition tool (Geospad®), integrated into Ménard pressuremeter, is a waterproof box including 2 pressure sensors of 0 to 100 bars and an ultrasonic sensor for volume.
To perform the test, a borehole is drilled to minimize wall disturbance and to keep the cavity diameter in accordance with the probe size. The probe is lowered into the borehole to the required test depth and the pressure is applied by equal increments. Pressure and volume is read from the control unit. As soon as the probe is lowered into the borehole to the required test depth, the operator can start the test by pressure increments with the control unit.
2.1 Auto-controled Ménard Pressuremeter (Geopac®)
The main differences between the auto-controlled pressuremeter and manual pressuremeter is the method of application of the pressure and the volume and their measurement.
The pressurization of the guard cell is performed by a modulation of nitrogen gas from an external cylinder using a control pressure regulator and sets of solenoid valves. Two pressure intervals are considered: 0 to 7 bars with an accuracy range of 0.01 bars and 7 to 100 bars with an accuracy range of 0.1 bars.
Water pressurizing in the measuring cell is performed using electro-mechanical tools consisting of a DC electric motor of 24 V and a reducer with a normal torque of 24 N/m, a high ratio gearbox with an epicycloid stage gear train, a ball screw torque, a transmitter of pushing force, a pressure-transmitting sealing piston, etc. The electronic control allows the variation of the power associated with the electric motor to command the speed by using an incremental encoder of small resolution.
The mechanical part of the auto-controlled pressuremeter permits the transformation of the electrical energy into work pressure applied on the water circuit.
The performance tests, the analysis of operations and the approval of the model (electrical and mechanical) were performed and certified by an independent national organisation CETIM (Centre Technique des Industries Mécaniques, France) in 2010.
The auto-controlled pressuremeter (GeoPAC®) consists of an adapted piston in a cylinder driven by a precision micro-motorization and is entirely piloted by a control unit (GeoBOX®) with a wireless connection (Fig. 2). The pressure sensors chosen for the device are of a high-precision class, allowing the target pressure to be reached and regulated quickly without drift. The regulation ensures the simultaneous recording of data at the imposed times. The precision on the measurement of the volumes, of an order of magnitude never previously reached in manual pressuremeter test, is 1/100 cm3. The deformation at the interface between the probe and the borehole wall is therefore measurable with a resoluteness, depending on the type of probe used and its degree of expansion, relative to the loaded surface, in the order of 1 μm. Even before starting the soil tests, this precision is enhanced, due to the reliability and repeatability of the measurements, when the calibrations are carried out in series.

Auto-controlled pressuremeter (GéoPAC®)
When the test is performed, the operator records the initial parameters and specific conditions in the control unit, such as borehole number, depth of the test, pressure of first stage, etc. As soon as the probe is lowered into the borehole to the required test depth, the control unit can begin the test. All the sequences of the whole process of standard test are also automated: pressure loss, volume loss, pressure increments and pressure steps settings. During the entire process, the control unit computer shows the monitoring of the actual test on its screen (progression, view of the results in real time, line graph etc.). The operator can stop or modify the test progress from the control unit at any time.
The auto-controlled pressuremeter can measure volume and pressure respectively with the precision of 0.05 cm3 and 0.025 bar.
2.2 Principle of Pressure Loss Measurement
The pressure loss in a pressuremeter test is related to the tubing dimensions and the flow rate of the liquid circuit. For the classical Ménard pressuremeter, the regulation is usually performed after the test. Only auto-controlled pressuremeter is able de correct instantaneously the measurements by taking into account the regulation of the pressure loss. The adjustment of the pressure measurements depend on the pressure increment between two steps. In this phase, pressure should be increased to the next increment in an optimal time that does not exceed 20 s with adequate differential pressure between the liquid and gas circuits.
The differential pressure in the probe cannot be relied upon due to the overestimation of the liquid pressure when the pressure loss is not taken into account during the test. Indeed, at the nearest hydrostatic pressure, for a target differential pressure of 0.1 MPa and with a pressure loss of 0.2 MPa, the real differential pressure in the probe is then −0.1 MPa. The pressure regulation undergoes a strong disturbance around the target pressure. This regulation tends to decrease the flow rate when the measured pressure is near the set point, but the reduction in the flow rate causes a drop in the measured pressure (Arsonnet et al. 2013).
The control responds to this reduction by applying again the flow, which is translated by a phenomenon of oscillation going until the hydraulic circuit is excited (Arsonnet et al. 2013).
In the case of creep in certain levels (in the expansion of probe phase), the adjustment of flow in the liquid circuit is necessary to maintain the pressure constant. This flow creates a pressure loss, which adds to the probe pressure and results in the overestimation of the pressure by the sensor. The main consequence during the trial is that the differential pressure in the probe is not respected due to the overestimation of the liquid pressure and the pressurizing level is not made at a lower pressure that varies according to the instantaneous flow rate injected during this phase. This result is more evident in a calibration test where the creep is maximal and can cause intense oscillation in tests with long tubing.
To overcome these problems, the first approach for compensating the pressure drop was to identify the characteristics of the tubing, through laboratory tests, and to determine the coefficients of pressure loss per unit length (Fig. 3). The results show different tendencies lines as a function of tubing length. The auto-controlled pressuremeter also take into account the singular pressure loss in the entire hydraulic system, which can be varied significantly with the occasional or permanent sealing phenomenon: this is related to the in situ extended use of the hydraulic circuits tubing, their deformation during loading, and their repair by shortening and connector installation (Arsonnet et al. 2013).

Pressure loss as a function of flow rate for different tubing length (l = 25, 33, 50, 100 m) (from Arsonnet et al. 2013)
Therefore, the pressuremeter test always requires a minimum volume of liquid to be injected at the beginning of test and before the probe comes into contact with the wall of the drilled hole. The auto-controlled pressuremeter consists of an automatic identification procedure that instantaneously computes the coefficients of the loss pressure in the hydraulic circuit. This procedure, which is called the “pressure loss calibration procedure” is carried out automatically without intervention of the operator at the beginning of the test, based on the control of hydraulic flow.
Several “pressure/flow” points are measured at different flow rates after stabilization of the hydraulic circuit (Fig. 3). These points are then used to characterize the pressure losses by calculating the coefficients of their representative function. This function is used to correct the pressure measurements of the liquid circuit as a function of the instantaneous flow rate.
This solution, which has been developed exclusively by APAGEO for GéoPAC® auto-controlled pressuremeter, has many advantages and is of great interest. In fact, it is integrated into the test and runs seamlessly at start-up without affecting the test progress itself. The pressure loss covers the entire liquid circuit. The accuracy of pressures level of soil that represent a certain creep is significantly improved in the case for tests between the beginning of the creep and the end of the failure, which increase in repeatability and accuracy. The oscillatory phenomena are completely attenuated and controlled and the automatic regulation becomes more efficient and accurate.
From the report of CETIM (2010), the flow rate used in the design of GéoPAC® is 270 cm3/min. It is calculated from theses parameters: engine torque, engine reduction torque, piston travel speed and surface area, etc. Figure 4 shows the changes of pressure loss ΔP as a function of tubing length. The values of ΔP range from 0.07 to 0.26 bars.

Pressure loss ΔP as a function of tubing length
The stiffness of auto-controlled pressuremeter is defined as the ratio of the applied pressure to the corresponding injected volume. The injected volume is important at low pressures (several tens of cm3); whereas, for high pressure, the injected volume is very low (less than one cm3). An algorithm has been developed to control the injected volume at any instant and to compensate the variation in pressure.
The gain (defined as the ratio of the voltage to the pressure) is adapted so that the process of the control increases with the decrease of the errors in order to command the rotating the motor even for small deviations. An adaptive position control algorithm is also involved. A further synchronization is also implemented to maintain a constant pressure difference between the gas and the liquid pressures.
The inaccuracy obtained by the calibration is very important in manual pressuremeters, but is insignificant when using the GéoPAC®. In the auto-controlled pressuremeter, the difference between the pressure loss recorded for 10 m and 50 m of tubing is not important, is equal to 0.20 MPa for a volume exceeding 70 cm3, and corresponds to the value obtained from the equation shown in Fig. 3 that relates flow to pressure loss (0.187 MPa). The pressure loss is double this value in the manual pressuremeter (Fig. 5).

Volume variation as a function of pressure loss
2.3 Test Performed on Artificial Ground
The first set of tests were performed by the auto-controlled and manual pressuremeters on artificial grounds to eliminate errors due to the heterogeneity of soil and the effect of boring and installation of the probe. The artificial grounds were high density moulded sleeves of polyurethane elastomer that were 63 mm × 155 mm × 500 mm (Fig. 6). Two types of artificial ground were tested (70 and 90 Shore A) using tubing lengths of 10 and 50 m. According to the indentation hardness of materials (like polymers, elastomers, and rubbers) by using the durometer (ASTM D2240 scales), the 70 Shore A is equivalent to 20 bars of resistance for a probe that has a diameter of 60 mm reach a volume of 600 cm3. The 90 Shore A is equivalent to 30 bars of resistance. Table 1 summarizes the details of all pressuremeter tests that were performed on the artificial grounds.

Photograph of an artificial ground that was used for testing
Figures 7(a) and (b) show volume variations as a function of corrected limit pressure obtained from pressuremeter tests performed respectively on artificial grounds of 20 and 30 bars (70 and 90 shore A). Both tests show comparable results and the pseudo-elastic and plastic behaviours of the artificial grounds. All pressuremeter tests were performed using at least pressure increments. The volume variation measured with respect to time was recorded for each pressure increment at 15, 30 and 60 s after the application of pressure. The first levels (six to seven points) were derived with pressure increments of 0.05 MPa. For the final points, the pressure increment used was 0.1 MPa. The tests were completed when volume reached 600 cm3.

Volume variation as a function of corrected limit pressure from pressuremeter tests performed in artificial grounds of (a) 20 bars and (b) 30 bars
The limit pressure (2 MPa) obtained from either the auto-controlled or manual pressuremeter for 10 m of tubing corresponds to the real value of the limit pressure of the 20-bar artificial ground. The limit pressure value that was derived varied for the manual and auto-controlled pressuremeters respectively from 1.86 to 2.06 bars when tubing length was 50 m. For the 30-bars artificial ground, the limit pressure derived from the automatic pressuremeter shows more precision than what was measured by the manual device. The inaccuracy is not very significant and does not exceed 10%.
The auto-controlled and manual pressuremeters show comparable pressuremeter moduli for 10 m of tubing lengths for the two types of the artificial grounds. The values are slightly different when the length of tubing is longer (50 m), but the difference does not exceed 11%.
3 In Situ Pressuremeter Test
The second set of tests consisted a series of in situ auto-controlled and manual pressuremeter tests in Site located at Salvador Allende Road, Magny Les Hameaux, France. For both devices, the probes were initially calibrated (Fig. 8). The pressure and volume readings are then adjusted to compensate for the head of water (pressure loss) in the measuring cell tubing and the inertia of the probe (membrane and probe cover). The calibrations are required to determine the strength of the probe covers and membrane assemblies as functions of the expansion of the probe (volume variation) and the parasitic increase in volume variation in the entire apparatus as a function of the applied pressure.

In situ pressuremeter testing
The type of membrane and the number of cycles can affect the result. Authors’ experience shows that the strength of the probe (membrane) decreases as a function of the number of tests that are carried. The recorded volume-pressure curves allowed the strength of the membranes to be determined for injection volumes of 700 cm3 using 60 mm diameter probes. The pressure increment used was 25 kPa. The calibration curve obtained at the end of the test was the volume variation, reading at 60 s, as a function of the applied pressures.
The pre-expansion test of the probe is carried out in situ each time a new probe is used. The differential valve is adjusted to 0 m depth.
The expansion coefficient “a” is determined using a steel calibration tube that is usually 1.05 m in length and 65 mm in diameter. The test is carried out in 500 kPa pressure increments to 5 MPa.
The initial volume of the measuring probe cell is (AFNOR, NF P 94-110):
Where:
-
ls = the length of the membrane (210 mm),
-
di = inside diameter of the calibration tube,
-
Vc = the ordinate at the origin of the straight line, which gives the best fit with the second portion of the expansion curve (Fig. 9).
Fig. 9. 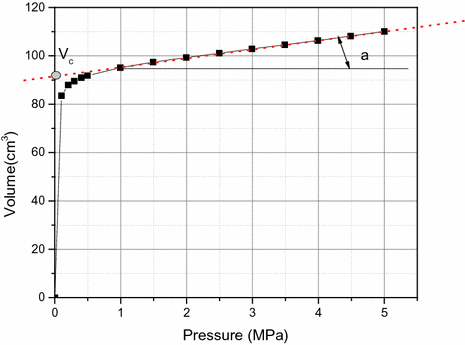
Expansion curve of a pressuremeter probe in a calibration tube

The dilation coefficient is then:
The coefficient a must be less than 6 cm3/MPa (0.6 cm3/bar) for a device that is equipped with 50 m of tubing. The recorded values of the expansion coefficient for the auto-controlled and manual pressuremeters were respectively 3.668 cm3/bar and 3.112 cm3/bar. The recorded Vc for the auto-controlled and manual pressuremeters were respectively to 91.795 cm3 and 83.857 cm3.
Table 2 summarizes the details of the second series of auto-controlled and manual pressuremeter tests that were performed in situ. The tests are carried to the depth of 4 m every one meter in pre-bored holes. The holes are drilled using a continuous flight auger with a diameter of 63 mm. The upper layers of soil consisted of sandy to clayey silt underlain by plastic clay. All pressuremeter tests were performed in at least 9 pressure increments. The auto-controlled test was performed with more increments to achieve a higher precision.
The diagrams in Fig. 10 show examples of the software output that was used to determine the various parameters of the pressuremeter (Geovision®): modulus, creep pressure and limit pressure from two tests carried out at 1 m using the auto-controlled pressuremeter. Both modulus and pressure derived from the auto-controlled pressuremeter, for the sandy silt, were slightly higher than those obtained from the manual pressuremeter.

Example of determination of soil proprieties using Geovision® software
Figure 11 show the results of several different tests. It can be clearly observed that there are differences between the values that are obtained by the auto-controlled and manual pressuremeters at the end of the plastic phase or near the limit pressure.

Results of the pressuremeter tests (expansion curve)
Figure 12 compares the results of the auto-controlled and manual pressuremeters. It can be observed that all moduli values derived from auto-controlled pressuremeter are slightly higher than those obtained from the manual pressuremeter in the first three meters. The creep pressures derived from the manual pressuremeter are consistently lower than those obtained from the auto-controlled one. The limit pressures are comparable in the first three meters; however, a small difference is noticeable at 4 m depth.

Modulus, creep pressure, limit pressure versus depth (auto-controlled and manual pressuremeters)
Figure 13 shows the software outputs used for the analyses of data (Geovision®) with pictures of extracted specimens and equipment used.

Output of software used for analysis of data (Geovision®)
4 Discussion and Conclusion
The main purpose of the present paper is the description of a new apparatus that is able to automatically perform a pressuremeter test. Such an automatic apparatus enables the geotechnical engineer to obtain repeatable measurements, and reduces inaccuracies that might be induced by the operator, uncertainties, and loss of head. Both in situ tests and tests performed on artificial ground demonstrate the feasibly of the auto-controlled test and the possibility to obtain good results. The performance tests, the analysis of operations and the approval of the model (electrical and mechanical) were conducted by an independent organisation CETIM (Centre Technique des Industries Mécaniques, France) in 2010. The inaccuracy obtained by the calibration is substantial when the manual pressuremeter is used; however, this value is insignificant when using the novel generation pressuremeter.
The solution of self-correction of pressure loss, developed exclusively for GéoPAC® auto-controlled pressuremeter, has many advantages and is of great interest especially in deep soils when using long tubing. In fact it is integrated into the test and runs at start-up without affecting the test progress. The accuracy of pressures of soil that represent a certain creep is significantly improved. The accuracy of pressures level of soil that represent a certain creep is significantly improved in the case for tests between the beginning of the creep and the end of the failure, which increase in repeatability and accuracy. The oscillatory phenomena are completely attenuated and controlled and the automatic regulation becomes more efficient and accurate.
The auto-controlled pressuremeter also makes it possible to carry out true cyclic tests, which can be performed by varying the amplitude or the frequency of the test in either cases of pressure or volume control. The cyclic(s) loading(s) can be easily programmed and the record is also possible using the central unit.
References
AFNOR, NF P 94-110: Sols, Reconnaissances et essais-Essai pressiométrique Ménard. French Standard, Edited by afnor, Paris-La défense, Publisher Location, July 1991 (1991)
AFNOR, NF P 94-110-1: Sols, Reconnaissances et essais-Essai pressiométrique Ménard, Partie 1: Essai sans cycle. French Standard, Edited by afnor, Paris-La défense, Publisher Location, January 2000 (2000)
AFNOR, XP P 94-110-2: Sols, Reconnaissances et essais-Essai pressiométrique Ménard, Partie 1: Essai avec cycle. French Standard, Edited by afnor, Paris-La défense, Publisher Location, December 1999 (1999)
ASTM Standards D2240-15: Standard Test Method for Rubber Property - Durometer Hardness. Published August 2015. Originally approved in 1964. Last previous edition approved in August 2015 as D2240 – 15. Developed by Subcommittee: D11.10 (2015)
ASTM Standards D 4719-07: Standard Test Methods for Prebored Pressuremeter Testing in Soils. Current edition approved Feb. 15, 2007. Published April 2007. Originally approved in 1987. Under the jurisdiction of ASTM Committee D18 on Soil and Rock and the direct responsibility of Subcommittee D18.02 on Sampling and Related Field Testing for Soil Evaluations (2007)
Arsonnet, G., Baud, J.-P., Gambin, M., Youssef, W.: Le GéoPAC®, un contrôleur pression volume automatisé pour les essais pressiométriques de qualité. The Geopac®, an Automated Control Unit for Quality Ménard PMTs. In: Proceedings of the 18th International Conference on Soil Mechanics and Geotechnical Engineering, Paris 2013. Parallel session ISP 6 (2013)
Cassan, M.: Les essais pressiométriques et leurs applications en France. Rappels Historiques et état des connaissances. The pressuremeter test and their applications in France. Historical Summary and Sate of the art. 50 ans de pressiomètres. Vol. 1 Gambin, Magnan et Mestat (ed.) Presses de l’ENPC/LCPC, Paris (2005)
Rapport of CETIM: Conception d’un contrôleur pression/volume automatique. CETIM, Centre Technique des Industries Mécaniques, France, 19 Février 2010 (2010)
ISO 22476-4: Geotechnical investigation and testing—Field testing—Part 4: Ménard pressuremeter test. Reconnaissance et essais géotechniques – Essais en place – Partie 4: Essai au pressiomètre Ménard. International Standard. First edition 2012-12-01. Published in Switzerland (2012)
Acknowledgments.
The authors gratefully appreciate the help provided by Damien Brechot, Vincent Brousset, Lionel Daré and Jean Pierre Arsonnet from APAGEO Company during the carried out experimental work and Hamidi Barak for the review of the present paper.
Author information
Authors and Affiliations
Corresponding author
Editor information
Editors and Affiliations
Rights and permissions
Copyright information
© 2018 Springer International Publishing AG
About this paper
Cite this paper
Frikha, W., Varaksin, S. (2018). Auto‐Controlled Ménard Pressuremeter: A Novel Tool for Optimal Use of the Pressuremeter. In: Frikha, W., Varaksin, S., Viana da Fonseca, A. (eds) Soil Testing, Soil Stability and Ground Improvement. GeoMEast 2017. Sustainable Civil Infrastructures. Springer, Cham. https://doi.org/10.1007/978-3-319-61902-6_20
Download citation
DOI: https://doi.org/10.1007/978-3-319-61902-6_20
Published:
Publisher Name: Springer, Cham
Print ISBN: 978-3-319-61901-9
Online ISBN: 978-3-319-61902-6
eBook Packages: Earth and Environmental ScienceEarth and Environmental Science (R0)