
Abstract
Demand factors are understood to play a substantial role in the experience of workload in rail signalling operations. Quantifying these demand parameters in signalling operations can inform both decisions about operational practice as well as technology design. To date, however, tools to estimate demand have either relied on assessor judgement of static or aggregated parameters, can be time-consuming to produce, and challenging when a workstation is changing or being developed. In order to anticipate the evolution of railway signalling, the Dynamic Modelling of Operator Demand (D-MOD) tool uses signalling simulation to derive accurate demand parameter measurements. This paper presents the architecture and design of the D-MOD platform, as well as the types of parameters that have been identified and quantified. Different categories of parameter, including static, dynamic and performance parameters have been captured and validated. Future directions for the tool are discussed.
1 Introduction
There has been a steady transition from distributed, physical control of railways in signal boxes located close to their area of control, to centralised control centres, sometimes located at several miles from their controlled area. Recently, the appearance of automation has further reduced even more the physical actions required by signallers, putting them in a more intense monitoring role [1]. These modifications have generated major changes in terms of signalling tasks, shifting from physical to cognitive tasks, and requiring the consideration of an increasing level of information from expanding areas of control. Great Britain, like many other countries, is experiencing further, rapid transition with the launch of new Traffic Management Systems (TMS), which brings greater unification of the traditional signalling/dispatch type function with higher order traffic replanning functions into a single role. This will have several consequences on organisation of work, workstation boundaries, and number of staff. All of this is taking place at a time of unprecedented demand on the railway system that must seek new ways of generating capacity within the existing infrastructure wherever possible [2].
The rail sector is cognizant of the need to design both technology and processes (including timetables, and planning of track maintenance) with a view to their implications for workload for those who regulate trains [3]. A key component of workload is the demand associated with running a particular service pattern over a given area of infrastructure. [3] conceptualise the relationship as overt task characteristics, leading to specific signaling goals and an imposed load. Combined with internal load, perceived load and individual characteristics, an input load generates demands that lead to effort, effects on performance and wellbeing and, ultimately, the work result. The challenge to date has been to capture and articulate the nature of the task characteristics. These task characteristics underpin demand, and therefore drive both objective and experienced workload, but are highly sensitive to the very specific nature of not only the workstation, but the physical reality of the geography and traffic that are controlled through the workstation [4].
While tools such as ODEC [5] and Presto [6] are available, and have a successful pedigree within rail workload, there are limitations
-
(1)
Tools such as Operational Demand Evaluation Checklist (ODEC) involve quantifying key parameters that represent demand, and therefore shape workload. Some of these are static infrastructure parameters (e.g. numbers of points in the area of control) but the relevance of some of this infrastructure (e.g. how often a point is actually used or not) is rarely accommodated in the estimate.
-
(2)
Additionally, tools such as ODEC aim to capture more dynamic operational factors such as number of services per hour or day. The limitation is that these numbers are averages based on the timetable and may fail to capture the experience of running the service. For example, are the trains regularly spaced or do they come in clusters and/or involve combinations of fast and slower or freight trains? This is crucial given that workload is generated as much by a small but concurrent tasks, including regulation decisions, as it is by significant singular events [7].
-
(3)
For both of the above points, this data are captured through inspection of the workstation and timetable and discussion with the staff controlling them. This requires experience, and time, and is open to variability and interpretation with less experienced assessors.
-
(4)
While tools such as Presto more accurately capture time occupancy for particular infrastructure, the challenge is to have accurate timetable information and models of the infrastructure. This may be particularly problematic when the infrastructure is at a design (or re-design) phase.
The solution to these problems is to have a tool that can accurately and objectively capture the demand-shaping characteristics of a work-station. Furthermore, it should do so in a manner that captures not just static or averaged demand estimates, but can reflect moment to moment changes in demand resulting from the interaction between trains and the infrastructure. Finally, it would be highly desirable that planned changes and design options could be reviewed (for either infrastructure or timetable) as well as being able to evaluate current operations.
The Dynamic Modelling of Operational Demand (D-MOD) project [8, 9] is a collaboration between Hitachi Information Control Systems Europe and the University of Nottingham Human Factors Research Group. Funded as a 2 year Knowledge Transfer Partnership, the project aimed to apply Hitachi ICSE’s (HICSE) capability in providing signalling simulation software and tools to the problem of workstation demand measurement. The remainder of this paper describes existing measures of demand and workload in the rail signalling domain. It then discusses the architecture of the D-MOD platform, before presenting the types of measures that are possible. The paper then presents indicative test results, concluding with ideas for how the tool could be used in future.
2 Existing Measures
Many demand simulating tools exist and have been applied to many domains such as aircraft, defence, nuclear, automobile. [10] used Dynamic Density (DD) metrics to measure and predict air sector complexity. This model based on mathematical variables includes several complexity factors which are defined as the reason that contributes to the difficulty. Their algorithms were tested with a panel in order to compare DD predictions with subjective workload ratings through regression analysis. The results obtained through regression analysis showed coherent results between subjective rating and DD predictions.
Aldrich et al. [11] introduced a workload computer model in 1989 called the VACP model (Visual, Auditory, Cognitive and Psycho-motoric) applied in defence. This model is based on task analysis and task demands, in which each task demand is detailed in micro entities which are then linked with a resources, time to perform an action/mental process, and complexity or estimated workload ratings provided by experts. This method provides good prediction of workload profile but requires a lot of time dedicated for the task analysis, and provides a granularity for the results which are sometimes not required. Balfe [9] also confirmed this point of view after applying a similar method called Multiple Resource Questionnaire in a signalling study.
In railway several tools have been developed: such as ODEC (Operator Demand Evaluation Checklist) [5], PRESTO [6] (Prediction of Operator Time Occupancy), AAT (Activity Analysis Tool) [5], IWS (Integrated Workload Scale) [5] and ASWAT (Adaptative Subjective Workload Tool) [5]. ODEC is a tool which provides an indication of the workload associated with a workstation by the study of its operational rules, infrastructure features and events that can occur. Key factors listed in the checklist (number of trains, number of phone calls), are mostly objective and provided by control centres through data analysis. This method is applied in the railway and known to be efficient, easy to set up, however the output it can provide is sometimes viewed as “limited”: results obtained cannot help in the definition of solutions to be adopted in context of high and medium workload. Furthermore, the level of detail of the analysis sometimes omit important information about the traffic pattern and its operation (i.e. parameter “number of regulating locations” is probably not sufficient to describe regulating tasks).
AAT is another objective method which aims to record signallers activities during a day, provides indications on when, how long, and why these activities were performed (i.e. 5 min phone call at 10am: due to point failure). This technique is very useful in order to provide an indication of the distribution of signallers activities in terms of time and amount of tasks performed in parallel. This method is sometimes considered as limited in some human factors studies to the extent that even if activities are objectively tracked, and workload is not necessarily proportional with the amount of activities performed by the signaller.
PRESTO is another objective method which allows the definition and replay of a signalling scenario in a subarea of the workstation. This method is presented as a software in which the human factors professional is invited to enter information from the workstation (level crossings, routes, reaction time, phone calls duration…), a simulation is then made which consist in running the trains according to the timetable in the workstation. Outputs provided are detailed as much as in the AAT analysis, and also include a prediction of the level of occupation of the signaller. This tool h is efficient and provides a good overview of the traffic pattern and operation. However, the overheads in terms of time and effort for the analyst can be high.
IWS and ASWAT aim to capture the signaller’s perceptions of workload using different rating scales. IWS rating scale focus on the rating of the perception of the demands and way to cope with them. ASWAT focus more on the rating of indicators such as time pressure, mental effort and pressure (same principle as NASA TLX [12] method). These methods are applied worldwide and succeeded to capture relevant data, which confirms their relevance and consistency. However, Human Factors professional often feel the need to complete these subjective methods with more objective data as the focus on subjective methods only provide subjective inputs and thus different point on views depending on individuals.
Other researchers [6, 13], have further methods using complexity/weighing ratings to quantify signalling effort during regulating context. These methods consisted in describing regulating tasks into different demand factors which can be measured (number of regulating locations, number and types of train movements, number of movements in parallel etc.) and can be factorised according with complexity rules defined.
In the context of our project, the requirements linked with the existing simulator called TREsim were clear from the beginning: the new module D-MOD must include parameters related with the infrastructure, timetable and technology – as these are data with which the simulator is actually working. Data shall be as much as possible objective to provide indicators totally external from human point of view (this is reinforced by the fact that subjective tools already exist and efficient). Manual inputs can be provided to add external data to the analysis but has to be limited and controlled. Keeping in mind these requirements, the D-MOD project started with a wide exploration of existing human factors tools (described above) in the railway and other domains, capable to evaluate workload related with task demands. In parallel, an internal study on demand parameters was performed with signalling experts from HICSE. From these studies, we extracted a preliminary list of demand parameters which were analysed in collaboration with a Subject Matter Expert. After this analysis, the project had to take a first direction to build its first proof of concept software in order to evaluate the capacity of the simulator to deliver awaited data. The analysis of the simulating tools pointed towards ODEC as a starting set of parameters, as it provides an indication of task demand with an acceptable level of granularity for our proof of concept: “ODEC is related to the view that workload is a function of the work that loads, and thereby a demand independent of the individual, and assesses the key factors of the system within which a rail signaller works which might impact on their workload” [3].
3 Architecture
TREsim is a simulator platform, primarily used for the training of new signallers, familiarisation of existing simulators with design or process changes, or new locations, and with the ability to replay events both derived from the simulator or capture through operational data. As well as giving feedback on performance, TREsim allows the introduction of faults or events into a signalling scenario. TREsim is integrated with a larger portfolio of tools allowing the testing of new signalling scheme designs, or integration with automatic route setting. Critically, the TREsim platform is very high fidelity, with accurate models of trains, timetable and infrastructure that can faithfully recreate actual or envisioned operational scenarios.
TREsim is divided into two entities, see Fig. 1: one signaller (trainee) workstation, and one observer (trainer) workstation. Underpinning the TREsim platform are a number of elements that, as well as enabling the simulator, also enable demand estimation.

Overview of TREsim simulation suite.
-
Infrastructure model – each simulated workstation has a model of the track, including points and signals, it comprises. Therefore it is possible to scan this model to quantify any modelled infrastructure elements to capture potential demand shaping parameters (e.g. number of points, number of platforms).
-
Timetable model – this is a model of the planned trains for a workstation. As well as generating trains to run on the simulation, this model can also be scanned to calculate number of trains (and types of trains) expected for a given timetable (e.g. number of trains per day, per hour). There is also a timetable editor.
-
Train movement simulator – this generates the movement of trains across the workstation given either a planned train according to the timetable, or as inserted by an assessor in real-time (e.g. to simulate the arrival of an unplanned freight train). The train movement simulator therefore presents an accurate simulation of actual (rather than aggregated) train movements.
-
Interlocking simulation – this functional aspect of the simulator allows a realistic recreation of signal and route setting given input from either a signaller or an automated route setting module. As a result, permission cannot be granted to another route once a route is set or a train is in a signalling section, thereby preventing collisions between trains. Therefore, once routes have been set and trains are moving across a workstation, the impact of these events is linked realistically to the availability of other infrastructure, which can be a source of demand or impact performance.
-
Faulting and scenarios – The assessor has control over events such as infrastructure faults, arrival of unplanned trains, or can mimic phone calls to the signaller using the simulator. In real-time use of the simulation, this can generate demand, with a subsequent implication for performance. Additionally, faulting can be used to restrict infrastructure and therefore change the more static parameters that can be scanned to calculate demand.
-
Automatic route setting – Many workstations in Great Britain are now supported by some form of automatic route setting, and many of the simulated workstations available on TREsim are therefore supported by automation. This allows many simulation scenarios/timetables to be run with minimal intervention from a signaller.
When running in combination, all interactions from the signaller or automation, and impact on the interlocking, can be recorded. Additionally, all train movements, including delays and deviations from the timetable, down to positions in specific track sections, are also recordable. As a result, a high level of accuracy of both planned and actual train movements is possible. The D-MOD proof of concept has been developed to include different functionalities to enable end-users to perform their analysis in an accurate and optimised way.
Here are listed below some of the main functions of the software:
-
A “navigation tree” providing information about the TT, start time, workstation simulated and displaying the list of areas created by end-users.
-
A “period” tool enabling end-users to choose an hour/day slot for results granularity.
-
A “colour filter” tool enabling end-users to have access to the most busy/used places in the infrastructure.
-
A “selection area” tool enabling end-users to select any portion of the workstation that requires an evaluation.
And different tabs displaying results:
-
Data tabs: external parameters available in control centres can be entered manually and complexity levels (high/medium/low) are listed in these tabs (see Fig. 2).
Fig. 2. 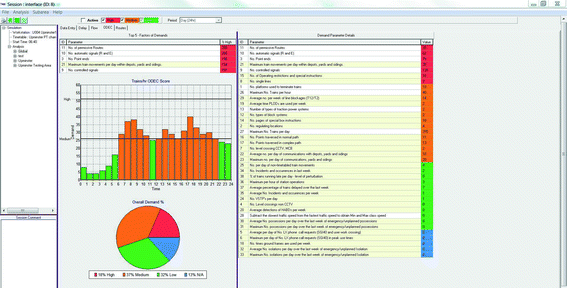
D-MOD demand dashboard incorporating tabbed interface for different parameters. The current view shows ODEC scores on the right with a calculation of trains per hour on the left. Red, orange and green indicates high, medium and low ODEC scores. See [5] for further explanation. (Color figure online)
-
ODEC tab: ODEC results of each D-MOD parameters are displayed in these tabs, as well as a graph displaying the number of timetabled trains per hour.
-
Flow tabs: train traffic is displayed. These tabs report both the expected number of timetabled trains and the number of trains in a simulation run. These indicators aim to reflect signallers work according to a timetable and the feasibility of a timetable.
-
Route tabs: total of route sets manual/ARS is reported.

4 Parameters
From the architecture described above a number of classes of parameters are open to capture. These are:
-
(1)
Static infrastructure parameters – These are parameters based around the unchanging aspects of the infrastructure for a given workstation design, such as the number of points. For the purposes of proof of concept, several of these parameters have been adopted from ODEC. The advantage of D-MOD is that they can be calculated swiftly and accurately.
-
(2)
Aggregated parameters – These are parameters regarding train movements but, as per the original ODEC, rely on aggregated totals. However, with D-MOD they can be calculated swiftly and accurately, and include detail regarding the headcode of the services involved.
-
(3)
Dynamic parameters – These are parameters arising from running trains and the inputs required to regulate them. This can be captured in great detail (specific train movements or specific route settings at a sub-second accuracy), that in practice can be averaged at an appropriate level of granularity.
-
(4)
Performance parameters – As well as generating data regarding demand on the workstation, TREsim also generates metrics of performance. This can be in terms of delay accumulated, though signallers may also be able to improve the delay associated with trains that arrive on the workstation in a delayed state. Also, recording specific events such as trains approaching red signals can be used as a measure of safety, as approaching a red signal when this is not in accord with usual operations or timekeeping increases the risk of a signal passed at danger [15].
Table 1 presents a list of these categories with indicative parameters, along with the origin of that parameter – ODEC indicating a parameter taken from the ODEC tool, whereas D-MOD indicates a parameter that has been developed specifically within the context of the current project.
5 Validation
Following on from a phase of requirements, software development and piloting [6], the project has looked to validate a number of performance metrics. Prior evaluation activities in the project have demonstrated the general feasibility of quantitative demand measures, showing that static demand measures can be rapidly captured from a workstation simulation. Additionally, dynamic demand measures can be captured and show surface validity in comparison to other forms of demand and workload analysis such as AAT. However, to date these pilots had been conducted on only one type of workstation, and had not included performance measures. Therefore, the final phase of validation had two aims:
-
1.
To demonstrate the feasibility of capturing performance measures - in this case cumulating delay and number of trains stopped at a red signal. NB Those signals where trains routinely stop at a red signal (e.g. at the end of a station platform can be and, in this case, were filtered out of the analysis).
-
2.
To demonstrate that the metrics could be applied to a different workstation.
The validation was therefore conducted with a new workstation (Upminster) under three conditions – with normal operating conditions with or without automation and a third trial without automation and with an unplanned delay. This was a train running at a restricted speed resulting in a queue of trains building behind until the issue was resolved. In each scenario an experienced signaller operated the workstation therefore static, dynamic and performance data were generated. Each trial was conducted in real time covering approximately one hour of service (7.30am to 8.30am) at the morning peak. The delayed train was inserted at 7.29am. To provide more feedback on scenario complexity, the Integrated Workload Scale (IWS) tool was used to provide measures of the signaller’s workload reported every 1 min. This subjective tool aimed to provide additional information about workload variation. Also AAT was used to check the signallers interactions with the workstation against the automated measures.
Scenario Results.
Figure 3a, b and c show graphs of several key dynamic and performance parameters.

a, b and c – Demand and performance measures for automated and non-automated normal condition, and non-automated with delay. X axis represents 5 min time blocks for period of evaluation. Y axis represents counts for number of trains, minutes of cumulating delay, number of timetabled trains, number of trains stopped at red signal and number of manual routes set.
Actual and timetabled trains – The data shows a steady increase from the start of the scenario up to typically 19 or 20 trains concurrently on the workstation. In all three scenarios the operator (and in scenario 1, the combination of operator and automation) is able to able to keep pace though delay in both manual conditions is significant.
Number of manual route sets – Scenarios 2 and 3 indicate significant levels of input from the operator to maintain the service. In particular, there is a building spike in scenario 3 around 8.10 min where the signaller is working to clear the backlog of trains that has built up behind the slow running service. The number of routes set by the signaller is greatly reduced in the automated condition (1) but still involves a peak of input around 8.00am.
Cumulating delay – There is a large cumulating delay in scenario 3, demonstrating the viability of this metric. Notably, the cumulative delay drops to a similar level as other scenarios as the signaller is able to work clear the backlog.
Number of trains stopped at a red signal – There is a small increase in the number of trains held at a red signal in scenario 3 over the other two scenarios. This, again, indicates the ability to extract this metric from the simulation, though it may be more useful in other scenarios (e.g. if a very inexperienced signaller was working the panel, or the delay was more severe).
Finally, while the data are not presented here, it is possible to drill down into further detail on many of these parameters. For example, it is possible to show how delay accumulates for any specific train service, to list the trains that are on the workstation for any given instant and thereby compare over scenarios, or identify which trains are held by which specific red signals. This analysis could be essential for identifying specific sources of demand or impacts on performance.
6 Discussion
The work completed so far has demonstrated the feasibility of capturing both demand and performance for a different workstation from the one previously used as the basis of trials. Critically, the generation of the data presented here is near instantaneous, and therefore provides a major saving in the time of the human factors assessor. The emphasis on work to date has primarily shown the feasibility of capturing the kind measures presented in Table 1. The next step is to validate these measures are representative of actual events. The work to date [8, 9] and review by subject matter experts of trails data so far strongly indicates good validity on this data, but this validation can be formally confirmed by correlation between the data presented here, and other sources of data such as AAT and IWS captured during trials.
It is important to note that this approach does not invalidate other tools that have previously looked to capture demand. Rather, it is anticipated that the rich source of data that is available through the D-MOD tool can facilitate these other tools by allowing their rapid capture. Indeed, one of the anticipated benefits of D-MOD is that it can expedite the practical process of capturing most specified demand and performance measures in support of the development of new theory of demand and workload. For example, one aspiration would be to use the measures presented here in combination with eye-tracking or physiological data. The combination of different types of data raises a more general point that, to date, the data streams that have been captured have been treated as distinct. That is, there has been no attempt yet, other than through visual inspection of the results, to link one parameter with another. A future development of D-MOD would look to couple data streams together. For example, can the setting of specific routes or the approach of trains to specific regulation points be linked to specific sources of demand? Another use of D-MOD that has been considered is also how strategies of signallers may differ and how this might link to sources of demand and performance.
There are three limitations of D-MOD tool and process. First, as noted above, there needs to be more concrete comparison between existing measures such as ODEC and the data generated by the D-MOD tool. Second, is that the tool is currently only concerned with demand associated with the core tasks of managing the workstation. In practice, many other tasks can be a source of demand including the communications with other rail staff or public, completing or reading paperwork associated with protection arrangements, or dealing with level crossings [17]. It may be possible to ‘overlay’ non-signalling events into a scenario to indicate time occupancy. Related to this point is the third limitation, that D-MOD is focused on demand at this stage and rather than the implications for workload. At some point, the D-MOD tool could be use D-MOD to study the tighter coupling between either demand or performance (as knowing you are behind the timetable may be a considerable source of pressure), in order to establish the link with experienced workload.
7 Conclusion
The changing face of rail signalling demands new approaches to anticipating the workload implications for those operating the network. The D-MOD project has applied simulation capabilities to help in the quantification of one crucial aspect of workload, operational demand. It goes beyond existing tools (though can also accommodate and complement these existing tools) by providing a platform for the rapid capture of static workstation characteristics and detailed data on dynamic demand and performance factors. While the D-MOD tool is yet to cross the bridge between demand and experienced workload, the aspiration is that D-MOD can present a valuable tool in both the practical development of workload assessment tools for signalling, and serve as a research incubator for the development of theory.
References
Sharples, S., Millen, L., Golightly, D., Balfe, N.: The impact of automation on rail signalling operations. Proc. Inst. Mech. Eng. Part F: J. Rail Rapid Transit 244, 1–13 (2010)
Wilson, J.R., Farrington-Darby, T., Cox, G., Bye, R., Hockey, G.R.J.: The railway as a socio-technical system: human factors at the heart of successful rail engineering. Proc. Inst. Mech. Eng. Part F: J. Rail Rapid Transit 221(1), 101–115 (2007)
Pickup, L., Wilson, J.R., Sharpies, S., Norris, B., Clarke, T., Young, M.S.: Fundamental examination of mental workload in the rail industry. Theor. Issues Ergon. Sci. 6(6), 463–482 (2005)
Pickup, L., Balfe, N., Lowe, E., Wilson, J.R.: ‘He’s not from around here: the significance of local knowledge. Rail Hum. Factors: Supporting Reliab. Saf. cost Reduction, 357 (2013)
Pickup, L., Wilson, J., Lowe, E.: The operational demand evaluation checklist (ODEC) of workload for railway signalling. Appl. Ergon. 41(3), 393–402 (2010)
Wright, K., Crabb, R.: Making the invisible visible: an objective measure of cognitive workload for signallers. In: Proceedings of the Fifth International Conference on Rail Human Factor, London (2015)
Golightly, D., Wilson, J.R., Lowe, E., Sharples, S.: The role of situation awareness for understanding signalling and control in rail operations. Theor. Issues Ergon. Sci. 11(12), 84–98 (2010)
Delamare, D., Golightly, D., Treble, P., Lumby, A.: D-MOD dynamic modelling of operator demand a new simulator module for the evaluation of signaller’s demand. Presented at IEEE ICIRT 2016, Birmingham, UK (2016)
Delamare, D., Golightly, D., Goswell, G., Treble, P.: D-MOD The use of full-fidelity simulators for the quantification of signaller’s demand. In: 7th International Conference on Railway Operations Modelling and Analysis (2017)
Kopardekar, P.H., Schwartz, A., Magyarits, S., Rhodes, J.: Airspace complexity measurement: An air traffic control simulation analysis. Int. J. Ind. Eng.: Theory Appl. Pract. 16(1), 61–70 (2009)
Aldrich, T.B., Szabo, S.M., Bierbaum, C.R.: The development and application of models to predict operator workload during system design. In: McMillan, G.R., Beevis, D., Salas, E., Strub, M.H., Sutton, R., Van Breda, L. (eds.) Applications of Human Performance Models to System Design, pp. 65–80. Springer, Heidelberg (1989)
Hart, S.G., Staveland, L.E.: Development of NASA-TLX (Task Load Index): results of empirical and theoretical research. Adv. Psychol. 52, 139–183 (1988)
Krehl, C., Balfe, N.: Cognitive workload analysis in rail signalling environments. Cogn. Technol. Work 16(3), 359–371 (2014)
Weeda, C., Zeilstra, M.P.: Prediction of mental workload of monitoring tasks. In: Nadashi, N., Scott, A., Wilson, J.R., Mills, A. (eds.) Rail human factors supporting reliability, safety and cost reduction. Proceedings of the Fourth International Conference on Rail Human Factors, London pp. 633–640 (2013)
Gibson, W.H., Mills, A., Basacik, D., Harrison, C.: The incident factor classification system and signals passed at danger. Paper Presented at the 5th Conference of Rail Human Factors, London, UK (2015)
Shanahan, P., Gregory, D., Lowe, E.: Signaller workload exploration and assessment tool (SWEAT). In: Wilson, J.R., Mills, A., Clarke, T., Rajan, J., Dadashi, N. (eds.) Proceedings of 3rd Rail Human Factors Conference, pp. 434–443 (2012)
Acknowledgement
Thank you to all Human Factors consultants, Network Rail, RSSB for their attendance to our Human Factors signalling working group. This project is co-founded by Innovate UK and EPSRC as part of the Knowledge Transfer Partnership programme.
Author information
Authors and Affiliations
Corresponding author
Editor information
Editors and Affiliations
Rights and permissions
Copyright information
© 2017 Springer International Publishing AG
About this paper
Cite this paper
Delamare, L., Golightly, D., Goswell, G., Treble, P. (2017). Quantification of Rail Signaller Demand Through Simulation. In: Longo, L., Leva, M. (eds) Human Mental Workload: Models and Applications. H-WORKLOAD 2017. Communications in Computer and Information Science, vol 726. Springer, Cham. https://doi.org/10.1007/978-3-319-61061-0_11
Download citation
DOI: https://doi.org/10.1007/978-3-319-61061-0_11
Published:
Publisher Name: Springer, Cham
Print ISBN: 978-3-319-61060-3
Online ISBN: 978-3-319-61061-0
eBook Packages: Computer ScienceComputer Science (R0)