
Abstract
The safe and efficient mobility of persons with visual impairment may be secured with the development of new aids, based on new computer methods and technologies. The issue of mobility and accessibility is one of the central concerns in the development of »smart cities« and of accessible service for all inhabitants of urban areas. We will present an automated procedure for the production of tactile maps with the latest 3D printing technology for visually impaired persons. By employing a new method, which entailed the linking of geolocation data (digital maps, digital spatial images), new 3D tactile designing process and 3D print technology, we have reduced the costs and accelerated the production of tactile maps for visually impaired persons, and ensured the transportability of the products by converting them into a digital (STL) format. To exhibit the use of our new methodology, several production cases from Slovenia will be presented: the tactile map of the Slovene Ethnographic Museum, the tactile model of the Sečovlje Salina – the traditional production of salt, the tactile plate of the famous Schutze ceramic plate from 1886, the tactile map of the Library of the Union of the Blind and Partially Sighted of Slovenia, and the tactile map for orientation and mobility of the capital of Slovenia, Ljubljana.
You have full access to this open access chapter, Download conference paper PDF
1 Introduction
When people lose their sight, they undergo significant changes. An important factor in the rehabilitation of people with disabilities is the degree to which they are able to move independently as that influences their employment prospects and inclusion in society, both directly and indirectly.
The safe and efficient mobility of persons with visual impairment may be secured with the development of new aids based on new computer methods and technologies. The article details various data sources, and the use of new computer technologies, such as 3D print, digital maps, digital spatial images, and open data. The issue of mobility and accessibility is one of the central concerns in the development of »smart cities« and of accessible service for all inhabitants of urban areas. New technologies (smart phones, sensors, computers and the use of artificial intelligence) and the new paradigm of data accessibility (open data, big data) offer the possibility to develop new utilities and services that would ensure the safe mobility of all sections of society.
The term ‘people with disabilities’ covers various groups of individuals: the blind and partially sighted, the physically disabled, the deaf and hard-of-hearing, and others. With the addition of senior citizens and families with children (getting around with prams), we come to the realization that ensuring mobility is not an established fact, but in fact the precondition for the active involvement of people with disabilities in micro- and macro- environments. Eventually, these products and services will benefit each and every one of us as we become the new generation of senior citizens, faced with a range of functional disabilities. The Geodetic Institute of Slovenia has been working towards new solutions for safe mobility in cities for many decades, focusing in particular on the needs of the visually impaired individuals.
In order to develop quality aids, it is essential to first recognize the needs of the users; each targeted group has its own needs and demands. From the point of view of the user (e.g. a blind individual), reaching a destination requires mapping out one’s route in advance. This entails the following three processes: the individual’s location in place, the process of navigation, and mobility. The major issue in navigation is having good information and being familiar with expert and optimal technological solutions. The main mobility enhancing sources of information are state and municipal »topographic« databases, upgraded occasionally with topical information for navigation (additionally acquired in the field and in the office), different orthoimages, Google Street View, etc.
The article will go on to describe the effects and requirements for the safe mobility of persons with visual impairment, our target group, and the state of the art automated production of tactile maps for the visually impaired with the help of new technologies.
2 The Safe Mobility of Persons with Visual Impairment – Definitions, Problems and Demands
From the point of view of the user – a blind individual – reaching a destination requires a detailed mapping out of one’s route in advance. People with disabilities have none of the advantages that the sighted take for granted when navigating their hometown, travelling across countries or between continents. They have to meticulously plan their journey, as well as the activities required to reach their intended destination – we call these pre-journey activities – in advance. For better understanding, three key concepts which pertain to the mobility of visually impaired people must be formulated: orientation, navigation, and mobility.
-
Orientation: the ability of a visually impaired person to orient themselves in space; i.e. to know where they are, to be aware of their location in space and of spatial relations.
-
Navigation: a set of instructions that help a visually impaired person navigate from their current position to a different location in space. The instructions may be given in a number of ways, e.g. orally, or, as is more commonly the case, with the help of electronic navigation (e.g. with Trekker Breeze).
-
Mobility: a complex notion that encompasses the orientation, navigation and movement of a blind individual in space to reach a new intended destination.
2.1 Objective
The objective of the project was to link a variety of input data and a number of different procedures and technologies into a single line. This entailed the acquisition and processing of data, the production of a 2D map with cartographic tools, designing a 3D model with computer software for solid modelling, and the production and re-production of the end products, e.g. by employing the thermo-vacuum method. The new procedure strived towards the automatization of production, the elimination of handwork, and the creation of tactile maps in a digital format that would enable easy access and the re-production (3D print) of the end product. The greatest flaw of standard tactile map production is that it is both a time-consuming and costly process and that the production of a larger number of copies is difficult (poor reproducibility).
2.2 The Difficulties and Challenges in the Navigation of Visually Impaired Persons
Navigating the city presents visually impaired people with a number of difficulties that arise from the lack of information in the environment [11]. To be able to move around independently, the visually impaired person has to be familiar with the city’s urban areas and have the appropriate cognitive map formed. By using a white cane, the visually impaired individual can only sense their environment within a one metre radius of themselves. They obtain the rest of the information mostly through hearing.
I will address three of the most common problems the visually impaired person is confronted with when moving around the city.
Crossing the Road or Intersection.
The level of difficulty for the visually impaired person rises with the number of lanes and the volume of traffic. They also have to be familiar with the geometry of the intersection. Accessible pedestrian signal (APS) devices offer substantial help to the visually impaired. Crossing the road without APS is impossible or extremely dangerous. Even so, the person has to locate their position in space, find an accessible pedestrian signal (a pedestrian pushbutton device), and direct themselves toward the identical device located on the other side of the road (Fig. 1).

A visually impaired person crossing the road with no accessible pedestrian signals (Ljubljana Central Bus Station). He has to wait for a passer-by and ask for help.
Cycle Tracks and Cyclists.
Being run over by a cyclist is the greatest fear and concern of every visually impaired person. Though the movement of cyclists is soundless, footways and cycle tracks tend to lie side by side. Cyclists often ride carelessly, speeding past the pedestrians. Because the visually impaired person cannot see them, bumping into them can be very dangerous. Luj Šprohar (the visually impaired person in the photograph, who usually moves around Ljubljana independently) has developed a special technique for crossing cycle tracks (Fig. 2).

A visually impaired person crosses the road where the footway and the cycle track lie side by side.
Parking Violations.
Vehicles parked illegally on pavements, in pedestrian zones, or stations prevent the visually impaired person from following a safe route. Often, the visually impaired person is forced to step on the road, placing themselves in danger and risking an accident. Scooters and motorcycles that a visually impaired person may bump into and knock over are equally dangerous. The risk of injury in these cases is high (Fig. 3).

A blind person wants to reach his platform at the railway station. A motorcycle is parked on the footway, blocking his way.
3 Automated Production of Tactile Maps for Visually Impaired People – the Slovenian Experience
The idea of raised-relief maps, i.e. tactile maps, for the needs of the blind is more than a century old. Teaching the blind with the help of tactile maps has had a long tradition in Slovenia as well. The first institution for the visually impaired was founded in Ljubljana in 1919 [3].
The visually impaired are deprived of crucial information regarding space and the spatial relations of objects. The efficiency of their movement in space depends on their understanding of it, i.e. on the accuracy of their cognitive maps. The most frequent problem of the visually impaired is forming a comprehensive perception of space [5]. Often, the blind can locate objects in space correctly, but are unable to form a sense of the whole. This largely absent concept must therefore be introduced to the visually impaired person in an appropriate way. A lot of research has been done in this field since the 1950s, particularly in the last twenty years. Oral explanations, textual descriptions, and even training the blind by leading them in the field have proven to be less effective than orientation mobility maps. The combined use of tactile maps, computers and artificial sound has improved motivation, especially with young people, and produced better learning results as well [7]. Technologies well-established in the field of geomatics – e.g. GIS, GPS and, above all, smart phones and multimedia – have been applied to the field of accessibility for the visually impaired, opening new possibilities for their better and safer mobility.
3.1 The Selection of Optimal Content of Tactile Maps for the Mobility of Visually Impaired People
The most important idea behind tactile mobility maps is the selection of special content for the orientation and mobility of the visually impaired and multilevel representation. Tactile cartographic symbols, which serve the special needs of the visually impaired for their orientation in space, have been specifically arranged and selected as well. Slovenia has standardised more than 30 symbols for tactile orientation and mobility maps. These normally represent the following contents: roads and streets, urbane areas, buildings of particular significance to the visually impaired (schools, banks, post-offices, the opera, etc.), orientation data (barriers, staircases, subways, traffic lights, etc.), green plots, hydrography, and Braille letters.
Content differentiation is made possible by way of multilevel presentation (different height of layers content and symbols), the selection of appropriate tactile cartographic symbols, and their optimal distribution. Roads and streets play a major role on mobility maps. All roads and streets should be marked on tactile mobility maps [3]. As the content of tactile mobility maps is rather standardised, in addition to size, at least two other factors have to be considered:
-
content density (the greatest density is to be found in old city centres),
-
the size of the reproduced area.
Therefore, an appropriate scale must be determined so that, taking the rules of tactile cartography and the density of the represented area into consideration, it is still possible to show all the roads and streets with all the tactile cartographic symbols appropriately positioned. The Geodetic Institute of Slovenia has tested tactile orientation map scales ranging from 1:500 to 1:5000. The results have shown that there can be no straight limits between the scales. In the case of medium density population, experience has shown orientation maps scales in the range of 1:2000 to 1:3000 to be the most appropriate, and 1:500 to 1:1000 in the case of old city centres.
From the point of view of the visually impaired, the most important thing is that tactile mobility maps are simple and schematic, easy to decipher, and accurate in showing the locations within the scope of their type-reading abilities. This can be reached with the help of accurate cartographic generalisation, taking the special requirements of the users into account. The blind can only distinguish a limited number of tactile cartographic symbols in one representation. In practice, this is a range of approximately 10 symbols for an individual group of the point, linear or areal tactile symbols [9]. Research in this field up to the present day has identified a relatively small number of the type readable symbols that are effectively recognised by the blind.
3.2 3D Printing Technology for Tactile Maps
Blind and partially sighted people experience difficulties in communication, learning, and moving without aids. Tactile pictures and maps are specially designed aids that are read by touch. The production of high quality tactile maps and pictures is a technologically demanding process that has caused numerous difficulties in the past. The main difficulties are the high costs, a small number of printed copies, complex and time consuming elaboration, wide-spread locations in the centres for blind without the special expertise needed for the production. Visually impaired users feel the lack of good tactile graphics aids. The expenses may be simplified and reduced with the cooperation of different partners and their shared knowledge (tactile perception, cartography, geo-information, etc.), the latest technology solutions (ICT), knowledge about materials and the process of automated production including industrial tools. The article describes the automated process of the production of tactile maps and pictures with the latest 3D printing technology, which supports inclusion and gives opportunity for an individual approach to the blind person. Each tactile map or picture is completed in a few hours or days, depending on the complexity of the image. New tactile maps or pictures are stored in a file, ready to be printed with 3D printers all over the word. Users can print as many copies as they want.
3.3 The Challenges of Providing a New Service for the Visually Impaired with 3D Print: On Demand Tactile Maps for Visually Impaired Users
It is crucial that with the help of 3D printing, tactile maps can be printed on demand of a user or a group of users (a visually impaired person, a school, society, municipality, museum, etc.). As shown in the image below, the user selects the desired area on a digital model (Fig. 4).

The user selects the desired tactile map area on a topographic map
The data sources for tactile mobility maps are the existing cartographic and topographic digital data bases, orthoimages, aerial photographic images, thematic maps, terrain inspection records, Google Street View, open data and big data sources, etc. In order to produce a tactile orientation and mobility map, the source must be reproduced in a scale that is approximately two times smaller. Example: for a 1:2.500 scale orientation and mobility map a 1:5.000 scale topographic map, or an existing digital cartographic base, is used [8]. When the content is determined, the appropriate tactile cartographic symbols for the project are selected, and their digital library prepared. The fonts were prepared for the Slovenian set of the Braille letters.
With the appropriate data source selected, the digital orientation map is produced. Processing follows, i.e. the editing of the content. Here, the principles of tactile cartography apply, and an appropriate method of generalisation must be used. Visual data sources are used as the basis for the creation of a tactile map. As this is not a simple geometric/graphic transformation, but a sophisticated transformation of the content, direct transfer can be performed only by an experienced cartographer who is an expert in information technology. Some intermediate stages are otherwise necessary. The data that has been scanned or digitized is processed by way of the CAD software. On completion, all the special data for the orientation of the blind is added. This data is based on the terrain inspection performed by a specialist for the orientation of the blind.
Geographic Information Systems (GIS) are also used in the production process of tactile maps. They are used for capturing, storing and analysing spatial data, specifically, data required for the production of tactile mobility maps for the visually impaired. GIS issue a strict set of rules for capturing and storing data, i.e. topology of data.
In the production process, several inspections of the tactile maps are conducted in relation to their content and its logical sequence. A cartographer and a user representative inspect the content and review the control plot. A topologic inspection of the base follows so as to facilitate the processing of the data by the GIS tools. In our present projects, we have applied our own software, the AutoCad and Arc/Info.

The tactile mobility map data processed in this way is prepared for three outputs:
-
reproduction of the original plotting,
-
data preparation for the 3D printer,
-
the database for fast printing on micro capsule paper.
The reproduction originals are used for colour screen-printing. In our case, 4 films for black, red, blue and green colour were produced. The use of colours on orientation maps is essential for people with low-vision, the partially sighted and, ultimately, for the fully sighted, who cannot read the Braille letters.
Colours convey psychological meanings as well. Namely, in the eyes of the average sighted person, our work would be far less appreciated if orientation and mobility maps were colourless. The second output is prepared for the connection to the 3D printer (Fig. 5).

3D printer – importing the pre-arranged tactile map data in.stl format
The quality of the matrix depends primarily on the material. This way of producing tactile maps preconditions the establishing of a digital database, which facilitates the preparation and printing of tactile maps on micro capsule paper, thus enabling the grid analysis and the connection to the GPS system (Fig. 6).

Chemical preparation of a 3D tactile model
The procedure and step by step guide of the production of tactile maps with the help of 3D printing is outlined in the operation diagram. The production process consists of three key stages: the design and production of a 2D tactile map, matrix development, reproduction with the help of thermo-vacuum technology. The matrix was produced by means of 3D printing in a new, automated procedure. The entire model (matrix), with all its minor details – e.g. inscriptions in Braille, the cartographic signs – is produced in one go. Manual work and the subsequent sign sticking is no longer required.
Standardized production of tactile maps calls for a double perspective: the standardization of content and the standardization of the production process. The prime objective of the latter is the economy of the production.
A tactile cartographic sign key has been developed and approved for a tactile map orientation and mobility for the visually impaired group in Slovenia. Part of the cartographic sign was adapted from the Marburg standardization, the rest were developed in the joint effort of the Institute for Blind and Partially Sighted Children and the Geodetic Institute of Slovenia. The use of established and easily readable tactile cartographic signs is recommended.
3.4 The Results of the 3D Printing of Tactile Maps and Models and User Response
A number of 3D tactile maps, models and items have been produced in Slovenia with the help of 3D printing: for national parks, cities, and public institutions. We have also successfully manufactured a variety of items for different museums and their permanent collections.
The production of tactile maps with the help of 3D technology requires a high degree of technical expertise, data proficiency, and an excellent command of a variety of software tools. We have thus produced and printed over fifty tactile maps, models and items in the last years with the help of 3D printing. We have also printed several thousand tactile maps and images by means of reproducing the thermo-vacuum technique.
Some of our latest representative products are listed below:
-
tactile map – Slovene Ethnographic Museum (Fig. 7)
Fig. 7. 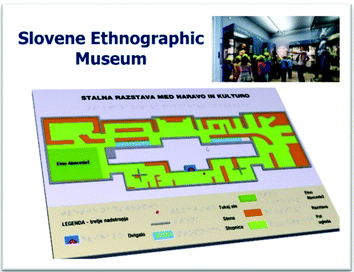
Tactile map – Slovene Ethnographic Museum
-
tactile model – Salt Works Museum – a tactile model of the Gulf of Piran, traditional salt production (Fig. 8)
Fig. 8. 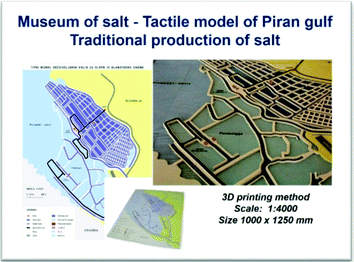
Tactile model – Salt Works Museum
-
tactile plate – the famous Schutze ceramic plate from 1886 (Fig. 9)
Fig. 9. 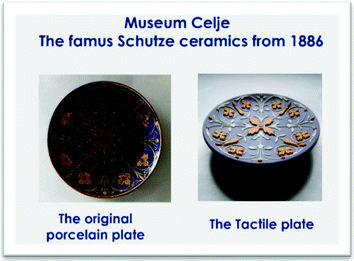
Tactile plate – the famous Schutze ceramic plate
-
tactile map – the Union of the Blind and Partially Sighted of Slovenia Library (Fig. 10)
Fig. 10. 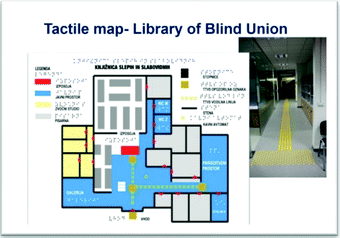
Tactile map – the Union of the Blind and Partially Sighted of Slovenia Library
-
tactile map for the capital of Slovenia, Ljubljana (Fig. 11)
Fig. 11. 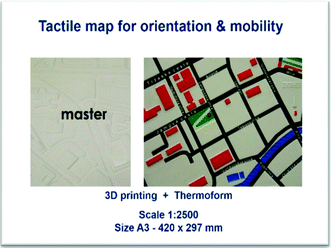
tactile map for the capital of Slovenia, Ljubljana
-
two awards: Excellence in Cartography for a tactile map (ICA – International Cartographic Association) and a Government of Slovenia award for innovation (Fig. 12)
Fig. 12. 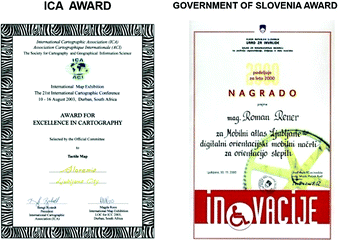
two awards: Excellence in Cartography for a tactile map (ICA – International Cartographic Association) and a Government of Slovenia award for innovation


4 Conclusion
Persons with visual impairment face difficulties in receiving information from the environment. It is particularly challenging for them to gain a general perception of space. This means that the visually impaired lack information about the position of objects in space, the layout of streets, the location and characteristics of traffic infrastructure (e.g. pedestrian crossings, pedestrian signal devices, the width of the road, etc.), as well as safe routes to choose from. Tactile maps provide blind persons with the missing information and help them assess the geometry of objects in urban environments. They aid them in orienting themselves in space. There are two types of navigation that need to be considered: outdoor (in the environment) and indoor navigation (inside public buildings).
Tactile maps for orientation and mobility are a quality aid. Without them, the mobility of visually impaired people would be difficult to imagine.
The production of high quality tactile maps and images is a technologically demanding process that has caused numerous difficulties in the past. The main difficulties were: high costs, a small number of printed copies, complex and time consuming elaboration, dispersed locations of centres for the visually impaired without the special knowledge needed for the production.
By completing our work of many years we have eliminated most of the problems listed above, and achieved the majority of our established goals:
-
a variety of digital data sources, accessible on a local and national level – including other accessible (open data) and commercial sources (e.g. Google Maps, Google Street View, etc.) – have been integrated in the production of tactile maps,
-
we have connected five different technologies, as well as the expertise from these fields: data processing and manipulation with GIS (Geographic Information System) tools, cartographic elaboration of 2D tactile maps (cartographic software, tactile generalisation of tactile map content), 3D modelling of tactile maps (3D model in STL format), 3D print technology (3D printer), and the thermo-vacuum technique of printing tactile maps (the industrial procedure of PVC foil stamping),
-
we have accelerated the production of tactile maps and images, decreasing the production time from several weeks (3–5 weeks) to 2–5 days,
-
the production costs have been reduced: the costs for the production of the first tactile map have been reduced by about 30%, the costs for the re-production have been reduced by about 50%.
The articles describes the results of a project which spanned over a number of years, and the efforts to bring together the technologies and expertise from a variety of fields. We experimented with several solutions in the process of achieving our established goals, but were often held back by difficulties that forced us back to the drawing board. For example: our 3D tactile models could not withstand the high temperature linked with printing a larger number of copies with the help of the thermo-vacuum technique. It took us more than a year to find the solution. We finally resolved the problem with the help of an expert from the automobile industry who had experience with a similar procedure.
New technologies, including 3D print technology, make the production of tactile maps simpler, faster, and cheaper. 3D printing also makes tactile maps more widely accessible; products thus developed can be printed with any 3D printer in the world, and any number of copies can be made,
Only the techniques and aids that have proven simple enough, efficient enough, and cost - effective are established and applied in the everyday life of the visually impaired user.
5 Ongoing Work
Setting up a (nation-wide, Europe-wide, and world-wide) digital library of tactile maps, stored in a variety of digital formats, is something to focus on in the future. Visually impaired users would be able to access this database free of charge, and print any number of copies (of tactile maps) they might need.
My next suggestion stems from our experience developing a new methodology for tactile map production. The side product of tactile map production is a variety of data that ought to be recorded in a multi-purpose digital database. This data might later on be used for the GPS navigation for visually impaired persons.
The third suggestion works toward standardizing the content of tactile maps for orientation and mobility. The new technique of tactile map production makes it possible for the content of tactile maps for orientation and mobility to be unified in an essentially better way, and to be permanently updated on the basis of new findings.
References
Bader, S.: The Designer Says. Princeton Architectural Press, New York (2012)
Berdman, D.: Do good Design - How Designers Can Change The World, Berkeley, USA (2009)
Brvar, R.: Geografija nekoliko drugače, Didaktika in metode pouka geografije za slepe in slabovidne učence, Zavod Republike Slovenije za šolstvo, Ljubljana, Slovenia (2000)
Dawidson, E.: Pedestrian navigation in Stocholm, how local data together with advanced positioning techniques can be used for detailed routing. In: Proceedings of the 16th ITS World Congress, Stocholm, Sweden (2009)
Eriksson, Y., Jansson, G., Strucel, M.: Tactile maps. The Swedish Braille Authority, Enskede (2003)
Hudson, B.: How to optimaze your design for FDM 3D printing (2016). https://www.3dhubs.com/knowledge-base/how-optimize-your-design-fdm-3d-printing
Kermauner, A.: Umetnost za vse. Revija za elementarno izobraževanje, znanstveni članek. Pedagoška fakulteta Maribor, Slovenia (2014)
Rener, R.: Tactile Maps and Diagrams, Master work, University of Ljubljana, Slovenia (1993)
Rener, R.: Tactile cartography: another view of tactile cartographic symbols. Cartographic J. 30, 195–198 (1993)
Virtanen, A., Koschinen, S.: NOPPA-navigation and guidance system for the blind. In: Proceedings of the 11th ITS World Congress, Nagoya, Japan (2004)
Vovk, M.: Načrtovanje in prilagajanje grajenega okolja v korist funkcionalno oviranim ljudem, Urbanistični inštitut Slovenije, Ljubljana, Slovenia (2000)
The ASK-IT project (2009). http://www.ask-it.org
Author information
Authors and Affiliations
Corresponding author
Editor information
Editors and Affiliations
Rights and permissions
Copyright information
© 2017 Springer International Publishing AG
About this paper
Cite this paper
Rener, R. (2017). The 3D Printing of Tactile Maps for Persons with Visual Impairment. In: Antona, M., Stephanidis, C. (eds) Universal Access in Human–Computer Interaction. Designing Novel Interactions. UAHCI 2017. Lecture Notes in Computer Science(), vol 10278. Springer, Cham. https://doi.org/10.1007/978-3-319-58703-5_25
Download citation
DOI: https://doi.org/10.1007/978-3-319-58703-5_25
Published:
Publisher Name: Springer, Cham
Print ISBN: 978-3-319-58702-8
Online ISBN: 978-3-319-58703-5
eBook Packages: Computer ScienceComputer Science (R0)