
Abstract
In daily life, stereoscopic image technology, such as 3D TV and movies, has become used in various places. Images, not limited to stereoscopic images, may exhibit unfavorable biological effects depending on the viewing and physical conditions, age, and individual differences. In our previous study, an increase was indicated in the sway values that were observed while/after peripheral viewing a stereoscopic video clip. Backgrounds are considered to affect our balance function. We examine the effect of the exposure to stereoscopic video clips without the background on our equilibrium function paper, and fifteen healthy young males voluntarily participated in the present study. Their stabilograms were recorded during monocular vision or binocular parallax vision using semipermeable smart glasses, where the subjects maintained the Romberg posture in stabilometry. We also measured the body sway with the subjects’ eyes closed 0–3 min after the exposure to the video clips. We herein compare the temporal averaged potential functions to control the standing posture during the exposure to 2D/3D video clips with those after the exposure.
You have full access to this open access chapter, Download conference paper PDF
Keywords
- Visually-Induced Motion Sickness (VIMS)
- Stabilometry
- Stereoscopic video clips
- Background (BG)
- Stochastic Differential Equation (SDE)
- Temporally Averaged Potential Function (TAPF)
1 Introduction
In daily life, stereoscopic image technology, such as 3D TV and movies, has become used in various places. Binocular stereoscopic imaging methods markedly improved after 2009, and viewing of 3D contents for a prolonged period at home became common along with the sale of 3DTV, LCD, 3DPC, and game machines, in addition to 3D movies at movie theaters and theme parks. Stereoscopic imaging techniques have also become used for not only amusement but also in the industrial, medical care, and educational fields. In the industrial field, the techniques were introduced into 3DCAD, CAM, and CAE, and improved productivity and markedly shortened the development period. In the medical care field, stereoscopic images are useful to 3-dimensionally identify affected regions and lesions, improving the diagnostic accuracy and safety of surgery and reducing the stress of physicians, and are applied to medical 3DLCD and 3D endoscopic surgery support systems. However, images, not limited to stereoscopic images, may exhibit unfavorable biological effects depending on the viewing and physical conditions, age, and individual differences.
A body equilibrium function test, stabilometry, is considered useful to evaluate the equilibrium function. Stabilometry is generally performed on standing in Romberg’s posture in which the feet are together and the eyes open and closed, and for 60 s each, sways of the center of pressure (CoP) are measured, which is regarded as a projection of the center of gravity. To increase the diagnostic value of stabilometry, measurement methods and analytical indices of stabilograms have been proposed such as area of sway, total locus length, total locus length per unit area, defined in Suzuki et al. [1]. The analytical indices include the total length of body sway and locus length per unit area. The latter is considered to represent micro changes in postural control and serve as a scale of proprioceptive postural control. Romberg’s posture is an upright posture with the feet placed together. It is an unstable standing posture because the base of support is narrow, and so body sway becomes marked, and a reduced equilibrium function is likely to appear in stabilograms.
The methods to measure the influence of visually-induced motion sickness on the body include subjective psychological methods and physiological methods concerning autonomic nerve activity. Stereoscopic videos utilizing binocular stereoscopic vision often cause unpleasant symptoms of asthenopia, such as a headache and vomiting, depending on the audiovisual condition [2]. Simulator Sickness Questionnaire (SSQ) is the best known psychological measurement method to assess visually-induced motion sickness. This is comprised of 16 effective subjective items to assess simulator motion sickness extracted from 1,119 paired data on Motion Sickness Questionnaire (MSQ) measured before and after experiencing a simulator by factor analysis [3]. Visually-induced motion sickness (VIMS) is also assessed by physiological measurement methods using electrocardiography, blood pressure, respiratory rate, the number of eye blinks, electrogastrography, body sway, the resistance value of the skin, and perspiration [4,5,6,7]. It has been reported that the SSQ score was significantly increased from the pre-resting score by setting the interval between the bilateral heels at 17 cm in the group complaining of vibration load-induced motion sickness [7].
Although the mechanism of the symptoms does not have been elucidated and been unclear, our previous study showed an increase in sway values that were observed during peripheral viewing [8]. This result was supported by our subjective evaluation [9]. Especially in the background (BG), there is a large difference between human binocular image and artificial stereoscopic image to which our convergence corresponding to depth cues is not accommodated. That is why equilibrium function affects from peripheral viewing. In this study, we examine the effect of the exposure to stereoscopic video clips without the background on our equilibrium function.
2 Mathematical Models of Body Sway
To begin with, upright postures is considered to be instable. When humans maintain an upright posture, the body always sways. To ensure the posture, it is necessary to control the feet along a spatial perpendicular line from the center of gravity within the narrow base of support [10]. In the Romberg posture, the base supporting the body is the narrowest. The authors are investigating the instability of the systems to control upright posture which could become more instable on a tilting table [11].
Motion sickness symptoms can be identified by the stabilometry, and quantitation of the severity is being investigated. Stabilometry performed as a body balance function test is useful to diagnose and evaluate the stability of standing posture and its control system and balance disorders due to central diseases, as such it is useful to comprehensively investigate the balance function [1, 12]. In stabilometry, recording starts when the standing position stabilizes, and it is a simple 60-second test. To increase the diagnostic value of body sway, indices of stabilogram analysis were proposed including total length of the body sway and locus length per unit area [1, 12]. In addition to these, we proposed an index of stabilogram pattern analysis termed sparse density in consideration of the non-linearity of the posture control system [13], and apply it to quantitation of motion sickness [13,14,15].
Stabilograms represent a process accompanied by irregular swing components. Sways in the lateral and anteroposterior directions in stabilograms can be independently handled as recorded time-series [16]. Stochastic Differential Equation (SDE) is used as a mathematical model to describe body sway [17,18,19,20].
The time-series to be described is regarded as being produced by the Markov process, and when no abnormal diffusion is observed, the following formula is applied to the distribution in each measurement direction, \( G_{z} \), and potential of the time-average, \( U_{z} \), constituting SDE (z = x, y).
SDE (1) is capable of producing locally stable movement in the vicinity of the minimum of its potential surface, and a high density of measurement point, z, in the vicinity of the minimum is expected. This is considered dependent on the locus length per unit area, but the sparse density includes more local information in the measurement. In our analysis of stabilogram patterns, time and its hierarchy characteristic to the posture control system, which is difficult to theoretically elucidate can also be discussed by paying attention to microstructures observed in the time-average potential of the posture control system and numerical analysis by SDE. Nonlinearity of the right side first term has been discussed by us [20]. The stiffness control hypothesis [10] has begun to be reconsidered as in [21].
This new stabilogram pattern analysis method has already been applied to quantitate motion sickness induced by the blur of liquid crystal and stereoscopic viewing [8, 22,23,24]. Takada et al. discussed that peripheral vision contributed to an increase in the sway value [8], in which the period with an increase in sway was prolonged in resting with closed eyes after viewing corresponding to the duration of viewing [24].
3 Materials and Methods
Fifteen healthy young males (age, 21–24 years), who do not have had any otorhinolaryngologic or neurological diseases in the past, voluntary participated in this study. The experiment was sufficiently explained to the subjects, following which written consent was obtained from them.
In this experiment, the body sway was measured while viewing 2D/3D video clips with the use of semipermeable smart glasses that displayed content in the Sky Crystal (Olympus Memory Works Ltd. Co., Tokyo), which was modified with permission from the company and was used as the visual stimulus in this experiment. The stimulus includes spheres fixed in four corners, which supplies perspective. A sphere complexly ambulated in a video clip. The subjects stood on the detection stand of a stabilometer GS3000 (Anima Co. Ltd., Tokyo), without moving, with their feet together in the Romberg posture, for 30 s before the sway was recorded. Each sway of the CoP was then recorded at a sampling frequency of 20 Hz. The subjects were instructed to maintain the Romberg posture during the trials. For the first 60 s, the subjects were asked to do the following:
-
I.
Gaze at a static circle with a diameter of 3 cm (Control).
-
II.
Peripherally viewing video clips without pursuing the sphere.
-
III.
Peripherally viewing video clips as same in II without the backgrounds (Fig. 1a)
Fig. 1. 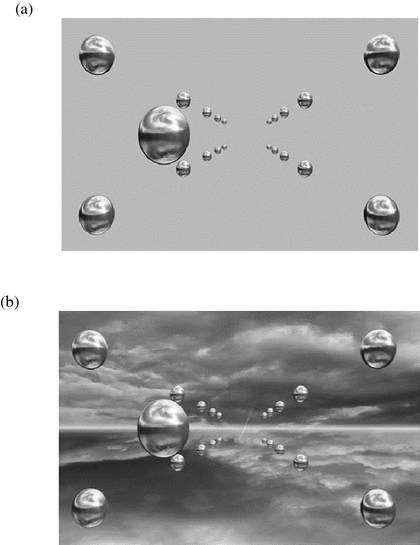
One cut of the video clips without backgrounds (a) and with backgrounds (b) [24]

The sphere of the video clip II ambulated in backgrounds with clues for visual depth (Fig. 1b).
We also measured body sway with eyes closed 0–3 min after the exposure to them, and the Post-stabilogram were composed every 1 min. We calculated sway values that were obtained from stabilograms during/after exposure to video clips with/without the background (i.e. clouds in the sky/plain gray background).
The circle (I) was placed before the subjects, 2 m away, at their eye level. Stereoscopic video clips (II)/(III) and their monocular (2D) vision were shown to subjects on the binocular parallax 3D display. We measured the body sway and the subjective evaluation for each vision (I) Control, (II)-2D, (II)-3D, (III)-2D, and (III)-3D situation randomly, according to the abovementioned protocol.
We conducted the stabilometry with eyes open/closed. The experimental periods with eyes open and closed was designed in our experimental protocol to evaluate the severity of the VIMS during and after viewing the video clips. In stabilometry, the CoP on an x-y plane was recorded at each time step where x and y directions were defined as the right and the anterior axes on their faces, respectively. We herein examine whether the metamorphism is observed in the TAPF (2) by the motion sickness induced by peripherally viewing 3D video clips.
4 Results
Stabilograms as in Fig. 2 were obtained for each experimental period from the time series of their CoP. Most stabilograms observed 0–2 min after viewing a 3D video clip with the background (II)-3D were dispersed compared with the control stabilograms. In contrast, no persistent tendency was observed in the stabilograms measured 2–3 min after the cutoff of the visual stimulus. However, most stabilograms observed 0–2 min after exposure to video clips without the background (III)-2D/3D were not dispersed compared with the control stabilograms. The stabilograms were dispersed three minutes after the cutoff of the visual stimulus.

Typical stabilograms while/after viewing 3D video clips with the backgrounds (a)–(d) and without the backgrounds (e)–(f): stabilograms with subjects’ eyes’ open (a), (e); stabilograms 0–1 after viewing a 3D video clip (b), (f); stabilograms 1–2 after viewing a 3D video clip (c), (g); stabilograms 2–3 after viewing a 3D video clip (d), (h)
Based on Eq. (3), the TAPFs have been estimated from distributions for all subjects (Fig. 3). Nonlinearity is often seen in the TAPFs as a mathematical expression of the equilibrium function [20]. However, we herein fit the parabolic functions to the TAPFs of x direction (Fig. 3a–d) and those of y direction (Fig. 3e–h) because the individual characteristics were not seen in this study. The graphs of the TAPFs obtained from stabilograms while viewing video clips (Fig. 3a, e) can be compared with those after viewing (Fig. 3b–d, f–h). A coefficient in higher degree was larger while viewing the 3D video clip with backgrounds than the others. This property disappeared 2–3 min after the exposure to the video clips.


TAPFs for x-component while/after viewing 2D/3D video clips (a)–(d) and for y-component (e)–(f): TAPFs were estimated from the stabilograms with subjects’ eyes’ open (a), (e); stabilograms 0–1 after viewing video clips (b), (f); stabilograms 1–2 after viewing video clips (c), (g); stabilograms 2–3 after viewing video clips (d), (h)
5 Discussion
In the second last conference, we have reported the calculation results of the new index sparse density (SPD) and the previously stated sway values such as total locus length, area of sway, total locus length per unit area. These indices were calculated from each stabilogram recorded with the eyes open/closed. Any two of the following were assumed to be potentially important influencing factors: the solidity of the subjects’ vision (2D/3D), existence of the backgrounds in the video clips, and persistence of the visual stimulus [24]. Regarding the description of body sway in the exposure to stereoscopic video clips, the mathematical model (1) was herein investigated, and we could observe temporal evolution in the potential function for the x-component after peripheral viewing the stereoscopic video clips (Fig. 3b–d). Specially, the nonlinearity could be also seen in the potential function for the y-component while peripheral viewing the video clips (Fig. 3e).
The complexity or the changes from control level could not be found in the potential function for the y-component while peripheral viewing the stereoscopic video clip with backgrounds (Fig. 3e). Our system to control upright posture might not be affect by the purtubation of backgrounds while viewing the 3D video clip on the surface and accumulate the influence of the purtubation on the equilibrium function. The nonlinearity could be also seen in the potential function for the y-component after peripheral viewing the 3D video clip with backgrounds (Fig. 3f).
In [24], a two-way analysis of variance (ANOVA) was conducted 15 times on these factors. In addition, the influence of the exposure to the video clips on our equilibrium system was investigated in comparison with the control data (I). The two-way ANOVA on the sway values did not reveal an interaction between any pair of two factors. According to the two-way ANOVA whose factors were set as the solidity and the persistency, the former primary effect was observed from the total locus length per unit area during/after viewing the video clips with the background. Furthermore, the main effect of the background presence was observed from the total locus length per unit area during/after exposure to a 2D video clip in accordance with two-way ANOVA, whose factors were set to be the presence of the background and the persistency of the visual stimulus. We also found the same main effect while calculating the SPD S3 during/after exposure to a 3D video clip, in accordance with two-way ANOVA.
The sway values, 0–2 min after the cutoff of the visual stimulus, also revealed that our equilibrium system was affected by the video clips with the background [24]. The sway values 2–3 min after the cutoff of the visual stimulus suggested that our equilibrium system was affected by the video clips with/without the background. The  of the upright posture might deteriorate in our equilibrium function. Conversely, the effect of the exposure to the video clips on our equilibrium function can
  for 0–2 min. In contrast, the sway values 0–2 min after the cutoff of the visual stimulus suggested that our equilibrium system was not affected by the video clips without the background. Subjects tracked the sphere in the video clips owing to the absence of a background, and the VIMS did not occur by visual pursuit. Peripheral viewing could induce motion sickness, as our previous studies suggested.
In this study, we observed the VIMS by conducting the stabilometry. The sway values  during/after peripherally viewing video clips. On the contrast, we focused on a 3D game machine to increase knowledge about the influence of stereoscopic images on the body in the last conference. Changes in brain blood flow while playing the game were compared between playing using the 2D and 3D displays by measuring NIRS [25]. Visual area may have been activated when playing the game with 3D images compared to activation by 2D. 3D images may have a large influence on the left temporal lobe because thinking is required while playing the game.
It  that there are two different
  streams (
 and dorsal) as shown in Fig. 4.
  an object and spatial vision [26] or color/form and motion vision [27]. The later proceeds in an unconscious state, which may be corresponding to the 3D sickness induced by peripherally viewing. We will examine whether the exposure to sufficient loadings of 3D video clips affects the brain activity in the dorsal stream in the next step.

The vental stream and the dorsal stream
References
Suzuki, J., Matsunaga, T., Tokumatsu, K., Taguchi, K., Watanabe, I.: Q & A and a manual in stabilometry. Equipment Res. 55, 64–77 (1996). (in Japanese)
Ukai, K., Howarth, P.A.: Visual fatigue caused by viewing stereoscopic motion images. Displays 29, 106–116 (2008)
Kennedy, R.S., Lane, N.E., Berbaum, K.S., Lilienthal, M.G.: Simulator sickness questionnaire: an enhanced method for quantifying simulator sickness. Int. J. Aviat. Psychol. 3, 203–220 (1993)
Himi, N., Koga, T., Nakamura, E., Kobashi, M., Yamane, M., Tsujioka, K.: Differences in autonomic responses between subjects with and without nausea while watching an irregularly oscillating video. Auton. Neurosci. Basic Clin. 116, 46–53 (2004)
Holomes, S.R., Griffin, M.J.: Correlation between heart rate and the severity of motion sickness caused by optokinetic stimulation. J. Psychophysiol. 15, 35–42 (2001)
Yokota, Y., Aoki, M., Mizuta, K.: Motion sickness susceptibility associated with visually induced postural instability and cardiac autonomic responses in healthy subjects. Acta Otolaryngol. 125, 280–285 (2005)
Scibora, L.M., Villard, S., Bardy, B., Stoffregen, T.A.: Wider stance reduces body sway and motion sickness. In: Proceedings of VIMS 2007, pp. 18–23 (2007)
Takada, M., Fukui, Y., Matsuura, Y., Sato, M., Takada, H.: Peripheral viewing during exposure to a 2D/3D video clip: effects on the human body. Env. Health Prev. Med. 20(2), 79–89 (2015)
Takada, M., Miyao, M., Takada, H.: Subjective evaluation of peripheral viewing during exposure to a 2D/3D video clip. In: Proceedings of IEEE VR 2015, pp. 291–292 (2015)
Winter, D.A., Patla, A.E., Prince, F., Ishac, M.: Stiffness control of balance in quiet standing. J. Neurophysiol. 80, 1211–1221 (1998)
Fukui, Y., Mori, Y., Kinoshita, F., Takada, H.: A study of body sway on slopes with tilt angles of 10° and 20°. IEICE Technical rep., vol. 114, no. 361, pp. 7–10 (2014)
Okawa, T., Tokita, T., Shibata, Y., Ogawa, T., Miyata, H.: Stabilometry: significance of Locus Length Per Unit Area (L/A). Equipment Res. 54(3), 283–293 (1995)
Takada, H., Kitaoka, Y., Ichikawa, M., Miyao, M.: Physical meaning on geometrical index for stabilometry. Equipment Res. 62, 168–180 (2003)
Shimizu, Y., Takada, H., Kitaoka, Y., Nakayama, M.: Degrees of deterministic of sway of center-of-gravity with alcoholic intake. Equipment Res. 66(1), 1–8 (2007)
Takada, H., Kitaoka, Y., Miyao, M., Matsuura, Y.: To set up standards for new indices in stabilometry. In: Proceedings of the 5th International Workshop on Biosignal Interpretation, pp. 203–206 (2005)
Goldie, P.A., Bach, T.M., Evans, O.M.: Force platform measures for evaluating postural control: reliability and validity. Arch. Phys. Med. Rehabil. 70, 510–517 (1986)
Collins, J.J., De Luca, C.J.: Open-loop and closed-loop control of posture: a random-walk analysis of center of pressure trajectories. Exp. Brain Res. 95, 308–318 (1993)
Newell, K.M., Slobounov, S.M., Slobounova, E.S., Molenaar, P.C.: Stochastic processes in postural center of pressure profiles. Exp. Brain Res. 113, 158–164 (1997)
Emmerrik, R.E.A., Van Sprague, R.L., Newell, K.M.: Assessment of sway dynamics in tardive dyskinesia and developmental disability: sway profile orientation and stereotypy. Mov. Disord. 8, 305–314 (1993)
Takada, H., Kitaoka, Y., Shimizu, Y.: Mathematicha index and model in stabilometry. Forma 16, 17–46 (2001)
Asai, Y., Tasaka, Y., Nomura, K., Nomura, T., Casadio, M., Morasso, P.: A model of postural control in quiet standing: robust compensation of delay-induced instability using intermittent activation of feedback control. PLoS ONE 4(7) (2009). Article no. e6169
Takada, H., Fujikake, K., Omori, M., Hasegawa, S., Watanabe, T., Miyao, M.: Reduction of body sway can be evaluated by sparse density during exposure to movies on liquid crystal displays. In: Proceedings of International Federation for Medical and Biological Engineering (IFMBE), vol. 23, pp. 987–991 (2008)
Takada, H., Miyao, M.: Visual fatigue and motion sickness induced by 3D video clip. Forma 27, S67–S76 (2012)
Takada, H., Mori, Y., Miyakoshi, T.: Effect of background viewing on equilibrium systems. In: Antona, M., Stephanidis, C. (eds.) UAHCI 2015. LNCS, vol. 9176, pp. 255–263. Springer, Cham (2015). doi:10.1007/978-3-319-20681-3_24
Takada, M., Mori, Y., Kinoshita, F., Takada, H.: Changes in brain blood flow by the use of 2D/3D games. In: Antona, M., Stephanidis, C. (eds.) UAHCI 2016. LNCS, vol. 9739, pp. 516–523. Springer, Cham (2016). doi:10.1007/978-3-319-40238-3_49
Ungerleider, L.G., Mishkin, M.: Two cortical visual systems. In: Ingle, D.J., Mansfield, R.J.W., Goodale, M.A. (eds.) The Analysis of Visual Behavior, pp. 549–586. MIT Press, Cambridge (1982)
Van Essen, D.C., Maunsell, J.H.R.: Hierarchical organization and functional streams in the visual cortex. Trends Neurosci. 6, 370–375 (1983)
Acknowledgements
This work was supported in part by the Japan Society for the Promotion of Science, Grant-in-Aid for Scientific Research (B) Number 24300046 and (C) Number 26350004.
Author information
Authors and Affiliations
Corresponding author
Editor information
Editors and Affiliations
Rights and permissions
Copyright information
© 2017 Springer International Publishing AG
About this paper
Cite this paper
Miyao, M., Takada, H., Sugiura, A., Kinoshita, F., Takada, M., Ishio, H. (2017). Temporal Evolution in Potential Functions While Peripheral Viewing Video Clips with/without Backgrounds. In: Antona, M., Stephanidis, C. (eds) Universal Access in Human–Computer Interaction. Human and Technological Environments. UAHCI 2017. Lecture Notes in Computer Science(), vol 10279. Springer, Cham. https://doi.org/10.1007/978-3-319-58700-4_38
Download citation
DOI: https://doi.org/10.1007/978-3-319-58700-4_38
Published:
Publisher Name: Springer, Cham
Print ISBN: 978-3-319-58699-1
Online ISBN: 978-3-319-58700-4
eBook Packages: Computer ScienceComputer Science (R0)