
Abstract
Phase response curves (PRCs) describe how neurons respond to brief, transient input pulses.
This is a preview of subscription content, log in via an institution.
Buying options
Tax calculation will be finalised at checkout
Purchases are for personal use only
Learn about institutional subscriptionsNotes
- 1.
The graph of f is often called the phase transition curve. I don’t use this terminology to avoid confusion with the phase response curve.
Figure 25.4 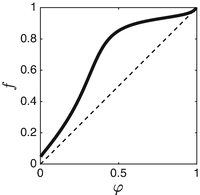
Interaction function f = f(φ) = φ + g(φ) derived from Fig. 25.2. The dashed line is f ≡ φ. [RTM_INTERACTION_FUNCTION]

Bibliography
C. Börgers, M. Krupa, and S. Gielen, The response of a population of classical Hodgkin-Huxley neurons to an inhibitory input pulse, J. Comp. Neurosci., 28 (2010), pp. 509–526.
C. Börgers and B. Walker, Toggling between gamma-frequency activity and suppression of cell assemblies, Frontiers in Computational Neuroscience, 7, doi: 10.3389/fncom.2013.00033 (2013).
G. B. Ermentrout, L. Glass, and B. E. Oldeman, The shape of phase-resetting curves in oscillators with a saddle node on an invariant circle bifurcation, Neural Comp., 24 (2012), pp. 3111–3125.
M. A. Farries and C. J. Wilson, Phase response curves of subthalamic neurons measured with synaptic input and current injection, J. Neurophysiol., 108 (2012), pp. 1822–1837.
D. Hansel, G. Mato, and G. Meunier, Synchrony in excitatory neural networks, Neural Comp., 7 (1995), pp. 307–337.
A. T. Winfree, The Geometry of Biological Time, second edition, Springer-Verlag, 2001.
Author information
Authors and Affiliations
1 Electronic Supplementary Material
Below is the link to the electronic supplementary material.
Rights and permissions
Copyright information
© 2017 Springer International Publishing AG
About this chapter
Cite this chapter
Börgers, C. (2017). Phase Response Curves (PRCs). In: An Introduction to Modeling Neuronal Dynamics. Texts in Applied Mathematics, vol 66. Springer, Cham. https://doi.org/10.1007/978-3-319-51171-9_25
Download citation
DOI: https://doi.org/10.1007/978-3-319-51171-9_25
Published:
Publisher Name: Springer, Cham
Print ISBN: 978-3-319-51170-2
Online ISBN: 978-3-319-51171-9
eBook Packages: Mathematics and StatisticsMathematics and Statistics (R0)