
Abstract
There is a pressing need in the modern business environment for business-supporting software products to address countless consumers’ desires, where customer orientation is a key success factor. Consumer preference is thus an essential input for the requirements elicitation process of public-facing enterprise systems. Previous studies in this area have proposed a process to capture and translate consumer preferences into system-related goals using the Consumer Preference Meta-Model (CPMM) used to integrate consumer values from the marketing domain into objectives of information systems. However, there exists a knowledge gap between how this process can be automated at a large scale, when massive data sources, such as social media data, are used as inputs for the process. To address this problem, a case in which social media data related to four major US airlines is collected from Twitter, is analyzed by a set of text mining techniques and hosted in a consumer preference model, and is further translated to goal models in the ADOxx modelling platform. The analysis of experimental results revealed that the collection, recognition, model creation, and mapping of consumer preferences can be fully or partly automated. The result of this study is a semi-automated method for capturing and filtering consumer preferences as goals for system development, a method which significantly increases the efficiency of large-scale consumer data processing.
You have full access to this open access chapter, Download conference paper PDF
1 Introduction
Deep insight into various consumer preferences provides a basis for companies to design better, customized services for different customer segments. In the current business environment, where consumers are often bombarded with multiple alternatives for the same product or service, understanding their preferences becomes a competitive advantage for business entities [1]. Accordingly, consumer preferences should be taken into consideration in the development process of customer-facing enterprise systems. A challenge of consumer value-oriented requirements engineering (RE) compared to the traditional RE process is the necessary amount of input information that system analysts must collect and manage: to efficiently address the desire of countless consumers, they must take into account a wide variety of consumer preferences, not only from existing consumers, but also from potential ones.
Conventional methods to gather consumer information such as marketing surveys or interviews possess a critical disadvantage in the development of public systems: they can be difficult to conduct on a large scale without expert assistance. Additionally, interviews—perhaps the most commonly employed consumer preference discovery method—are not economically tractable or practically feasible for more than perhaps a few dozen customers, particularly in the area of requirements elicitation and discovery.
An alternative way for collecting preferences from the public is utilizing social media, which has become increasingly popular within the last decade. Using social media, companies have the ability to treat the market as a “conversation” between businesses and their customers instead of the more traditional “one-way marketing” [2]. Social media data reflects the most updated trends and real-time opinions of the general public, many of which may contain the preference of consumers towards public-facing systems.
The diversity of consumer opinions derived from social media is not only an advantage for enterprises, but also a challenge. Since information systems are generally not able to address the desire of every consumer in the community, it is more feasible to concentrate development efforts on functionalities that are of interest to sufficiently large groups of users. Therefore, the process of capturing preferences from social media needs to be guided by a methodological framework which enables consumer profiling and priority measuring.
In their previous paper [3], the authors proposed such a method to accommodate consumer preferences within the software development process. The main aspect of this method is to link consumer modeling using a predefined Consumer Preference Meta-Model (CPMM) with Goal-Oriented Requirements Engineering (GORE). CPMM bridges consumer opinion analysis and system-related goals by categorizing recognized preferences, as well as prioritizing them based on importance. Issues such as resource allocation, as well as proper slotting for developing different system components, make such categorization and prioritization vital. CPMM functions as a cleaner for massive data, a conceptual model housing key information derived from the processed data, and a resource capable of spawning additional elements for system development. At a high-level, the proposed method involves three major steps: (i) collect input data from consumers, recognize consumer preferences, and determine their importance; (ii) initialize an instance of CPMM; and (iii) derive goals for the development of supporting systems from the consumer values captured and prioritized in the instance of CPMM. While results of related case studies [4] proved the feasible process for capturing consumer preferences, most of the major steps in this method were conducted manually.
The study aims to explore possibilities for automation in the consumer preference capture and categorization process and their mapping to goals for information systems, to address the knowledge gap of how the method can be applied when a high-volume data source from social media is used as input for the process.
The paper is structured as follows. Section 2 briefly describes related concepts, background theories, and previous studies. Section 3 introduces a semi-automated consumer preference capture process with the assistance of context-aware text mining techniques. Section 4 demonstrates the feasibility of the proposed method by applying it to a case study. Section 5 presents the conclusions and future work.
2 Theoretical Foundations and Related Work
2.1 Consumer Preference as a Value
In business modelling, a transaction is an exchange of value objects between actors. In [5], a definition of value object is given as something that carries economic value for at least one actor. A value object can for instance be a physical product such as books, or a service such as internet access [6].
According to [7], customer experience is also recognized as a value. Although this type of value cannot be transferred directly from one actor to another and has no associated ownership and legal rights, it still plays an important role in the value exchange process between a business entity and its customer. For example, when a client feels secure about an online payment service provided by a bank, there is a higher chance that the client would use this service. A client feeling secure, which can be neither valued directly nor transferred, acts as an internal driver that encourages the client to choose that specific service.
The concept of consumer preference can be broken down into two types: attribute-based, where the preference of one brand over another brand is determined by attribute-to-attribute comparison, and attitude-based, involving the general attitude at the time of preference judgment [8]. In marketing science, consumer preference is defined as “the subjective tastes, as measured by utility, of various bundles of goods” [9].
2.2 Holbrook’s Typology of Consumer Value
In the context of this study, consumer preferences as a value are refined in Holbrook’s Typology [10], a well-known framework from product marketing in which three value dimensions provide a basis to classify the motivations that cause people to consume products and services: Extrinsic/Intrinsic, Self-oriented/Other-oriented, and Active/Reactive. Each intersection of these three dimensions forms an archetype representing a unique type of value in the consumption experience (Table 1):
Extrinsic values correspond to consumption experiences determined by the functionalities of a service or product which can act as a means to complete some goals or objectives of the consumer. Intrinsic, on the other hand, is when the driver behind consumption is the pleasure of using the product or service itself. A traveler may decide to use a particular airline because it provides the fastest flight between two cities (Extrinsic) or because of a desire to experience world-class service (Intrinsic). With the Active dimension, a consumer controls their experience and enjoys the process of consuming a product or service, and such consumption can be either physical or mental. For example, a traveler prefers an airline service since it provides amazing in-flight entertainment and delicious meals. On the contrary, in a Reactive value, the experience when using the good or service controls the consumer. For instance, a traveler can be attracted to an airline when they are impressed by an airplane co-branded to promote a current blockbuster movie. Value is Self-oriented when a consumer evaluates some aspects of the consumption for their own sake. For example, an airline service brings value to a client when it enables them to conveniently travel to a desired destination. Conversely, Other-oriented value occurs when a consumer uses a service or product for the sake of others. “Others” in this case can be on a micro-level such as friends, family or a macro-level like society or community. For example, a traveler decides to purchase the service of an airline because it promises to donate five percent of each ticket purchased to charitable causes.
2.3 The Consumer Preference Meta-Model
CPMM presented in Fig. 1 is used to house, classify, and categorize consumer preferences for products or services.

The consumer preference meta-model (CPMM)
CPMM aims to elicit the preferences from different sources of data, as well as to manage them according to different value frameworks as shown in our previous studies [3, 4, 11].
Class Actor contains both Consumer and Provider, economically independent entities that are the primary participants within the ValueExchange of the focus of the Consumers’ aspirations - Products or Services.
Consumer Driver is the preference that drives a consumer’s evaluative process as they seek fulfillment. It can be taken from different frameworks, such as Holbrook’s Typology, and houses the top level of a taxonomy of consumer values. The second level of the taxonomy are the terms which Holbrook designates as the synonyms to his primary typological terms, as seen in Table 1. The final of the three levels is Vocabulary, developed by using the Oxford English Dictionary (OED) to provide synonyms for the second level. Open Class represents any other considered value framework that is of type Consumer Driver. Examples of value frameworks analyzed in our previous work include Schwartz’s Basic Values [12], Aaker’s Brand Personality [13], and Maslow’s Hierarchy of Needs [14]. Holbrook was chosen for this work because of its origins as a consumer preference-specific framework, as opposed to others from psychology and advertising.
Measure is aggregated in Consumer Driver by Qualitative Measure and Quantitative Measure, with the first describing an “unrefined” preference, while the latter quantifies its importance for a Product/Service for eventual support by System Component(s). Depending on the source of data, as well as of the domain of interest, both Qualitative and Quantitative Measures could vary in the number of attributes for consideration.
Context of Use and Context of Use Type indicate when the activity that is the focus of the tweet occurs, either the intention behind that activity or at the time/place of writing. Demographics and Demographic Type classes situate Consumer and assist in consumer profiling - including home city, URLs within the profile, descriptive text and keywords from the profile, as well as any geolocation data that might be present.
2.4 Natural Language Processing
Streaming data collected from Twitter is in the form of free text and contains a limitless variety of topics. Unlike mainstream textual datasets such as newspapers, the style of there is no restriction in terms of writing standard for social media. People thus make use of jargon, slang, emoticons, informal abbreviations, and URLs, causing many challenges in processing the tweets on a large scale. For this reason, multiple text mining techniques must necessarily be applied to the collected raw textual data to assist the tasks of preprocessing, context analysis, and recognition of significant information.
Sentiment analysis aims to determine the attitude of a speaker regarding some topic, which is used in this study as one of the Quantitative Measures for collected preferences. Sentiment analysis is the process of identifying the polarity of the opinions, emotions, and evaluations captured in the text by classifying via the distinct labels positive, neutral or negative [15].
n-gram Analysis and Term Co-occurrence.
To recognize popular preferences in a group of consumers’ opinions, a natural approach is to look at words with high frequency of occurrence, because such words may carry useful information about common thoughts among multiple consumers. However, a single word usually cannot reflect the meaning of an entire sentence containing that word due to the diversity of the spoken context. This leads to the need of a context-aware method for term frequency analysis such as n-gram and term co-occurrence.
An n-gram is a slice of n consecutive elements of a longer string [16], in which n is a positive integer indicating the size of word sequence. An n-gram with only one element is usually referred to as “unigram” while larger values of n create “bigram” (n = 2), “trigram” (n = 3), and so on. N-grams carry more context-related information than a unigram. Term co-occurrence is similar to n-gram but is not limited to consecutive words. This type of analysis takes into account the co-occurrence of any combination of words.
Python was used as the main scripting language, and the necessary text mining techniques were provided by the Natural Language Toolkit (NLTK), a leading open source platform supporting the analysis of human language data [17].
3 Semi-automated Process for Capturing Consumer Preferences
In this section, we present the design of a semi-automated process to capture consumer preferences from social media and translate them into system-related goals. The process involves the following steps: Data collection, Data cleaning and pre-processing, Qualitative measure recognition, Quantitative measure calculation, Constructing CPMM instances and Mapping CPMM instances to i* goal model. An overview of the process design is presented in Fig. 2 below.

Design of the semi-automated consumer preference capturing process
3.1 Data Collection
Utilizing the collaborative tools that are the foundation of Web 2.0, over the past decade a wide variety of social networking sites such as Facebook, YouTube and Flickr, have sprung up, creating a vast repository of data. Among the various websites available, two characteristics were used to choose a source for this research: (i) contain detailed personal information from which consumer preferences can be collected; and (ii) the designated content can be processed via existing text mining techniques.
The micro-blogging service Twitter was chosen as the social media data source for several reasons. First, whereas traditional blogs have no real size limit, micro-blogging is defined as having a strict limitation on message size (a tweet can be no more than 140 characters). This restriction provides an important advantage: it forces concision and directness in posts. A tweet is therefore often more expressive and univocal than a normal blog [18]. This is important for the precision of opinion mining techniques such as sentiment analysis as determining the polarity of short pieces of text tends to be more accurate. It is in this first step of the process that tweets are collected automatically using programming interfaces provided by Twitter [19].
3.2 Data Cleaning and Pre-processing
In this phase, data collected from the previous step is preprocessed and stored for further analysis. Twitter uses JSON objects to transfer data between the programming interfaces to the client’s machine but JSON objects are structured as a set of multi-level nested dictionaries and lists which are inconvenient for instant access to any attribute under interest. Both redundant data and the complex structure of the JSON text objects hinder effective data queries from being executed for further analysis purposes. To resolve these issues of the raw data source, we developed a solution to parse JSON objects, filter out unnecessary information and store clean data in a well-organized form by using a database which provides an efficient, non-redundant data repository with fast query capability.
3.3 Qualitative Measure Recognition
The next step is to extract the preferences from the scrubbed dataset. Since the tweet content is natural language and has a high level of ambiguity, fully automated recognition of system-related ideas was not feasible in practice. We therefore used a set of computer-aided techniques to simplify the effort of data analysts.
Here, Qualitative Measures are extracted from the collected tweets. Text mining techniques designed for context-awareness such as n-gram analysis and term co-occurrence are utilized to help users, such as system analysts and requirements engineers, detect popular system-related preferences from the consumer community. This semi-automated approach is described as a sequence of the following steps:
-
i.
Develop a list of information system-related “seed words” that are relevant to the functionalities of the future system using subject-matter expertise as well as related sources such as domain ontologies and industrial standards. These seed words are also considered as measures: groups of related qualitative measures in CPMM.
-
ii.
Examine the popularity of seed words in the tweet database using term frequency analysis.
-
iii.
Refine term frequency results using context-aware text mining techniques (n-gram and term co-occurrence) to discover potential qualitative measures.
-
iv.
Analyze the set of refined tweets, record qualitative measures, and classify them to an appropriate consumer value category.
The approach employs a keyword filtering method to scan through the dataset and locate potential preferences. Acquiring a complete set of seed words from domain-specific documents and industrial standards is thus a key success factor of this phase.
3.4 Quantitative Measure Calculation
In this step, a set of scripts are developed to calculate and extract priority metrics for features recognized from the dataset. Assuming that certain opinions wield greater influence (for example coming from a public figure or celebrity) these would in turn have greater impact upon the preferences of the general public and thus offer a clearer path to uncover the common preference of a certain community. Therefore, a higher priority should be given to the consumer preferences with:
-
Higher influence (influence-based Quantitative Measures). Messages tweeted by a high-influence individual disproportionately affect the opinion of a wider group of social network users, and thus better represent the desire of a larger consumer community.
-
Higher number of distinct tweets sharing a preference (similarity-based Quantitative Measures). If the rebooking function is mentioned in 50 tweets while the seat changing function is mentioned in 15 tweets, rebooking should be prioritized.
-
Higher rate of negative sentiment (sentiment-based Quantitative Measures). If a function receives too much negative feedback, there should be immediate action taken to improve that function in the future system.
This research employs and extends the social influence metrics for Twitter messages defined in [20] for Influence-based quantitative measures. While these metrics aim to assess the influence of single tweets, this research focuses more on groups of tweets that share similar opinions. Additionally, because analysis needs and data sets differ widely. CPMM allows social influence metrics to be flexibly assigned.
This study makes use of the following, differing from [11] which made use of a derived measure called “social weight”:
-
Follower measure (FM): The total number of followers of users who post a group of related tweets. The more followers a group of users has, the more influential this group of users is.
-
Reply measure (RpM): The total number of replies to all tweets in a group. The more replies a group of tweets receives, the more influential it is.
-
Retweet measure (RtM): The total number of times all tweets in the group are retweeted. Greater influence is indicated based on the frequency of retweets.
Regarding similarity-based and sentiment-based quantitative measures, we extend these metrics by introducing two more measurements:
-
Similarity-based quantitative measures (SiM): The number of tweets sharing the same consumer preference. Distinct tweets mentioning a common consumer preference should receive higher priority.
-
Sentiment-based quantitative measures (SeM): The dominant (> 50 %) sentiment label among a group of related tweets. For example, an SeM of Negative would be given to a group of 20 tweets mentioning a common preference in which 12 tweets are labeled as Negative, 5 as Neutral, and 3 as Positive.
3.5 Building CPMM Instance
Up to this step of the process, a list of measures and Qualitative Measures with corresponding Quantitative Measures has been defined and classified into relevant Consumer Value categories. In other words, the data processing phase is completed and sufficient information has been gathered to construct a consumer preference model. In this step, an automated tool is developed to generate CPMM instances from collected, processed data. A configuration interface is also provided for users to set model generation parameters, allowing users to control the size of generated models and to focus on particular areas depending on their particular analysis needs.
3.6 Mapping CPMM Instances to i* Goal Model
In the final step of the process, an automated tool maps CPMM instances generated in the previous steps to i* goal models. This is an implementation of mapping rules from CPMM to i* defined in [3]. Some adjustments are made to these rules to cope with the automation context. Table 2 below lists the revised mapping rules:
4 Case Study: Consumer Preferences in the Airlines Industry
The selected case study for this research is the requirement development for a customer self-service system of four major US-based airlines: American, United, Delta, and JetBlue. Most aspects of the airlines’ customer service have been assisted by information systems. For this reason, when a passenger comments or provides feedback about airline services, there is a high likelihood to relate the comment to a respective system function. Also, the high volume of passengers using airline services results in a large customer community. According to [21], the US airline industry transported a total number of 769 million passengers in 2007. Given the popularity of Twitter in the US, tweets related to these airlines can be considered as a promising source of social media data to capture consumer preferences for an information system.
4.1 Application of the Semi-automated Consumer Preference Process
Step 1: Data Collection.
To capture only the relevant tweets, the Python script’s listening stream is filtered with Twitter mentions corresponding to the selected airlines: @AmericanAir, @united, @Delta and @JetBlue.
To maximize the likelihood that relevant consumer preferences can be captured, we ran the listening script around the time of the winter storm Jonas from 21 to 25 January 2016. This was based on the assumption that an increase in storm-related flight delays would result in more customer tweets about the airlines’ services, thus increasing the chance for system-related consumer preferences. Approximately 212 megabytes of plain text data were captured during this period, corresponding to 51,397 single tweets.
Step 2: Data Cleaning and Pre-processing.
Textual data collected in the previous step was converted to SQLite tables for further querying purposes. Results of this step involve SQLite tables containing 51,397 tweets posted by 29,784 distinct Twitter users. 48,733 of these tweets are in English and thus useable for further analysis.
Step 3: Qualitative Measure Recognition.
Since a keyword-based filtering method is utilized, the first task is to construct a complete and reliable list of seed words related to information systems in the airline industry. To ensure that the seed word list was constructed from both academic and practical perspectives, a set of academic publications [22, 23] and industry reports about IT strategies and ICT trends in the aviation domain [24] were consulted.
Having the list of seed words constructed, the next task was to apply the four-step process designed in Sect. 3.2 to identify useful tweets. Since the application of the process for the entire list is highly detailed, this process is demonstrated by the following example. In the case where the analyst is interested in discovering consumer preferences related to the email notification function of a future system, the corresponding process is as follows:
-
i.
Select “email” from the list of seed word list.
-
ii.
Use term frequency analysis to assess how often consumers mention “email” in their tweets. From the dataset the word “email” appears in 308 of 48,773 tweets, which is sufficient for further analysis.
-
iii.
Use bigram/trigram analysis and co-occurrence analysis techniques to analyze the context in which the word “email” is used. In the case study, applying term co-occurrence with the seed word “email”, it is revealed that the most common words that co-occur with “email” are “cancelled” (or “canceled”) and “flight” (65 tweets). This leads to an initial idea that many consumers demand an email notification function when their flights are cancelled.
-
iv.
Finally, filter the tweets containing these three co-occurring words in the database. Part of the result is shown in the following Fig. 3:
Fig. 3. 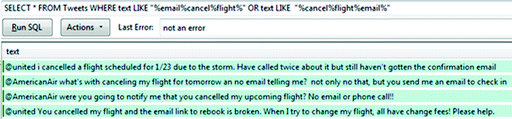
Qualitative measure recognition from the seed word “email”

From four filtered tweets in this figure, two qualitative measures can be derived:
-
Notification email should be sent to travelers when a flight is cancelled). This qualitative feature—Efficiency—is indicated by the first three tweets.
-
Reliable rebooking functions should be provided via email when a flight is cancelled. This qualitative feature—Excellence—is suggested by the fourth tweet.
Step 4: Quantitative Measure Calculation.
In this step, Quantitative Measures are automatically calculated for the captured Qualitative Measures as seen in Fig. 4.

Illustration of quantitative measure calculation
The result of this step is a list of selected tweets with qualitative features captured and classified into the relevant Holbrook archetype.
Step 5: Constructing CPMM Instances.
By this step, input data for CPMM has been completely prepared. Additionally, we developed a tool to read this input data and generate CPMM instances, one that allowed users to configure model generation parameters depending on their analysis demands. These parameters are defined around core elements of CPMM, including Context of Use, Consumer Driver (archetype) and Quantitative Measure. As seen in Fig. 5, only qualitative measures satisfying the following criteria are represented in CPMM instances:

A CPMM instance for the described example, utilizing Delta and JetBlue
-
Only measures belonging to Efficiency and Ethics categories are considered.
-
Only system-related preferences from Delta and JetBlue customers are selected.
-
Minimum Follower Measure (FM) of 25,000, which means ideas of selected preferences can be spread over a community of 25,000 Twitter users.
Step 6: Mapping CPMM Instances to i* Goal Model.
In the final step, CPMM instances are mapped to SDM and SRM models by an automated tool utilizing ADOxx. Following the same example with the previous step, the SRM model is shown in Fig. 6 below.

Generated i* SRM model
4.2 Case Study Summary
Applying the semi-automated consumer preference capturing process to this case study, 1,374 tweets containing possible features for the future customer self-service system have been recognized from a dataset of 48,733 tweets collected in English. These tweets were posted by a community of 1,183 distinct Twitter users. 207 qualitative features have been derived from the selected tweets into 18 groups of features.
5 Discussion, Conclusions and Future Work
In this research, we have (i) designed a semi-automated method with the assistance of automated techniques based on natural language processing to recognize preferences; (ii) proposed adjustments to the mapping rules from CPMM to i* to utilize social media data collected from Twitter; (iii) defined the revised CPMM meta-model in ADOxx; and (iv) implemented an automated mapping from CPMM instances to i* goal models.
The extent to which the entire process can be automated can be concluded as follows. Five of the six steps of the proposed method (Data collection, Data cleaning and pre-processing, Quantitative measure calculation, Constructing CPMM instances and Mapping CPMM instances to i* goal model) can be fully automated with the implementation of different Python modules. The remaining step (Qualitative measure recognition) is a combination of sub-activities, in which classification of captured preference and feature definition are handled manually. Although preference classification can be automated with text classification techniques, it is not the focus of this study. Feature definition, i.e. writing the system features suggested by selected tweets in requirement engineering terms, is a pure natural language expression task and therefore cannot be supported by automation techniques. The other sub-activities can be partially automated with the term frequency and occurrence analysis tools.
This research extends work presented in [3, 4, 11] as the part of an overall effort to move consumer preferences toward greater model orientation. It considers opportunities for automation related to the development and application of the Consumer Preference Meta-Model to support user preferences according to their value-related content and segmentation, as well as the quantitative thresholds set by decision makers. In the semi-automated method introduced by this research, CPMM functions as the connecting bridge between consumer opinion analysis and system-related goal definition, in addition to facilitating the design of a method which categorizes recognized features into different consumer segments and prioritizes those features by quantitative measures. CPMM is thus equivalent to the role of Business Intelligence (BI) solutions, allowing business analysts to observe enterprise data from various dimensions and, depending on the analysis demand, present only the most significant and appropriate information.
Additionally, this research extends the social influence metrics for Twitter messages defined by Ye [20] by introducing Similarity Measure (SiM) and Sentiment Measure (SeM). These new influence metrics are useful for situations where opinions are extracted from a group of tweets instead of single and isolated tweets.
In terms of practical contributions, this study demonstrates a set of tools implemented in Python to automate different aspects and activities of the consumer preferences capture process. Additionally, CPMM was defined as a class library in ADOxx, thus serving as a machine-processable representation of this meta-model.
For future work, classification techniques from the data mining domain such as Naïve Bayes, Decision Tree or k-Nearest Neighbors can be employed to automate the preference classification task in the method. Different factors affecting the sentiment analysis of collected tweets such as sarcasm and negation should also be considered more carefully in future research. This would ensure the significance of Sentiment Measure when applying the proposed method for consumer preferences capturing.
References
Carpenter, G.S., Nakamoto, K.: Competitive strategies for late entry into a market with a dominant brand. Manag. Sci. 36, 1268–1278 (1990)
Lusch, R., Liu, Y., Chen, Y.: The phase transition of markets and organizations: the new intelligence and entrepreneurial frontier. IEEE Intell. Syst. 25(1), 71–75 (2010)
Zdravkovic, J., Svee, E.-O., Giannoulis, C.: Capturing consumer preferences as requirements for software product lines. J. Requirements Eng. 20(1), 71–90 (2015). doi:10.1007/s00766-013-0187-2. Springer
Svee, E.O., Zdravkovic, J.: Case-based development of consumer preferences using brand personality and values co-creation. In: Ralyté, J., España, S., Pastor, O. (eds.) The Practice of Enterprise Modeling. LNBIP, vol. 235, pp. 159–173. Springer, Heidelberg (2015)
Weigand, H., Johannesson, P., Andersson, B., Bergholtz, M., Edirisuriya, A., Ilayperuma, T.: On the notion of value object. In: Dubois, E., Pohl, K. (eds.) Advanced Information Systems Engineering. LNCS, vol. 4001, pp. 321–335. Springer, Heidelberg (2006)
Schuster, R., Motal, T.: From e3-value to REA: modeling multi-party e-business collaborations. In: 2009 IEEE Conference on Commerce and Enterprise Computing. IEEE (2009)
Gordijn, J., Akkermans, H., Van Vliet, H.: Business modelling is not process modelling. In: Liddle, S.W., Mayr, H.C., Thalheim, B. (eds.) Conceptual Modeling for E-Business and the Web. LNCS, vol. 1921, pp. 40–51. Springer, Heidelberg (2000)
Mantel, S.P., Kardes, F.R.: The role of direction of comparison, attribute-based processing, and attitude-based processing in consumer preference. J. Consum. Res. 25(4), 335–352 (1999)
Veres, Z., Tarjan, T., Hamornik, B.P.: Product attribute preferences–a multidisciplinary approach. Eur. Sci. J. 1, 1–10 (2014)
Holbrook, M.B.: Introduction to consumer value. In: Consumer Value: A Framework for Analysis and Research, pp. 1–28 (1999)
Svee, E.O., Zdravkovic, J.: A model-based approach for capturing consumer preferences from crowdsources: the case of Twitter. In: 10th International Conference on Research Challenges in Information Science (RCIS), pp. 65–76. IEEE Press (2016)
Schwartz, S.: Basic human values: their content and structures across countries. In: Tamayo, A., Porto, J.B. (eds.) Values and Behavior in Organizations, Vozes, pp. 21–55 (2005)
Aaker, J.L.: Dimensions of brand personality. J. Mark. Res. 34(3), 347–356 (1997)
Maslow, A.: Motivation and Personality. Harper, New York (1954). ISBN 0060419873
Wilson, T., Wiebe, J., Hoffmann, P.: Recognizing contextual polarity in phrase-level sentiment analysis. In: Proceedings of the Conference on Human Language Technology and Empirical Methods in Natural Language Processing. Association for Computational Linguistics (2005)
Cavnar, W.B., Trenkle, J.M.: N-gram-based text categorization. Ann Arbor MI 48113(2), 161–175 (1994)
Bird, S., Klein, E., Loper, E.: Natural Language Processing with Python—Analyzing Text with the Natural Language Toolkit. O’Reilly Media, Sebastopol (2009)
Kontopoulos, E., Berberidis, C., Dergiades, T., Bassiliades, N.: Ontology-based sentiment analysis of twitter posts. Expert Syst. Appl. 40(10), 4065–4074 (2013)
Twitter Streaming APIs. https://dev.twitter.com/streaming/overview
Ye, S., Wu, S.: Measuring message propagation and social influence on Twitter.com. In: Bolc, L., Makowski, M., Wierzbicki, A. (eds.) SocInfo 2010. LNCS, vol. 6430, pp. 216–231. Springer, Heidelberg (2010)
Belobaba, P., Odoni, A., Barnhart, C.: The Global Airline Industry. Wiley, Hoboken (2015)
Buhalis, D.: eAirlines: strategic and tactical use of ICTs in the airline industry. Inf. Manag. 41(7), 805–825 (2004)
Chu, R.: What online Hong Kong travelers look for on airline/travel websites. Int. J. Hospitality Manag. 20(1), 95–100 (2001)
SITA – Airline IT Trends Surveys (2012, 2013, 2014, 2015). https://www.sita.aero/resources/type/surveys-reports
Author information
Authors and Affiliations
Corresponding author
Editor information
Editors and Affiliations
Rights and permissions
Copyright information
© 2016 IFIP International Federation for Information Processing
About this paper
Cite this paper
Nguyen, V., Svee, EO., Zdravkovic, J. (2016). A Semi-automated Method for Capturing Consumer Preferences for System Requirements. In: Horkoff, J., Jeusfeld, M., Persson, A. (eds) The Practice of Enterprise Modeling . PoEM 2016. Lecture Notes in Business Information Processing, vol 267. Springer, Cham. https://doi.org/10.1007/978-3-319-48393-1_9
Download citation
DOI: https://doi.org/10.1007/978-3-319-48393-1_9
Published:
Publisher Name: Springer, Cham
Print ISBN: 978-3-319-48392-4
Online ISBN: 978-3-319-48393-1
eBook Packages: Business and ManagementBusiness and Management (R0)