
Abstract
The fast pace of urbanization has given rise to complex transportation networks, such as subway systems, that deploy smart card readers generating detailed transactions of mobility. Predictions of human movement based on these transaction streams represents tremendous new opportunities from optimizing fleet allocation of on-demand transportation such as UBER and LYFT to dynamic pricing of services. However, transportation research thus far has primarily focused on tackling other challenges from traffic congestion to network capacity. To take on this new opportunity, we propose a real-time framework, called PULSE (Prediction Framework For Usage Load on Subway SystEms), that offers accurate multi-granular arrival crowd flow prediction at subway stations. PULSE extracts and employs two types of features such as streaming features and station profile features. Streaming features are time-variant features including time, weather, and historical traffic at subway stations (as time-series of arrival/departure streams), where station profile features capture the time-invariant unique characteristics of stations, including each station’s peak hour crowd flow, remoteness from the downtown area, and mean flow. Then, given a future prediction interval, we design novel stream feature selection and model selection algorithms to select the most appropriate machine learning models for each target station and tune that model by choosing an optimal subset of stream traffic features from other stations. We evaluate our PULSE framework using real transaction data of 11 million passengers from a subway system in Shenzhen, China. The results demonstrate that PULSE greatly improves the accuracy of predictions at all subway stations by up to \(49\,\%\) over baseline algorithms.
This work is sponsored by the Department of Air Force under Air Force Contract FA 8722-05-C-0002. Opinions, interpretations, conclusions and recommendations are those of the authors and not necessarily endorsed by the United States Government. Yanhua Li is partly supported by a gift funding from Pitney Bowes, Inc. Jun Luo is partly supported by the National Natural Science Foundation of China (Grant No. 11271351). Prof. Rundensteiner also thanks Dept of Education for Phd student support on GAANN grant (P200A150306) for Big Data Computing Research supporting Ermal Toto and other Phd students. Prof. Rundensteiner thanks NSF for grants IIS-1018443 and CRI-1305258.
You have full access to this open access chapter, Download conference paper PDF
Keywords
These keywords were added by machine and not by the authors. This process is experimental and the keywords may be updated as the learning algorithm improves.
1 Introduction
Background. Subway systems provide unobstructed transit throughout an urban area. Starting in the early 90s, in order to streamline fare collection, subway authorities have implemented smart card enabled entry and exit systems [21]. These widely adopted systems generate a large amount of fine-grained data about passengers’ mobility throughout the transportation network. Offering new opportunities in gaining in-depth insights into the performance and effectiveness of the system as well as the passenger mobility patterns.
Motivation. However a recent survey of smart card transaction usage [21] found that current research is limited to simple post-hoc analysis of generalized mobility patterns, thus risks missing potentially valuable opportunities for new mobility-related services. Predictions of crowd flow arriving at subway stations based on fine-grained smart card transaction streams open tremendous new opportunities for novel services, including optimizing fleet allocation and introducing dynamic fares in on-demand systems [20, 22]. In addition, traditional transportation modes such as buses would also benefit from mobility prediction capabilities that would allow them to dynamically adjust stop frequency and routes [10, 12]. These new classes of services increase quality of service and reduce emissions.
Limitations of the State of Art. In the literature, traffic prediction on road networks has been studied extensively, and many prediction models have been applied and developed [8, 13, 15, 25, 26, 28, 31]. However, when applying these methods directly on solving the arrival crowd flow prediction at subway stations, they fail to achieve high prediction accuracy, because these (general) methods do not explicitly take into account the unique features and characteristics of subways systems, such as the pairwise crowd flow between stations, attrition rate of subway stations, etc. Such arrival crowd flow prediction problem is challenging in practice. Figure 1(a) shows that the arrival crowd flows at different stations exhibit completely different time-series patterns, while Fig. 1(b) shows that for the same station, the arrival crowd flow changes its pattern over different days.
Our Proposed Approach. Given these challenges, in this paper, we make the first attempt to study the crowd flow prediction problem at subway stations. We propose a novel real-time framework, called PULSE (Prediction Framework For Usage Load on Subway SystEms), that offers accurate multi-granular arrival crowd flow prediction at subway stations. Below we summarize our main contributions in this paper.

(a) Time series of passenger arrivals at 3 stations during a Monday. (b) System wide traffic during three consecutive days.
-
PULSE extracts two types of features for the arrival crowd flow prediction, i.e., streaming features and station profile features. Streaming features are time-variant features including time, weather, and historical traffic at subway stations (as time-series of arrival/departure streams), where station profile features capture the time-invariant unique characteristics of stations, including each station’s peak hour crowd flow, remoteness from the downtown area, and mean flow. (See Sect. 4)
-
PULSE employs a novel stream feature selection algorithm and a model selection algorithm to select the most appropriate machine learning model for each target station and tune that model by choosing an optimal subset of stream traffic features from other stations. (See Sects. 5 and 6)
-
We evaluate our PULSE framework using real transaction data of 11 million passengers from a subway system in Shenzhen, China. The results demonstrate that PULSE greatly improves the accuracy of predictions at all subway stations by up to 49 % over baseline algorithms. (See Sect. 7)
2 Related Work
In this section, we briefly discuss two research areas that are closely related to this work, namely, urban computing and traffic prediction.
Urban computing studies the impact and application of technology in urban areas, including the collection and usage of smart card transactions. Analyzing smart card records is an effective way of understanding human mobility patterns in urban areas [18, 21]. Various studies [6, 7, 16, 18] show that city wide mobility follows a common pattern that is consistent across cities and modes of transportation. These studies describe mobility patterns, but fall short of developing a framework for fine-grained predictions of human mobility. To our knowledge this study is the first to directly address the prediction of arrival crowd flow in a subway network.
Traffic prediction in road networks has been studied extensively [8, 13, 15, 25, 26, 28, 31]. In this study, we compare and contrast the most commonly used machine learning models as baseline methods. One of these baselines (Multiple Linear Regression–MLR) is described in [26], where it is used to capture short term traffic trends. In another study [8] non-parametric models similar to K-Nearest Neighbours (KNN) are used for road traffic flow predictions. The concept of using ensembles of models is used in [25], where a state machine switches among different Auto-regressive Moving Average Models (ARIMA) [15].
In [13], Random Forest models are used for short term context aware predictions. All these traffic prediction methods are addressing vehicle traffic prediction problem and utilize a fixed (sometimes ensemble) model to conduct the traffic prediction. Thus, when applied to our crowd flow prediction problem at subway stations, these methods would fail to capture unique features and choose appropriate models for a subway system.
In summary, PULSE is the first framework that enables fine-grained arrival crowd flow predictions at subway stations, using smart card transaction data, weather data, and calendar data.
3 Overview
In this section, we define the subway traffic prediction problem and outline the framework of our methodology.
3.1 Preliminary and Problem Definition
We worked on transaction data generated from the subway system in Shenzhen, China. Similar to many other subway systems in different cities, such as Beijing SubwayFootnote 1, and London SubwayFootnote 2, a passenger needs to swipe his smart card at both the entering and leaving stations. Such paired transaction records capture the trip information of passengers. Below, we explicitly highlight the key terms used in the paper, and define the subway station traffic prediction problem.
Definition 1
(Trip). \(tr=(p_{id}, s_d, t_d, s_a, t_a)\) represents a trip made by a passenger with ID \(p_{id}\), who departs from station \(s_d\) at time \(t_d\) and arrives at the station \(s_a\) at time \(t_a\). \(\mathbf TR \) represent the set of all trips, i.e., \(tr\in \mathbf TR \).
Definition 2
(Subway Trajectory). A subway trajectory is a sequence of subway stations that a passenger enters and leaves in the subway system as a function of time. Each record thus consists of a passenger ID \(p_{id}\), subway station ID s, and a time stamp t.
Definition 3
(Subway Network). A subway network consists of a set of subway stations connected by subway lines. We represent a subway network as a undirected graph \(G=(V,E)\), where V represents the subway station set and E contains the edges between neighboring subway stations via subway lines.
Problem Definition. Given a set of historical trips \(\mathbf TR \), the subway network G, and the current time t, we aim to predict the number of passengers arriving at a subway station \(s\in V\) (from other stations) during the consecutive time intervals \([t+T*(k-1), t+T*k]\), with \(1\le k \le K\). T is a time aggregation interval, which is usually 15 min. K denotes the number of future intervals to be predicted, and we use \(K=6\) in this paper.
3.2 The PULSE Framework
To tackle the above subway station traffic prediction problem, we introduce PULSE framework (Prediction Framework For Usage Load on Subway SystEms) as shown in Fig. 2. PULSE takes the historical trip data, calendar information, and weather data as input, to predict future traffic flows at each subway station at fine-grained periodic intervals e.g., every 15 min. This task is achieved in three core steps, namely, feature extraction, traffic prediction, and model update, as outlined next.

The PULSE framework.
Feature extraction module aggregates the time-varying data sources, such as the transaction data, weather data, calendar data, at certain time granularity, e.g., 15 min. Then, we extract and model both streaming and profile features. Streaming features are direct aggregates of the time-varying datasets, including aggregated traffic volumes entering and leaving a subway station and weather statistics. Profile features describe relatively stable characteristics of each station, including remoteness of a station, peak-hour traffic, average inflow at a station. See more details in Sect. 4.2.
Traffic prediction. When predicting the entering and leaving traffic at a subway station \(s_i\), the traffic prediction module employs an automatic feature and model selection algorithm that achieves high prediction accuracy. A prediction model is chosen and a subset of subway stations are selected to include their streaming features as training data. The model and features selected are used to perform predictions on the future entering and leaving traffic at each subway station. Section 5 describes this process in more detail.
Model update module keeps track of the performance of the PULSE system over time. It automatically re-selects features and rebuilds the models.
4 Feature Extraction for PULSE
The feature extraction module explores two sets of key features, namely streaming features and station profile features. The former capture the dynamics of departing/arriving traffic at different stations and the meteorological features over time; while the latter characterizes the time-invariant profiles of different subway stations, including remoteness from the city center, the mean flow, peak-hour traffic, etc.

Temperature and number of arrivals during a Saturday.
4.1 Streaming Features
4.1.1 Time Features \(F^t\)
As discussed earlier, the departing and arriving transaction data are aggregated at a certain time granularity, e.g., \(T=15\) min. We observe that the daily operation time of a subway system, denoted as \(T_0\), is usually less than 24 h. For example, in Shenzhen, the subway system operates between 7 am and 11 pm every day, that is, a total of \(T_0=16\) h of operation time. Hence, given the time aggregation interval T, the daily operation time \(T_0\) is divided into a fixed number of time slots with equal length of T minutes. For example, a total of 64 such intervals are obtained given \(T=15\) min and \(T_0=16\) h. We then use the interval id \(F_{int} \in [1, 64]\) to represent the time of day as a feature. As observed in [6, 16, 18], this feature is significant in urban human mobility predictions. Similarly, we introduce the feature day of the week, that distinguishes between weekdays from Monday to Sunday, which can be represented using the weekday id, namely, \(F_{day}\in [1,7]\). As shown in Fig. 1b, The traffic patterns vary significantly during the different days of the week as it is also observed in [16, 18].
4.1.2 Traffic Stream Features \(F^s\)
Given an aggregation interval T, we can obtain the arrival and departure traffic at each subway station during each time interval T. For one station \(s_i\), we denote the vector \(F^{arr}_i = \left[ a_{1},a_{2},\ldots ,a_{N} \right] \) as the arrival stream feature of a station \(s_i\), where N is the total number of time intervals in the data. Given a starting time \(t_0\), each \(a_\ell \) represents the number of passengers who arrived at the station \(s_i\), during the \(\ell \)-th time interval, namely, \(T_\ell =[t_0+T*(\ell -1),t_0+T*\ell ]\). Hence, each \(a_\ell \) can be obtained from the trip data as follows.
where \(I(\cdot )\) is the indicator function, which is 1 if the condition holds, and 0 otherwise. Similarly, we define the departure stream feature of a station \(s_i\) as a vector \(F^{dep}_i = \left[ d_1,d_2,\ldots ,d_N \right] \). Each \(d_\ell \) can be represented as \(d_{\ell }=\sum _{tr\in \mathbf TR }I(tr.s_d=s_i,tr.t_d\in T_\ell )\). When considering pair-wise flows between station pairs, \(F^{pair}_{i,j} = \left[ p_1,p_2,\ldots ,p_N \right] \) is the pairwise flow feature. \(p_\ell \) representing the number of trips from station \(s_i\) to station \(s_j\) during the time interval \(T_\ell \), namely, \(p_{\ell }=\sum _{tr\in \mathbf TR }I(tr.s_d=s_i,tr.s_a=s_j,tr.t_d\in T_\ell ,tr.t_a\in T_\ell )\). We also take into account \(F^{dur}_{i,j} = \left[ \pi _1,\pi _2,\ldots ,\pi _N \right] \) as the vector average trip duration feature from station \(s_i\) to \(s_j\) during the time interval \(T_\ell \). Each \(\pi _{\ell }=\frac{1}{p_\ell }\sum _{tr\in \mathbf TR }(tr.s_a-tr.s_d)I(tr.s_d=s_i,tr.s_a=s_j,tr.t_d\in T_\ell ,tr.t_a\in T_\ell )\).
4.1.3 Weather Features \(F^w\)
The traffic at subway stations is affected by meteorology. Hence, we identify two features that are correlated with the subway stations traffic, namely temperature and humidity. Figure 3 shows the correlation between the subway station traffic and the temperature feature, using the data we collected during 03/20/2014–03/31/2014 in Shenzhen. We can see that the temperature is positively correlated with subway station traffic, similarly our data indicates that humidity is correlated negatively with station traffic.

Equivalent traffic volumes, but different peak patterns for stations with (green) and without (orange) an Evening Departure Peak (EDP). (Color figure online)
4.2 Station Profile Features
In this section, we present the time-invariant profile features extracted from each subway station. These features capture the unique profile of each subway station from different aspects, such as peak-hour traffic, mean flow, and remoteness from the city center.

Arrival streams with different morning peaks
4.2.1 Peak Traffic \(F^P\)
Crowd movement during commute hours shows unique and characteristic peak patterns that vary between stations, but are relatively stable over time. In our study, we choose the peak hours as 7–11 am and 5–11 pm. A naive way of characterizing the peak-hour behavior is to use total traffic volume. This approach may miss important information of the underlying traffic dynamics. For example, as shown in Fig. 4, two stations have the same peak-hour traffic volume, namely, the total area between the traffic curve and the x-axis. However, we observe that station 1 shows a flat traffic pattern during the peak-hour, while station 2 has one significant spike. To capture such spike, we employ the Tukey [27] outlier detection method to identify the outliers in the peak-hour, and count the number of outliers as the peak-hour traffic feature. In Fig. 5, we use the morning arrival peak-hour traffic as an example. Similarly, we can obtain the peak-hour traffic for evening arrival, evening departure, and morning departure, respectively.
4.2.2 Flow Related Features \(F^F\)
We introduce two types of flow related features, including attrition rate and mean flow of a station.
Attrition Rate. For a station \(s_i\), we define the attrition rate \(Att_i\) as the relative difference between departures and arrivals at \(s_i\). As is observed in [18], most departure trips from a station \(s_i\) have a matching arrival trip. However, attrition rates in Shenzhen subway data vary considerably as illustrated in Fig. 6. \(Att_i = {(|F^{dep}_{i}|-|F^{arr}_{i}|)}/{|F^{arr}_{i}|}\).

Distribution of attrition rate.
Mean Flow of a station \(s_i\) (denoted by \(F^{flow}_i\)) is the average number of arrivals per interval, which can be calculated as \(F^{flow}_i={\left| {F^{arr}_{i}}\right| }/{N}\). Figure 7b illustrates the flow at each subway station. As expected, downtown areas and commercial centers show high concentrations of passenger arrivals.
4.2.3 Remoteness \(F^R\)
From the subway transaction data, we observe that in general stations located farther away from the downtown area tend to have similar traffic patterns and overall fewer traffic. This motivates us to extract the remoteness of station \(s_i\) as a feature, i.e., \(F^{R}_i\). \(F^{R}_i\) is the average duration of the historical trips arriving at \(s_i\), namely, \(F^{R}_i={\sum _{tr \in \mathbf TR }}(tr.t_a-tr.t_d).I(tr.s_a=s_i)\). Figure 7a illustrates the geographic distribution of remoteness.

Geographic distribution of (a) remoteness and (b) mean station flow.
5 Station Stream Selection
Our focus in this work is arrival traffic prediction at subway stations. Given a target station \(s_i\), its historical traffic data as a time-series can be used to predict its future arrival traffic, e.g., [15]. In general, subway stations are inter-connected, and the arrival traffic at one particular subway station \(s_i\) is affected and generated by the traffic from all other stations (in \(V/s_i\)). However, given \(s_i\), it is computationally efficient in practice to include a subset of stations (instead of all stations), which contribute significantly to the arrival traffic at \(s_i\), i.e., they are geographically close by, or they originate a significant amount of traffic flow to the target station. In this section, we present our stream selection algorithm, that can identify the subset of stations, whose departure traffic (as a key feature) contributes the most to the traffic at the target station. Our selection algorithm combines three criteria, including Time Based Stream Selection (TBSS), Flow Based Stream Selection (FBSS), and Profile Based Stream Selection (PBSS). Below, we elaborate on each selection criterion and the overall stream selection algorithm.

Selecting streams based on (a) pairwise flow and (b) temporal distance.
Time Based Stream Selection (TBSS). Given the current time t, a time interval \(T=15\) min, and a target station \(s_i\), we aim to predict the arrival traffic at \(s_i\) during the future time interval \(\phi =[t+T*(k-1), t+T*k]\) with a positive integer \(k>0\). For example, when \(k=1\), the prediction yields the arrival traffic for the immediate time interval T from the current time t. Hence, we choose those stations that have average arrival time during the prediction interval \(\phi \). We use the following criterion (in Eq. 2) to select \(\theta _L\) such stations. Recall that the average trip time feature \(F^{dur}_{j,i}=[\pi _1,\cdots ,\pi _N]\) includes the pairwise trip time from a station \(s_i\) to \(s_j\) over time.
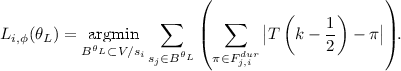
\(L_{i,\phi }(\theta _L)\) is the set of \(\theta _L\) selected stations. The value of \(\theta _L\) is selected by the model selection module (See Sect. 6) to achieve high prediction accuracy.
Figure 8b illustrates the set of stations selected by TBSS for with \(\theta _L = 20\), \(T=15\) min, and two values of k (orange, \(k=1\) and green, \(k=4\)).
Flow Based Stream Selection (FBSS). FBSS is based on the intuition that future traffic at station \(s_{i}\) will come from (departures of) stations with most historical trips to \(s_i\). Recall that the pairwise flow feature \(F^{pair}_{j,i}=[p_1,\cdots ,p_N]\) includes the numbers of pairwise trips from a station \(s_i\) to \(s_j\) over time. \(M_{i,\phi }(\theta _M)\) is the set containing \(\theta _M\) stations with the highest number of trips to \(s_i\), as illustrated in Eq. 3 where \(|F_{j,i}^{pair}|\) indicates the total number of trips from station \(s_j\) to \(s_i\) and \(\theta _M\) is again chosen by the model selection module. An example of stations selected by FBSS is given in Fig. 8a.

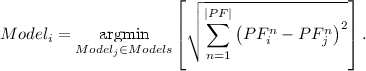
Profile Based Stream Selection (PBSS). Profile features characterize the overall traffic patterns of subway stations. Stations with similar profile features tend to have similar traffic patterns over time. Given a target station \(s_i\), its profile feature vector is \(PF_i = [F^P_i, F^F_i, F^R_i]\), where \(F^P\), \(F^F\) and \(F^R\) represent the peak traffic features, flow related features, and remoteness features, respectively. \(PF_i\) is compared to \(PF_j\) for each \(s_j \in V\) and a set \(K_{i,\phi }({\theta _K})\) of the \(\theta _K\) nearest (in terms of profile features) stations is selected as illustrated in Eq. 4. The optimal value for \(\theta _K\) is determined during model selection.

Stream selection. The final set of stations is simply the union set of the results from three criteria, i.e., \(L_{i,\phi }(\theta _L) \cup M_{i,\phi }(\theta _M) \cup K_{i,\phi }(\theta _K)\).
The pseudocode for the stream selection is given in Algorithm 1. In Lines 2–6, the procedure iterates through all stations \(s_j \in V/s_i\) and calculates the time distances, pairwise flows, and profile feature Euclidean distances between stations \(s_i\) and \(s_j\). In lines 7–12, these distances are sorted, and the first \(\theta _L\),\(\theta _M\), and \(\theta _K\), streams are selected. Line 13 returns the union of the three stream sets.

6 Model Selection
To accurately predict the arrival traffic for a prediction interval \(\phi \) at a target station \(s_i\), we need to choose the right prediction model and the right set of stream features from other stations, namely, \(\theta _L\), \(\theta _M\), \(\theta _K\). We consider five candidate prediction models used in the literature for time-series data prediction, including Autoregressive integrated moving average (ARIMA) [15, 25], Artificial Neural Networks (ANN) [19, 28, 30, 31], K-Nearest Neighbours (KNN) [8, 9, 11], Random Forest (RF) [13, 14, 17], and Multiple Linear Regression (MLR) [26]. The system also needs to choose the optimal number of streams to be included using the methods described in Sect. 5. In our study, the Shenzhen subway system has five subway lines with 118 subway stations. Thus each parameter \(\theta _L\), \(\theta _M\), and \(\theta _K\) can vary from 1 to 118, leading to a search space of \(118^3\). Each model configuration setup requires training and testing using historical data.
To find the optimal configuration of model and stream set for a station \(s_i\) and prediction interval \(\phi \) requires examining all configurations with different model and stream combinations. A naive method is to brute force all such configurations, and choose the one with the highest prediction accuracy. However, this is too costly to be implemented in practice. To be precise, we have five prediction models and \(118^3\) possibilities of stream set sizes. Let’s consider 6 future prediction intervals and different temporal partitions, which in this set of experiments is two (weekdays and weekends). In total, there are about 79 million different models. We ran our experiments in a server with 30 Intel(R) Xeon(R) CPU E5-4627 v2 @ 3.30 GHz Cores. Each model training and testing would take about 1 to 15 s, which leads to a total of 14 years to compare all configurations using our 30 core system. Thus, we are motivated to employ the profile features to conduct Gradient-based optimization of hyper-parameters [4, 5] to optimize this process. Initially this method uses a pure gradient search approach to discover parameters. As more station profiles are matched to models, PULSE can initiate subsequent searches with model parameters from stations with similar profiles as described by Eq. 5. Henceforth, we refer to this method as Model Select (MSELECT). After a large number of stations have been assigned with prediction models, the process only takes a few seconds. Therefore this method is suitable as an online process for model updates based on changes in the profile features. Our gradient based model search takes approximately 2 h to find the optimal prediction configuration for all 118 stations in this study.
Model update. PULSE monitors the prediction performance over time. It automatically re-selects features and rebuilds the models when the average prediction accuracy goes below a certain threshold value.
7 Evaluation of PULSE Model
To evaluate the performance of our PULSE framework on arrival traffic prediction, we conducted comprehensive experiments using a real subway transaction dataset collected from Shenzhen subway system for 21 days in March 2014. By comparing with baseline algorithms, the experimental results demonstrate that PULSE can achieve a 26 %–94 % relative prediction accuracy, which is on average 20 % higher than baseline algorithms. Below, we present the datasets, baseline algorithms, experiment settings and results.

Distribution of the best performing models over the prediction horizon.
7.1 Dataset Description
For this work, we used 60 million smart card transactions from the subway system in the city of Shenzhen, China between March \(10^{th}\) and March \(31^{st}\), 2014. The dataset contains 11 million unique passengers (identified by their smart card ids). Each transaction contains a timestamp, location coordinates, and whether the transaction is a departure from or an arrival at a station. During data pre-processing we matched entry and exit transactions for each passenger in order to generate a trip record \(tr=(p_{id}, s_d, t_d, s_a, t_a)\) containing a passenger identifier \(p_{id}\), a starting station \(s_d\), a destination \(s_a\) and respective departure and arrival times \(t_d\) and \(t_a\).
7.2 Evaluation Settings
PULSE predicts the number of arrivals at a station \(s_i\) at future time intervals in \([t+T*(k-1), t+T*k]\) with \(1\le k\le K\). In our evaluation of PULSE, we used a variable \(k \in [1, \cdots ,6]\).
Prediction models for both PULSE and the baseline methods are trained using a sliding window containing a week of historical data to predict the arrival traffic of a future interval specified by k. The accuracy of the predictions is defined as \(accuracy = 1-\frac{\sum {\vert \hat{y_i}-y_i \vert }}{\sum {y_i}}\). Again, we consider five prediction models used in the literature for time-series data prediction, including Autoregressive integrated moving average (ARIMA) [15, 25], Artificial Neural Networks (ANN) [19, 28, 30, 31], K-Nearest Neighbours (KNN) [8, 9, 11], Random Forest (RF) [13, 14, 17], and Multiple Linear Regression (MLR) [26]. All these methods can be setup as both single stream (only using the features of the target station) or multi-stream models (using features from both the target station and other selected stations)Footnote 3. In our experiments, we evaluate the PULSE framework in two stages.
In the first stage, we run all prediction models in a single-stream fashion using the arrival stream feature \(F^{arr}_i\) of the target station \(s_i\), with vs without other streaming features, such as time feature \(F^T\) and weather features \(F^W\).
In the second stage, we evaluate the stream feature selection and model selection algorithms introduced in Sects. 5 and 6 in a multi-stream scenario. We compare our PULSE framework with each individual model under the single-stream mode. The evaluation results are summarized in the next subsection.
7.3 Evaluation Results
Stage 1: Single-stream models. In Table 1, the column BaseL No SF lists the baseline results of single stream models, that only use the arrival stream feature of the target station. The column BaseL SF lists the results of single stream models, that include both the arrival stream feature of the target station, and also other streaming features introduced in Sect. 4.1, such as the weather and time features. The results show that by introducing time and weather features, the prediction accuracy for the single-stream models is improved on average \(13.4\,\%\) and up to \(21.7\,\%\), namely, from \(60\,\%\)–\(75.8\,\%\) to \(76.9\,\%\)–\(81.7\,\%\), respectively.
When we look at the different prediction horizons from 15 min to 60 min ahead of time, the accuracy of all models (except ARIMA) decreases as the prediction horizon increases. This is reasonable since it is in general harder to predict the arrival traffic in a long term future interval than an immediate future interval.
Stage 2: Multi-stream models. In Table 1, the last column MSEL lists the results of multi-stream models, when stream feature selection and model selection algorithms are applied to include departure stream features from other stations than the target station. We observed that the average prediction accuracy is further improved to \(85.6\,\%\) over single-stream models, with an average of \(7.6\,\%\) improvement over BaseL SF and \(21\,\%\) improvement over BaseL No SF.
Table 2 lists the evaluation results of the stations with the top five improvement on the prediction accuracy for weekdays and weekends, respectively. During weekends, the first ranked station (in terms of model improvement) has a prediction accuracy as low as 26.4 % at 45 min prediction horizon when using KNN (the best performing single-stream baseline) with all streaming features. By applying stream feature selection and model selection algorithms, PULSE increases the prediction accuracy of this model to \(75.5\,\%\) with a total of \(49.1\,\%\) improvement. This was achieved by using a Random Forest model with 10 streams that were selected using profile based stream selection (PBSS). Overall, the stream feature selection and model selection algorithms improve the prediction accuracy more during the weekends (up to \(49.1\,\%\) improvement) than the weekdays (up to \(6\,\%\)). This happens primarily because the arrival traffic in weekends is less stable than during weekdays, and single-stream models have low prediction accuracy, providing more room to improve the performance when stream feature selection and model selection algorithm are used.

(a) KNN vs (b) MSELECT weekend prediction accuracy at 60 min horizon, for stations with different mean passenger flow.
Summary and Observations. The above results with single-stream models demonstrate that by introducing time and weather features, the prediction accuracy is improved on average \(13.4\,\%\). For multi-stream models, our PULSE framework further improves the prediction accuracy by an average of \(7.6\,\%\). To better understand the evaluation results, Fig. 10(a, b) presents the prediction accuracy distribution at all stations as a function of their mean arrival flow for single stream model (KNN) in Fig. 10(a) vs multi-stream models in Fig. 10(b). We observed that stations with lower mean arrival traffic had the most improvement. When we looked at the best models being selected by our model selection algorithm over different prediction horizons, we noticed that there is a clear shift in the machine learning models with increasing prediction horizons (Fig. 9). For example, linear model (LM) and Random forest (RF) are used more for smaller prediction horizons (i.e., predicting the near future), while k-nearest neighbors (KNN) in general performs better for larger prediction horizons (i.e., predicting the long term future intervals). These observations shed light on the performances of different models in subway station traffic predictions.
8 Conclusion
In this study we present PULSE, a real-time system to predict arrival crowd flow at metropolitan subway stations. The system extracts streaming features and station profile features from heterogeneous urban data, including subway transaction data, weather data, and calendar data. PULSE employs novel stream feature selection and model selection algorithms to improve the prediction accuracy and running time. Experimental results on real subway transaction data from 11 million passengers in Shenzhen, China demonstrated that PULSE can increase the prediction accuracy by up to 49 % over baseline algorithms.
Notes
- 1.
- 2.
- 3.
Note that ARIMA can only be setup as a single stream model by its design in nature.
References
Statistic Brief: World Metro Figures, 1st ed. UITP, Brussels (2014)
United Nations: World Urbanization Prospects 2014: Highlights. United Nations Publications (2014)
Annez, P.C., Buckley, R.M.: Urbanization and growth: setting the context. Urbanization Growth 1, 1–45 (2009)
Bengio, Y.: Gradient-based optimization of hyperparameters. Neural Comput. 12(8), 1889–1900 (2000)
Bergstra, J.S., Bardenet, R., Bengio, Y., Kégl, B.: Algorithms for hyper-parameter optimization. In: Advances in Neural Information Processing Systems, pp. 2546–2554 (2011)
Chakirov, A., Erath, A.: Use of public transport smart card fare payment data for travel behaviour analysis in Singapore. Eidgenössische Technische Hochschule Zürich, IVT - Institut für Verkehrsplanung und Transportsysteme (2011)
Cheng, Y.Y., Lee, R.K.W., Lim, E.P., Zhu, F.: Measuring centralities for transportation networks beyond structures. In: Kazienko, P., Chawla, N. (eds.) Applications of Social Media and Social Network Analysis, pp. 23–39. Springer, Switzerland (2015)
Clark, S.: Traffic prediction using multivariate nonparametric regression. J. Transp. Eng. 129(2), 161–168 (2003)
Cover, T., Hart, P.: Nearest neighbor pattern classification. IEEE Trans. Inf. Theory 13(1), 21–27 (1967)
Fu, L., Liu, Q., Calamai, P.: Real-time optimization model for dynamic scheduling of transit operations. J. Transp. Res. Board 1857, 48–55 (2003)
Fukunaga, K., Narendra, P.M.: A branch and bound algorithm for computing k-nearest neighbors. IEEE Trans. Comput. 100(7), 750–753 (1975)
Furth, P., Rahbee, A.: Optimal bus stop spacing through dynamic programming and geographic modeling. J. Transp. Res. Board 1731, 15–22 (2000)
Hamner, B.: Predicting travel times with context-dependent random forests by modeling local and aggregate traffic flow. In: 2010 IEEE International Conference on Data Mining Workshops, pp. 1357–1359. IEEE (2010)
Ho, T.K.: Random decision forests. In Proceedings of the Third International Conference on Document Analysis and Recognition, vol. 1, pp. 278–282. IEEE (1995)
Jenkins, G.M., Reinsel, G.C.: Time Series Analysis: Forecasting and Control. Wiley, Hoboken (1976)
Li, Y., Zheng, Y., Zhang, H., Chen, L.: Traffic prediction in a bike-sharing system. In: Proceedings of the 23rd SIGSPATIAL International Conference on Advances in Geographic Information Systems, p. 33. ACM (2015)
Liaw, A., Wiener, M.: Classification and regression by randomforest. R News 2(3), 18–22 (2002)
Liu, L., Hou, A., Biderman, A., Ratti, C., Chen, J.: Understanding individual and collective mobility patterns from smart card records: a case study in Shenzhen. In: 12th International IEEE Conference on Intelligent Transportation Systems, ITSC 2009, pp. 1–6. IEEE (2009)
McCulloch, W.S., Pitts, W.: A logical calculus of the ideas immanent in nervous activity. Bull. Math. Biophys. 5(4), 115–133 (1943)
Moreira-Matias, L., Gama, J., Ferreira, M., Mendes-Moreira, J., Damas, L.: Predicting taxi-passenger demand using streaming data. IEEE Trans. Intell. Transp. Syst. 14(3), 1393–1402 (2013)
Pelletier, M.P., Trépanier, M., Morency, C.: Smart card data use in public transit: a literature review. Transp. Res. Part C: Emerg. Technol. 19(4), 557–568 (2011)
Qian, S., Cao, J., Mouël, F.L., Sahel, I., Li, M.: SCRAM: a sharing considered route assignment mechanism for fair taxi route recommendations. In: Proceedings of the 21th ACM SIGKDD International Conference on Knowledge Discovery and Data Mining, pp. 955–964. ACM (2015)
Rabiner, L.R., Gold, B.: Theory and Application of Digital Signal Processing, 777 p., 1. Prentice-Hall Inc., Englewood Cliffs (1975)
Salnikov, V., Lambiotte, R., Noulas, A., Mascolo, C.: Openstreetcab: exploiting taxi mobility patterns in new york city to reduce commuter costs. arXiv preprint arXiv:1503.03021 (2015)
Stathopoulos, A., Karlaftis, M.G.: A multivariate state space approach for urban traffic flow modeling and prediction. Transp. Res. Part C: Emerg. Technol. 11(2), 121–135 (2003)
Sun, H., Liu, H.X., Xiao, H., He, R.R., Ran, B.: Short term traffic forecasting using the local linear regression model. In: 82nd Annual Meeting of the Transportation Research Board, Washington, DC (2003)
Tukey, J.W.: Exploratory Data Analysis, 1st edn. Addison-Wesley, Reading (1977)
Vlahogianni, E.I., Karlaftis, M.G., Golias, J.C.: Optimized and meta-optimized neural networks for short-term traffic flow prediction: a genetic approach. Transp. Res. Part C: Emerg. Technol. 13(3), 211–234 (2005)
Weisstein, E.W.: Fast fourier transform. From MathWorld-A Wolfram Web Resource (2015). http://mathworld.wolfram.com/FastFourierTransform.html
Yegnanarayana, B.: Artificial Neural Networks. PHI Learning Pvt. Ltd., New Delhi (2009)
Zheng, W., Lee, D.H., Shi, Q.: Short-term freeway traffic flow prediction: Bayesian combined neural network approach. J. Transp. Eng. 132(2), 114–121 (2006)
Author information
Authors and Affiliations
Corresponding author
Editor information
Editors and Affiliations
Rights and permissions
Copyright information
© 2016 Springer International Publishing AG
About this paper
Cite this paper
Toto, E. et al. (2016). PULSE: A Real Time System for Crowd Flow Prediction at Metropolitan Subway Stations. In: Berendt, B., et al. Machine Learning and Knowledge Discovery in Databases. ECML PKDD 2016. Lecture Notes in Computer Science(), vol 9853. Springer, Cham. https://doi.org/10.1007/978-3-319-46131-1_19
Download citation
DOI: https://doi.org/10.1007/978-3-319-46131-1_19
Published:
Publisher Name: Springer, Cham
Print ISBN: 978-3-319-46130-4
Online ISBN: 978-3-319-46131-1
eBook Packages: Computer ScienceComputer Science (R0)