
Abstract
Membrane bioreactors were developed as a hybrid treatment technology combining a membrane filtration unit with an activated sludge bioreactor. The membrane unit serves to separate and retain biomass in the activated sludge process instead of a secondary clarifier and also achieves solids separation through micro- and ultrafiltration processes. Membrane bioreactors are capable of producing tertiary quality effluents with disinfection to enable surface discharge and water reuse applications. This chapter describes the principles and processes that are involved in membrane filtration processes and the design and implementation of membrane bioreactors.
Access this chapter
Tax calculation will be finalised at checkout
Purchases are for personal use only
References
References cited in Chap. 9 are listed along with other references that have content relevant to the topics covered in Chap. 9.
Atasoy E, Murat S, Baban A, Tiris M (2007) Membrane bioreactor (MBR) treatment of segregated household wastewater for reuse. Clean 35(5):465–472
Boehler M, Joss A, Buetzer S, Holsapfel M, Mooser H, Siegrist H (2007) Treatment of toilet wastewater for reuse in a membrane bioreactor. Water Sci Technol 56(5):63–70
Judd S (2008) The status of membrane bioreactor technology. Trends Biotechnol 26(2):109–116
Judd S (2011) The MBR Book: Principles and Applications of Membrane Bioreactors for Water and Wastewater Treatment, 2nd edn. Butterworth-Heinemann, Oxford, 536 pp
Laera G, Pollice A, Saturno D, Giordano C, Lopez A (2005) Zero net growth in a membrane bioreactor with complete sludge retention. Water Res 39:5241–5249
Larsson E, Persson J (2004) Viability of membrane bioreactor technology as an advanced pre-treatment for onsite wastewater treatment. M.S. Thesis, Luleå University of Technology. 147 pp
Lowe KS, VanCuyk SM, Siegrist RL, Drewes JE (2008) Field evaluation of the performance of engineered onsite wastewater treatment units. ASCE J Hydrologic Eng 13(8):735–743
Melin T, Jefferson B, Bixio D, Thoeye C, DeWilde W, DeKoning J, van der Graaf J, Wintgens T (2006) Membrane bioreactor technology for wastewater treatment and reuse. Desalination 187:271–282
Pollice A, Laera G, Blonda M (2004) Biomass growth and activity in a membrane bioreactor with complete sludge retention. Water Res 38(2004):1799–1808
Santos A, Ma W, Judd SJ (2011) Membrane bioreactors: two decades of research and implementation. Desalination 273:148–154
Stephenson T, Judd S, Jeferson B, Brindle K (2000) Membrane bioreactors for wastewater treatment, 1st edn. IWA Publishing, London. ISBN 1 900222 07 8
Tchobanoglous GT, Stensel HD, Burton FL, Tsuchihashi R (2014) Wastewater engineering: treatment and resource recovery, 5th edn. McGraw-Hill Education, Columbus, OH, 2048 pp
Trussell RS, Merlo RP, Hermanowicz SW, Jenkins D (2006) Effect of organic loading on process performance and membrane fouling in a submerged membrane bioreactor treating municipal wastewater. Water Res 40:2675–2683
USEPA (2008) Wastewater management fact sheet: membrane bioreactors. U.S. Environmental Protection Agency, Washington, DC, 9 pp
USEPA (2012) 2012 Guidelines for water reuse. United States Environmental Protection Agency, National Risk Management Research Laboratory, Office of Research and Development, Cincinnati, OH. EPA/600/R-12/618. 643 pp
Verrecht B, James C, Germain E, Birks R, Barugh A, Pearce P, Judd S (2012) Economical evaluation and operating experiences of a small-scale MBR for nonpotable reuse. J Environ Eng 138(5):594–600
Vuono D, Henkel J, Benecke J, Cathy TY, Reid T, Johnson L, Drewes JE (2013) Flexible hybrid membrane treatment systems for tailored nutrient management: a new paradigm in urban wastewater treatment. J Memb Sci 446:34–41
Water Environment Federation (2011) Membrane bioreactors, WEF Manual of Practice No. 36. McGraw-Hill Professional, New York, 262 pp
Yoon SH, Kim HS, Yeom I (2004) The optimum operational condition of membrane bioreactor (MBR): cost estimation of aeration and sludge treatment. Water Res 38:37–46
Author information
Authors and Affiliations
Slides of Chapter 9 Decentralized Water Reclamation
Slides of Chapter 9 Decentralized Water Reclamation
9.1.1 Chapter 9: Treatment Using Membrane Bioreactors
Contents
-
9-1.
Introduction
-
9-2.
Treatment performance
-
9-3.
Principles and processes
-
9-4.
Design and implementation
-
9-5.
Summary
-
9-6.
Example problems
9.1.1.1 9-1. Introduction
-
■ Membrane processes
-
• Membrane filtration processes can be used in unit operations for advanced treatment of wastewaters and other impaired waters
-
• The types of processes and relevant size ranges include the following:
-
○ Particle filtration: >1 μm
-
○ Microfiltration: 0.05–2.0 μm
-
○ Ultrafiltration: 0.003–0.1 μm
-
○ Nanofiltration: 0.0008–0.006 μm
-
○ Reverse Osmosis: 0.0001–0.001 μm
-
-
• Table 9.1 summarizes the size ranges and gives examples of materials in each range
Table 9.1 Particles, molecules and ions can be removed by different filtration processes
-
-
■ Membrane bioreactors
-
• A membrane bioreactor (MBR) is a bioreactor which has an integral membrane filtration unit
-
• A common MBR technology is essentially a suspended growth activated sludge process in which the secondary clarification process is replaced by a membrane filtration process
-
• By inclusion of micro- to ultrafiltration membranes with pore sizes as small as about 40 nm, MBRs can also achieve advanced separation of pollutants and pathogens
-
• MBRs can treat raw wastewaters (after screening) or primary effluents
-
• MBRs can achieve tertiary treatment with disinfection and produce a very consistent, high quality effluent
-
-
■ Basic features of a MBR
-
• A simplified schematic of a typical aerobic MBR with basic components is shown in Fig. 9.1
Fig. 9.1 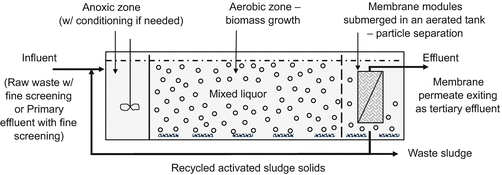
Cross-section view of a representative aerobic membrane bioreactor
-
○ Aerobic MBRs can have different configurations than the one illustrated in Fig. 9.1 and anaerobic MBRs are also being developed
-
-
• Figure 9.2 shows an example of a non-MBR equivalent
Fig. 9.2 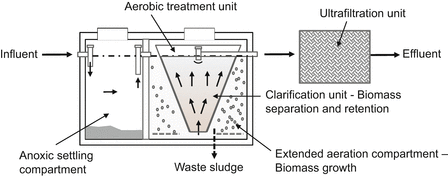
Cross section of an aerobic treatment unit combined with an ultrafiltration unit to yield process function and performance similar to a MBR such as shown in Fig. 9.1
-
○ Note: this illustration includes an aerobic treatment unit with clarification combined with an ultrafiltration unit
-
-
-
■ MBRs for smaller decentralized applications can be “packaged” just like aerobic treatment units
-
• Examples of small-scale MBRs appear in Figs. 9.3 and 9.4
Fig. 9.3 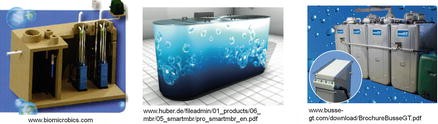
Examples of three commercially packaged small-scale MBRs . Source: www.biomicrobics.com, www.huber.de/fileadmin/01_products/06_mbr/05_smartmbr/pro_smartmbr_en.pdf, www.busse-gt.com/download/BrochureBusseGT.pdf
Fig. 9.4 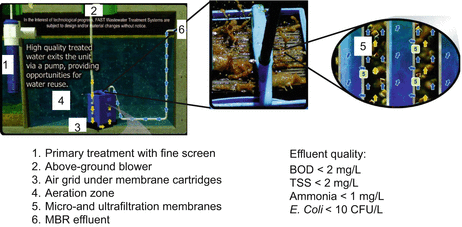
Design features of the Bio-Microbics, Inc. Biobarrier® MBR (www.biomicrobics.com)
-
○ Bio-Microbics BioBarrier MBR—500–9000 gal/day
-
○ Huber smartMBR—2600–19,800 gal/day
-
○ Busse-GT MBR—250–2000 gal/day
-
-
-
■ Where are MBRs used?
-
• For use in decentralized infrastructure where one or more of the following apply:
-
○ Very high quality effluent is required for discharge
-
○ High strength wastewaters require advanced treatment to enable discharge options
-
○ Footprint area limitations exist
-
* Area is very limited and not sufficient for other unit operations and systems
-
* Land area is very expensive
-
-
○ The goal is to reclaim effluent water for toilet flushing, turf irrigation, cooling, or ornamental fountains
-
○ Operation and maintenance requirements can be reliably accomplished
-
-


9.1.1.2 9-2. Treatment Performance
-
■ A membrane bioreactor can be designed to achieve tertiary treatment with disinfection
-
• A MBR can consistently yield a very high quality effluent
-
○ Benefits from flexibility in biological treatment operations
-
○ Particle separation in micro- or ultrafiltration processes
-
-
• Compared to a conventional activated sludge aerobic treatment unit, a MBR improves the removal efficiency for solids, organics, and nutrients
-
• A MBR can also achieve high removals of pathogenic microorganisms (protozoa, bacteria, virus) and some trace organic chemicals depending on membrane pore size and material properties
-
-
■ Treatment efficiency
-
• Treatment efficiency is illustrated in Fig. 9.5 and can be calculated using Eq. 9.1
$$ {\mathrm{R}}_{\mathrm{E}}=\left(\frac{{\mathrm{C}}_{\mathrm{I}}-{\mathrm{C}}_{\mathrm{E}}}{{\mathrm{C}}_{\mathrm{I}}}\right)\times 100\% $$(9.1)Fig. 9.5 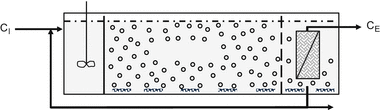
Illustration of treatment efficiency achieved within a membrane bioreactor
Where:
RE = removal efficiency (%)
CI = influent concentration (mg/L)
CE = effluent concentration (mg/L)
-
• Membrane bioreactor treatment efficiencies for constituents of potential concern are presented in Table 9.2.
Table 9.2 Representative treatment efficiency achieved within a well designed and operated MBR
-
-
■ MBR effluent composition
-
• Factors affecting treatment efficiency and effluent composition
-
○ Sizing of the bioreactor component appropriate for the influent quality (CI), design flow rate, and temperature conditions
-
○ Maintaining conditions in the bioreactor that are conducive to biological treatment
-
* Adequate aeration to maintain dissolved oxygen (DO) and achieve mixing
-
* Adequate pH for nitrification
-
* Absence of toxic conditions (e.g., quaternary ammonium salts, dewaxer chemicals)
-
-
○ Provision of adequate membrane area to handle the design flow at a design flux rate the membrane can handle
-
○ Avoidance of excessive membrane fouling and rupturing
-
* Sufficient SRT for nitrification that also limits biofouling
-
* Provision of routine cleaning and replacement as needed
-
-
-

9.1.1.3 9-3. Principles and Processes
-
■ Aerobic MBRs can be implemented in different configurations but the following elements are common
-
• Influent wastewater to the MBR
-
○ Raw wastewater after fine screening (e.g., 1–2 mm typ.)
-
○ Primary treated wastewater (e.g., septic tank effluent)
-
-
• Initial mixed zone
-
○ There can be an initial mixed anoxic zone that also provides some flow equalization
-
○ A chemical conditioning step can be used if needed (e.g., pH or alkalinity adjustment)
-
-
• Bioreactor zone
-
○ Wastewater is then treated in an activated sludge process
-
-
• Activated sludge treatment occurs in an aerobic zone
-
○ The membrane enables 100 % retention of biomass solids and there are no issues with solids settleability in a clarifier
-
○ Thus the design and operating parameters for the bioreactor in the MBR can be targeted at values outside the range of conventional activated sludge
-
○ Example MBR operating parameters appear in Table 9.3
Table 9.3 Example operating parameters for a MBR
-
-
• Membrane separation and biomass retention
-
○ The mixed liquor in the aerobic zone is processed by a membrane filtration unit
-
○ Membranes in MBRs typically operate in the microfiltration and ultrafiltration range (Table 9.4)
Table 9.4 Membrane filtration processes typically employed in MBRs
-
-
-
■ Membrane features
-
• Materials from which membranes are made are important to satisfying criteria including:
-
○ Separation efficiency, inertness, resistance to fouling, and amenability to cleaning
-
-
• Membranes are manufactured from various materials
-
○ Organic membranes
-
* Polyethylene, polyethersulfone, polysulfone, polyolefin, cellulose acetate, polyamides, etc.
-
-
○ Inorganic membranes
-
* Metallic
-
* Ceramic
-
-
-
• For MBR applications, membranes can be manufactured as hollow fibers grouped in bundles or as membrane sheets assembled in spiral wound or flat plates (Fig. 9.6)
Fig. 9.6 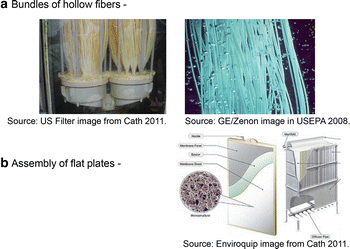
Membranes as (a) fibers grouped in bundles or (b) sheets in flat plates
-
• Flow paths through the membranes in a MBR
-
○ Early membranes used pressurized filtration with permeate produced by a flow path of inside-to-outside
-
* These membranes had high energy use and required frequent backwashing and chemical cleaning
-
-
○ Modern membranes use a low vacuum with permeate produced by a flow path of outside-to-inside (Fig. 9.7)
Fig. 9.7 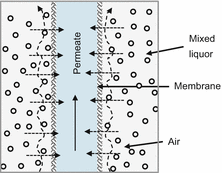
Membrane fiber showing the permeate flow path from outside-to-inside that is typical for a modern membrane
-
* These membranes have more membrane surface area, lower energy use, and are more easily cleaned
-
-
-
-
■ Solids production and need for wasting
-
• Net solids production (YN) depends on wastewater characteristics, solids retention time (SRT), and temperature
-
• In general, net solids production is higher in a MBR receiving a lower quality influent and operated with a shorter SRT under lower temperature conditions, e.g.:
-
○ Lower quality influent (e.g., without primary treatment compared to an influent after primary treatment)
-
* YN ≈ 1.4× to 1.8× higher
-
-
○ Shorter solids retention time (e.g., 5 days vs. 30 days)
-
* YN ≈ 1.4× to 1.6× higher
-
-
○ Lower temperatures (e.g. 10 °C vs. 30 °C)
-
* YN ≈ 1.2× to 1.4× higher
-
-
-
-
■ MBR effluent
-
• The effluent from the MBR is the water that passes through the membrane, which is known as permeate
-
• MBR effluent quality should be very consistent over time unless there is an operational problem or maintenance need
-
○ For example, effluent quality could deteriorate if there was a cross-connection or a ruptured membrane unit
-
-
• Further treatment (if any) of the MBR effluent may be needed
-
○ Discharge or reuse plan requirements , e.g.:
-
* MBR effluent has been treated by reverse osmosis to produce water for potable reuse or industrial purposes
-
-
○ Regulatory requirements , e.g.:
-
* Regulatory requirements could dictate that the MBR effluent had to be treated with a disinfection agent technology before discharge or reuse
-
-
-


9.1.1.4 9-4. Design and Implementation
-
■ Considerations for design and implementation (D&I) of a membrane bioreactor to achieve tertiary treatment and disinfectiona
-
• Development features
-
• Wastewater source and pretreatment
-
• MBR bioreactor sizing and membrane contact
-
• Membrane flux
-
• Membrane area sizing
-
• Membrane fouling and control
-
• MBR installation at the site
-
• Operation and maintenance (O&M) requirements
-
• Other considerations (e.g., commercially available MBRs)
a Note: Disinfection is covered in Chap. 14
-
-
■ D&I considerations—Development features
-
• Land use and development attributes
-
○ Type and number of wastewater sources
-
* Potential for clustering sources
-
-
○ Site land use and topography
-
* Construction space near the wastewater source(s)
-
* Locations of reuse or discharge options
-
-
○ Ability to provide O&M as required
-
-
• Subsurface characteristics
-
○ Can affect construction
-
* Depth to shallow bedrock
-
* Depth to ground water
-
* Depth of freezing zone
-
-
-
-
■ D&I considerations—Wastewater source and pretreatment
-
• MBRs can treat wastewaters of widely different characteristics
-
○ For decentralized applications typical sources include:
-
* Domestic wastewaters from residential developments
-
* Commercial and institutional wastewaters (e.g., restaurants, resorts, office buildings, etc.)
-
* Wastewaters from mixed-use developments
-
-
-
• Pretreatment requirements
-
○ Minimum requirement is fine screening (<3 mm, 1–2 mm typ.)
-
○ Primary treatment can be beneficial
-
○ Conditioning may be needed for some treatment processes
-
* e.g., alkalinity feed if the MBR is designed to achieve nitrification but the influent alkalinity is too low (e.g., 50 mg/L)
-
-
-
-
■ D&I Considerations—Aerobic tank sizing and solids wasting
-
• Aerobic tank sizing and solids wasting parameters are given in Table 9.6 and Fig. 9.8 and described in the following pages
Table 9.6 Key design parameters and method of selection or calculation for MBR sizing Fig. 9.8 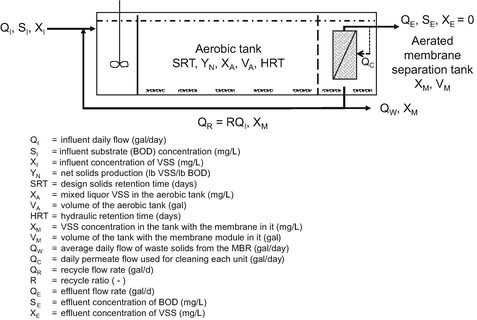
Illustration of an aerobic MBR flow regime that can be used for determining the aerobic tank volume and solids wasting
-
• Aerobic tank volume
-
○ The volume can be determined based on the solids retention time chosen in a fashion similar to that used for conventional activated sludge biological treatmenta
-
○ The SRT is defined by Eq. 9.2
$$ \mathrm{S}\mathrm{R}\mathrm{T}=\frac{{\mathrm{X}}_{\mathrm{A}}{\mathrm{V}}_{\mathrm{A}}+{\mathrm{X}}_{\mathrm{M}}{\mathrm{V}}_{\mathrm{M}}}{{\mathrm{Q}}_{\mathrm{W}}{\mathrm{X}}_{\mathrm{M}}} $$(9.2)Where:
SRT = design solids retention time (days)
XA = mixed liquor VSS in the aerobic tank (mg/L)
VA = volume of the aerobic tank (gal)
XM = VSS concentration in the tank with the membrane in it (mg/L)
VM = volume of the tank with the membrane module in it (gal)
QW = average daily flow of waste solids from the MBR (gal/day)
aSee Chap. 7 for additional information on aerobic biological treatment.
-
○ Based on a chosen SRT, the volume of the aerobic tank can be determined using Eq. 9.3
$$ {\mathrm{V}}_{\mathrm{A}}=\frac{\left(\mathrm{S}\mathrm{R}\mathrm{T}\right)\left({\mathrm{Q}}_{\mathrm{D}}\right)\left({\mathrm{S}}_{\mathrm{I}}\right)\left({\mathrm{Y}}_{\mathrm{N}}\right)}{{\mathrm{X}}_{\mathrm{A}}} $$(9.3)Where:
VA = volume of the aerobic tank (gal)
SRT = design solids retention time (days)
QD = design average daily flow rate (gal/day)
SI = influent BOD5 or COD substrate concentration (mg/L)
YN = net yield coefficient (lb-VSS produced/lb-BOD5 or -COD removed) as a function of SRT (–)
XA = average mixed liquor volatile suspended solids (MLVSS) (mg/L). Note: MLVSS ≈ a fraction of mixed liquor total suspended solids
-
-
• Hydraulic retention time
-
○ With the volume determined, the hydraulic retention time , HRT, can be calculated using Eq. 9.4
$$ \mathrm{H}\mathrm{R}\mathrm{T}=\frac{{\mathrm{V}}_{\mathrm{A}}}{{\mathrm{Q}}_{\mathrm{D}}} $$(9.4)Where:
HRT = hydraulic retention time (day). Note: HRT can be calculated for an average day, peak day, etc.
VA = aeration tank volume (gal)
QD = design daily flow rate (gal/day) (e.g., QA or QA × PF)
PF = peaking factor, varies depending on application (–) (typ. 1.0–3.0)
-
-
• MBR operating parameters are inter-related
-
○ Rearranging and substituting terms in Eqs. 9.3 and 9.4 yields the following relationship for HRT, SRT, MLVSS, and YN
$$ \mathrm{H}\mathrm{R}\mathrm{T}=\frac{\left(\mathrm{S}\mathrm{R}\mathrm{T}\right)\left({\mathrm{S}}_{\mathrm{I}}\right)\left({\mathrm{Y}}_{\mathrm{N}}\right)}{\left({\mathrm{X}}_{\mathrm{A}}\right)} $$(9.5)Where:
HRT = hydraulic retention time (days)
SRT = design solids retention time (days)
SI = influent BOD5 or COD substrate concentration (mg/L)
YN = net yield coefficient (lb-VSS produced/lb-BOD5 or COD removed) (–)
XA = average mixed liquor volatile suspended solids (MLVSS) (mg/L)
-
-
• Wasting of solids
-
○ Wasting of solids is required to maintain a target SRT and MLVSS
-
○ A definition schematic for wasting from an aerobic MBR is shown in Fig. 9.9
Fig. 9.9 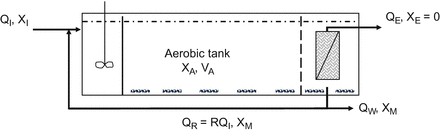
Definition schematic for solids recycling and wasting from a membrane bioreactor
-
○ The daily waste sludge flow rate can be computed for a given return sludge recycle ratio (R) and SRT using Eqs. 9.6 and 9.7
-
* Note that wasting does not have to occur every day but can vary as an average value over the duration of the target SRT
-
-
○ A mass balance on the MBR in Fig. 9.10 yields Eq. 9.6
$$ \begin{array}{l}\left({\mathrm{RQ}}_{\mathrm{I}}\right)\left({\mathrm{X}}_{\mathrm{M}}\right)+\left({\mathrm{Q}}_{\mathrm{I}}\right)\left({\mathrm{X}}_{\mathrm{I}}\right)=\left({\mathrm{Q}}_{\mathrm{I}}+{\mathrm{RQ}}_{\mathrm{I}}\right){\mathrm{X}}_{\mathrm{A}}\\ {}\left({\mathrm{RQ}}_{\mathrm{I}}\right)\left({\mathrm{X}}_{\mathrm{M}}\right)+\left({\mathrm{Q}}_{\mathrm{I}}\right)\left(\sim 0\right)=\left({\mathrm{Q}}_{\mathrm{I}}+{\mathrm{RQ}}_{\mathrm{I}}\right){\mathrm{X}}_{\mathrm{A}}\end{array} $$$$ {\mathrm{X}}_{\mathrm{A}}=\left(\frac{\mathrm{R}}{1+\mathrm{R}}\right){\mathrm{X}}_{\mathrm{M}} $$(9.6)Fig. 9.10 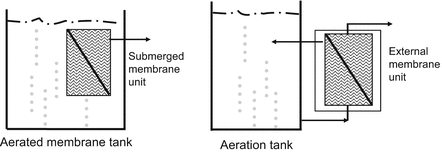
MBRs can be configured with membrane units that are submerged in the aeration tank (left) versus membrane units external to the aeration tank (right)
-
○ Substituting Eq. 9.6 into Eq. 9.3 and rearranging yields Eq. 9.7
$$ {\mathrm{Q}}_{\mathrm{W}}=\frac{\left(\frac{\mathrm{R}}{1+\mathrm{R}}\right){\mathrm{V}}_{\mathrm{A}}+{\mathrm{V}}_{\mathrm{M}}}{\mathrm{SRT}} $$(9.7)-
* Values of the recycle ratio, R, typically range from 4 to 6
-
* Values of VM vary but can be in the range of 20–30 % of VA
-
-
-
-
■ D&I considerations—Membrane unit configurations
-
• Membrane units are assembled in modules or cassettes that contact the contents of the aerobic tank in two basic configurations as shown in Fig. 9.10
-
-
■ D&I considerations—Membrane flux
-
• Flux is a design and operation parameter (Fig. 9.11)
Fig. 9.11 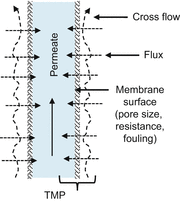
Flux through a membrane depends on membrane design and operating parameters
-
○ Flux = Vol./area/time (gal/day/ft2, m3/m2/day, m/day, or L/m2/h)
-
-
• Flux depends on many factors including:
-
○ Pore size
-
○ Trans-membrane pressure (TMP)
-
○ Cross flow velocity
-
○ Membrane resistance
-
○ Membrane fouling
-
-
• Example fluxes
-
○ Average = 10–15 gal/day/ft2
-
○ Maximum = 18–30 gal/day/ft2 (for ≤6 h)
Note: 1 L/m2/h = 0.59 gal/day/ft2
-
-
-
■ D&I considerations—Membrane surface area sizing
-
• Membranes can be assembled in units
-
○ Each unit (also known as cassettes or modules) has a certain membrane surface area for producing permeate
-
○ Total number of units is based on the total membrane area required and the surface area provided by each unit
-
-
• Total membrane surface area required is based on the membrane flux and the daily flow to be processed
-
○ Membrane area is needed to produce permeate which is discharged as effluent (QE)
-
○ Membrane surface area may also be needed to produce permeate that is used for membrane cleaning (QC)
-
-
• Flow regime for membrane sizing is given in Fig. 9.12
Fig. 9.12 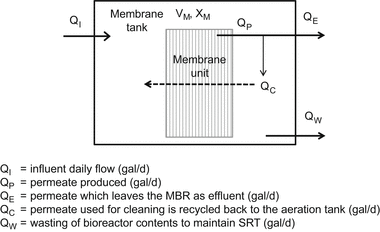
An example MBR flow regime that can be used for membrane sizing
-
• Membrane surface area required and number of membrane units can be calculated using Eqs. 9.8–9.12
$$ {\mathrm{F}}_{\mathrm{M}}^{\prime }={\mathrm{F}}_{\mathrm{M}}-{\mathrm{F}}_{\mathrm{C}} $$(9.8)$$ {\mathrm{A}}_{\mathrm{M}}^{\prime }=\frac{\left({\mathrm{Q}}_{\mathrm{I}}-{\mathrm{Q}}_{\mathrm{W}}\right)}{{\mathrm{F}}_{\mathrm{M}}^{\prime }} $$(9.9)$$ {\mathrm{N}}_{\mathrm{C}}^{\prime }=\frac{{\mathrm{A}}_{\mathrm{M}}^{\prime }}{{\mathrm{A}}_{\mathrm{C}}}\Rightarrow {\mathrm{N}}_{\mathrm{C}} $$(9.10)$$ {\mathrm{A}}_{\mathrm{M}}=\left({\mathrm{N}}_{\mathrm{C}}\right)\left({\mathrm{A}}_{\mathrm{C}}\right) $$(9.11)$$ {\mathrm{F}}_{\mathrm{M}}=\frac{\left({\mathrm{Q}}_{\mathrm{I}}-{\mathrm{Q}}_{\mathrm{W}}\right)+{\mathrm{N}}_{\mathrm{C}}\left({\mathrm{Q}}_{\mathrm{C}}\right)}{{\mathrm{A}}_{\mathrm{M}}}\Rightarrow \mathrm{okay}? $$(9.12)Where:
A′M = approximate total surface area of membranes required (ft2)
AM = final total surface area of membranes required (ft2)
QI = influent daily flow (gal/day)
QW = daily wasting flow of biosolids to maintain SRT (gal/day)
QC = daily permeate flow used for cleaning each unit (gal/day)
FM = design membrane flux limit (gpd/ft2) (e.g., 10–15 gal/day/ft2)
F′M = membrane flux producing effluent from the MBR (gal/day/ft2)
FC = membrane flux used for cleaning (gal/day/ft2)
N′C = estimated number of units required (–)
NC = number of units required (–)
AC = area provided by each unit (ft2)
-
-
■ D&I considerations—MBR effluent
-
• The MBR effluent is the permeate that passes through the membrane and exits the MBR
-
• The flow rate of membrane effluent is given by Eq. 9.13
$$ {\mathrm{Q}}_{\mathrm{E}}={\mathrm{Q}}_{\mathrm{I}}-{\mathrm{Q}}_{\mathrm{W}} $$(9.13)Where:
QE = permeate which leaves the MBR as effluent (gal/day)
QI = influent wastewater flow (gal/day)
QW = wasting of sludge from the MBR to maintain a target SRT (gal/day)
-
• The MBR effluent may require further treatment based on discharge or reuse plans (e.g., chemical or physical disinfection)
-
-
■ D&I considerations—Membrane fouling and control
-
• Membrane fouling is due to adsorption or deposition
-
○ Biopolymers or soluble microbial products (SMP)
-
○ Inorganic scales
-
-
• Membrane fouling affects flux or trans-membrane pressure
-
○ In constant flux operation, TMP increases due to fouling
-
○ In a constant TMP operation, flux declines due to fouling
-
-
• Membrane fouling is a key parameter affecting operation and process economics
-
○ Membrane fouling potential generally increases with higher MLSS levels, but it can also occur at low MLSS
-
○ Fouling causes increased O&M due to membrane cleaning and membrane replacement
-
-
• Fouling can be hindered or eliminated by different methods
-
○ Pretreatment of the influent to the MBR
-
○ Clean in place (CIP) maintenance cleaning
-
* Methods
-
– Back flushing with water/air
-
– Relaxation
-
-
* Frequency
-
– Can be done every hour or more often
-
-
-
○ Chemical cleaning
-
* Methods
-
– Remove membrane module from service and chemically soak and clean it
-
-
* Frequency
-
– Every 3–6 months or more
-
-
-
-
-
■ D&I considerations—Installation at the site
-
• Proper installation is critical to achieving performance of biological treatment systems including MBRs
-
○ The location of the MBR must enable access for construction equipment and service vehicles
-
○ Tankage and piping needs to be watertight and structurally sound
-
○ Materials of construction need to be corrosion resistant
-
○ Power is required for pumps, aerators, controls, etc. so power sources need to be robust and reliable
-
-
• Proper startup of the MBR is also critical
-
○ Seeding of the aeration basin with activated sludge solids from another biological treatment unit can be helpful
-
-
• Figures 9.13 and 9.14 present photographs illustrating the installation of packaged MBRs
Fig. 9.13 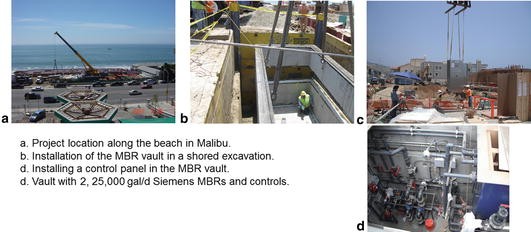
Photographs taken during installation of a MBR system to serve a commercial development located along the coast in Malibu, California. The system included MBRs, UV disinfection units , and high rate subsurface infiltration units. (Photographs courtesy of Integrated Water Services, Inc.)
Fig. 9.14 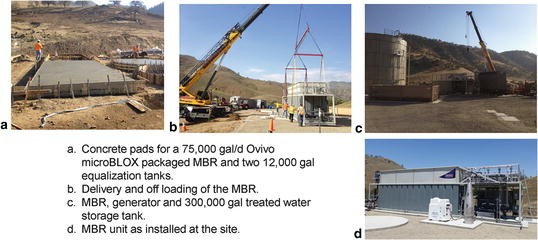
Photographs taken during installation of a MBR system to serve an Indian Tribe in California. The system consists of installation of a wastewater conveyance piping to a packaged MBR with equalization tanks, a treated water storage tank, a disinfection system, and land-based based dispersal system. (Photographs courtesy of Integrated Water Services, Inc.)
-
-
■ D&I considerations—Operation and maintenance
-
• O&M can be complicated and include a variety of activities and events including:
-
○ Typical O&M required for aerobic bioreactors (Chap. 7)
-
○ O&M of membrane pumps and aeration units
-
○ Membrane cleaning, maintenance and recovery cleaning
-
○ Membrane replacement
-
-
• Examples of three MBRs with operating parameters and routine O&M are summarized in Table 9.7
Table 9.7 Examples of routine O&M provided for three MBR units (Larsson and Persson 2004)
-


9.1.1.5 9-5. Summary
-
■ Membrane filtration can remove particles, molecules, ions and microorganisms out of wastewaters and other impaired waters
-
■ In an aerobic MBR , the mixed liquor in a bioreactor is treated using micro- to ultrafiltration membranes to retain biomass and filter out other constituents
-
■ For use in a MBR, membranes typically need to have uniform pore size distribution and high porosity, neutral charge, be inert and non-biodegradable, be easy to clean, and be durable and easy to replace
-
• The membranes in MBRs can achieve average flux rates of about 10–15 gal/day/ft2
-
-
■ MBRs can achieve tertiary treatment with disinfection and produce a consistent high quality effluent as long as O&M is reliably provided
9.1.1.6 9-6. Example Problems
-
■ 9EP-1. Design of an aerobic MBR
-
• Given information
-
○ Student housing development with an average daily flow estimated to be 30,000 gal/day and a maximum daily flow of 45,000 gal/day (based on a PF = 1.5)
-
○ The operating temperature for the MBR is estimated at 20 °C
-
○ The influent to the MBR will be primary effluent
-
○ Each membrane unit has a surface area = 323 ft2
-
○ The design membrane flux to handle the average daily flow and produce permeate for effluent plus cleaning = 12 gal/day/ft2
-
○ Membrane permeate returned to the membranes for cleaning = 325 gal/day per unit
-
○ The SRT chosen for the aerobic tank of the MBR was 15 days to enable nitrification and limit net solids production
-
-
• Determine
-
○ The volume (VA) of the aerobic tank (in gal)
-
○ The hydraulic retention time (HRT) in the aerobic tank (days)
-
○ Average volume/day of sludge (QW) that needs to be wasted from the MBR (in gal/day)
-
○ On an average day, how much MBR effluent water will be produced and available for irrigation (in gal/day)
-
○ How many membrane units will be required
-
○ What the maximum flux rate would be during the maximum daily flow
-
-
• Solution
-
○ A flow regime for solving this problem appears in Fig. 9.8
-
○ Determine the aerobic tank volume, VA
-
* Select a value for the net solids production, YN
-
– With the SRT set at 15 days for a MBR receiving primary effluent and operated at 20 °C, a value for YN can be selected for the aerobic treatment operation
-
– From Table 9.5, YN = 0.48 lb-VSS/lb-BOD removed
-
-
* The target XA is chosen to be 10,000 mg VSS/L based on typical values (Table 9.6)
-
* The aerobic tank volume, VA, is calculated using Eq. 9.3
$$ \begin{array}{l}{\mathrm{V}}_{\mathrm{A}}=\frac{\left(\mathrm{S}\mathrm{R}\mathrm{T}\right)\left({\mathrm{Q}}_{\mathrm{D}}\right)\left({\mathrm{S}}_{\mathrm{I}}\right)\left({\mathrm{Y}}_{\mathrm{N}}\right)}{{\mathrm{X}}_{\mathrm{A}}}\end{array} $$(9.3)$$ \begin{array}{l}{\mathrm{V}}_{\mathrm{A}}=\frac{\left(15\;\mathrm{day}\mathrm{s}\right)\left(30,000\;\mathrm{gal}\kern0.1em /\kern0.1em \mathrm{day}\right)\left(150\;\mathrm{mg}\hbox{-} \mathrm{BOD}\kern0.1em /\kern0.1em \mathrm{L}\right)\left(0.48\;\mathrm{lb}\hbox{-} \mathrm{V}\mathrm{S}\mathrm{S}/\mathrm{lb}\hbox{-} \mathrm{BOD}\mathrm{rem}.\right)}{10,000\;\mathrm{mg}\hbox{-} \mathrm{V}\mathrm{S}\mathrm{S}\kern0.1em /\kern0.1em \mathrm{L}}\\ {}{\mathrm{V}}_{\mathrm{A}}=3,240\;\mathrm{gal}\end{array} $$
-
-
○ The hydraulic retention time can be calculated using Eq. 9.4 or 9.5
$$ \begin{array}{l}\mathrm{H}\mathrm{R}\mathrm{T}=\frac{{\mathrm{V}}_{\mathrm{A}}}{{\mathrm{Q}}_{\mathrm{D}}}\\ {}\mathrm{H}\mathrm{R}\mathrm{T}=\frac{3,240\;\mathrm{gal}}{30,000\;\mathrm{gal}\kern0.1em /\kern0.1em \mathrm{day}}=0.108\;\mathrm{day}=2.6\;\mathrm{h}\end{array} $$(9.4)$$ \begin{array}{l}\mathrm{H}\mathrm{R}\mathrm{T}=\frac{\left(\mathrm{S}\mathrm{R}\mathrm{T}\right)\left({\mathrm{S}}_{\mathrm{I}}\right)\left({\mathrm{Y}}_{\mathrm{N}}\right)}{\left({\mathrm{X}}_{\mathrm{A}}\right)}\\ {}\mathrm{H}\mathrm{R}\mathrm{T}=\frac{\left(15\ \mathrm{day}\mathrm{s}\right)\left(150\;\mathrm{mg}\hbox{-} \mathrm{BOD}\kern0.1em /\kern0.1em \mathrm{L}\right)\left(0.48\;\mathrm{lb}\kern0.1em \hbox{-} \kern0.1em \mathrm{V}\mathrm{S}\mathrm{S}\kern0.1em /\mathrm{lb}\hbox{-} \mathrm{BOD}\mathrm{rem}.\right)}{\left(10,000\;\mathrm{mg}\hbox{-} \mathrm{V}\mathrm{S}\mathrm{S}\kern0.1em /\kern0.1em \mathrm{L}\right)}\\ {}\mathrm{H}\mathrm{R}\mathrm{T}=0.108\;\mathrm{day}=2.6\;\mathrm{h}\end{array} $$(9.5) -
○ Calculate the average volume /day of activated sludge (QW) that needs to be wasted from the MBR (in gal/day)
-
* Equation 9.7 is used to calculate QW
-
* Assume VM = 25 % of VA or VM = 810 gal
-
* Assume R = 4 (typ. value = 4–6)
$$ \begin{array}{l}{\mathrm{Q}}_{\mathrm{W}}=\frac{\left[\left(\frac{\mathrm{R}}{1+\mathrm{R}}\right){\mathrm{V}}_{\mathrm{A}}\right]+{\mathrm{V}}_{\mathrm{M}}}{\mathrm{SRT}}\\ {}{\mathrm{Q}}_{\mathrm{W}}=\frac{\left[\left(\frac{4}{1+4}\right)3,240\;\mathrm{gal}\right]+810\;\mathrm{gal}}{15\;\mathrm{day}\mathrm{s}}\\ {}{\mathrm{Q}}_{\mathrm{W}}=227\;\mathrm{gal}\kern0.1em /\kern0.1em \mathrm{day}\end{array} $$(9.7)
-
-
○ Determining how much MBR effluent water will be produced and available for irrigation on an average day
-
* The effluent produced on an average day can be calculated using Eq. 9.13
$$ \begin{array}{l}{\mathrm{Q}}_{\mathrm{E}}={\mathrm{Q}}_{\mathrm{I}}-{\mathrm{Q}}_{\mathrm{W}}\\ {}{\mathrm{Q}}_{\mathrm{E}}=30,000\;\mathrm{gal}\kern0.1em /\kern0.1em \mathrm{day}-227\;\mathrm{gal}\kern0.1em /\kern0.1em \mathrm{day}\\ {}{\mathrm{Q}}_{\mathrm{E}}=29,773\;\mathrm{gal}\kern0.1em /\kern0.1em \mathrm{day}\end{array} $$(9.13)
-
-
○ Membrane area required and number of membrane units can be calculated using Eqs. 9.8–9.12
-
* Initial determination of the number of membrane units required is given by Eqs. 9.8–9.10
$$ {\mathrm{F}}_{\mathrm{M}}^{\prime }={\mathrm{F}}_{\mathrm{M}}-{\mathrm{F}}_{\mathrm{C}}=12\;\mathrm{gal}/\mathrm{d}\mathrm{a}\mathrm{y}/{\mathrm{ft}}^2-\frac{325\;\mathrm{gal}/\mathrm{da}\mathrm{y}}{323\;{\mathrm{ft}}^2}=11\ \mathrm{gal}\kern0.1em /\kern0.1em \mathrm{day}/\kern0.1em {\mathrm{ft}}^2 $$(9.8)$$ {\mathrm{A}}_{\mathrm{M}}^{\prime }=\frac{\left({\mathrm{Q}}_{\mathrm{I}}-{\mathrm{Q}}_{\mathrm{W}}\right)}{{\mathrm{F}}_{\mathrm{M}}^{\prime }}=\frac{\left(30,000\ \mathrm{gal}\kern0.1em /\kern0.1em \mathrm{d}\mathrm{ay}-227\;\mathrm{gal}\kern0.1em /\kern0.1em \mathrm{d}\mathrm{ay}\right)}{11\kern0.62em \mathrm{gal}\kern0.1em /\kern0.1em \mathrm{d}\kern0.1em \mathrm{a}\mathrm{y}/\kern0.1em {\mathrm{ft}}^2}=2,707\ {\mathrm{ft}}^2 $$(9.9)$$ \begin{array}{l}{\mathrm{N}}_{\mathrm{C}}^{\prime }=\frac{{\mathrm{A}}_{\mathrm{M}}^{\prime }}{{\mathrm{A}}_{\mathrm{C}}}\Rightarrow {\mathrm{N}}_{\mathrm{C}}\\ {}{\mathrm{N}}_{\mathrm{C}}^{\prime }=\frac{2,707\kern0.2em {\mathrm{ft}}^2}{323\;{\mathrm{ft}}^2/\mathrm{unit}}=8.4\Rightarrow {\mathrm{N}}_{\mathrm{C}}=9\ \mathrm{units}\end{array} $$(9.10) -
* The membrane surface area provided by the 9 membrane units is checked to see if it is sufficient for the design flow and cleaning required using Eqs. 9.11 and 9.12
$$ \begin{array}{l}{\mathrm{A}}_{\mathrm{M}}=\left({\mathrm{N}}_{\mathrm{C}}\right)\left({\mathrm{A}}_{\mathrm{C}}\right)\\ {}{\mathrm{A}}_{\mathrm{M}}=\left(9\ \mathrm{units}\right)\left(323\ {\mathrm{ft}}^2/\mathrm{unit}\right)=2,907\kern0.5em {\mathrm{ft}}^2\end{array} $$(9.11)$$ \begin{array}{l}{\mathrm{F}}_{\mathrm{M}}=\frac{\left({\mathrm{Q}}_{\mathrm{I}}-{\mathrm{Q}}_{\mathrm{W}}\right)+{\mathrm{N}}_{\mathrm{C}}\left({\mathrm{Q}}_{\mathrm{C}}\right)}{{\mathrm{A}}_{\mathrm{M}}}\Rightarrow \mathrm{okay}?\\ {}{\mathrm{F}}_{\mathrm{M}}=\frac{\left(30,000\ \mathrm{gal}/\mathrm{day}-227\ \mathrm{gal}/\mathrm{day}\right)+9\kern0.5em \mathrm{units}\left(325\ \mathrm{gal}/\mathrm{unit}\right)}{2,907\ {\mathrm{ft}}^2}\\ {}{\mathrm{F}}_{\mathrm{M}}=11.2\kern0.5em \mathrm{is}\le 12\ \mathrm{gal}\kern0.1em /\mathrm{day}/{\mathrm{ft}}^2\end{array} $$(9.12)✓Okay
-
-
○ The maximum flux rate during the maximum daily flow can be determined using Eq. 9.12
$$ \begin{array}{l}{\mathrm{F}}_{\mathrm{M}}=\frac{\left({\mathrm{Q}}_{\mathrm{I}}-{\mathrm{Q}}_{\mathrm{W}}\right)+{\mathrm{N}}_{\mathrm{C}}\left({\mathrm{Q}}_{\mathrm{C}}\right)}{{\mathrm{A}}_{\mathrm{M}}}\\ {}{\mathrm{F}}_{\mathrm{M}}=\frac{\left(45,000\ \mathrm{gal}/\mathrm{da}\mathrm{y}-227\ \mathrm{gal}/\mathrm{da}\mathrm{y}\right)+9\kern0.5em \mathrm{units}\left(325\ \mathrm{gal}/\mathrm{d}\mathrm{a}\mathrm{y}/\mathrm{unit}\right)}{2,907\ {\mathrm{ft}}^2}\\ {}{\mathrm{F}}_{\mathrm{M}}=16.4\ \mathrm{gal}\kern0.1em /\kern0.1em \mathrm{d}\mathrm{a}\mathrm{y}/{\mathrm{ft}}^2\end{array} $$(9.12)✓ This FM appears okay since it is less than the maximum flux rate which typically ranges 18–30 gal/day/ft2 (typically during a peak period of ≤6 h).
-
-
Rights and permissions
Copyright information
© 2017 Springer International Publishing AG
About this chapter
Cite this chapter
Siegrist, R.L. (2017). Treatment Using Membrane Bioreactors. In: Decentralized Water Reclamation Engineering. Springer, Cham. https://doi.org/10.1007/978-3-319-40472-1_9
Download citation
DOI: https://doi.org/10.1007/978-3-319-40472-1_9
Published:
Publisher Name: Springer, Cham
Print ISBN: 978-3-319-40471-4
Online ISBN: 978-3-319-40472-1
eBook Packages: Earth and Environmental ScienceEarth and Environmental Science (R0)