
Abstract
Subsurface soil infiltration is a form of land-based treatment where effluent from a tank-based wastewater treatment unit is infiltrated into soil below the ground surface and treatment occurs during percolation through a soil profile and assimilation into the subsurface soil and groundwater environment. Land-based systems have been used for more than 100 years, initially for simple waste disposal but later for effective treatment purposes also. A modern version of a land-based system is a soil treatment unit that is designed to achieve tertiary treatment and natural disinfection. This Chapter presents the principles and processes involved in wastewater treatment in soil and the considerations important to design and implementation of soil treatment units that rely on subsurface soil infiltration and recharge of local groundwater.
Access this chapter
Tax calculation will be finalised at checkout
Purchases are for personal use only
References
References cited in Chap. 11 are listed along with other references that have content relevant to the topics covered in Chap. 11.
Ausland GA (1998) Hydraulics and purification in wastewater filters. Ph.D. Diss Agric University of Norway, Aas, Norway
Andreoli A, Bartilucci N, Forgione R, Reynolds R (1979) Nitrogen removal in a subsurface disposal system. J Water Pollut Cont Fed 51(4):841–854
Beach DN, McCray JE (2003) Numerical modeling of unsaturated flow in wastewater soil absorption systems. Ground Water Monit Rem 23(2):64–72
Beach DNH, McCray JE, Lowe KS, Siegrist RL (2005) Temporal changes in hydraulic conductivity of sand porous media biofilters during wastewater infiltration due to biomat formation. J Hydrol 311(2005):230–243
Beal C, Gardner T, Menzies N, Rassam D, Kirchhof G (2005) Long term infiltration rates and flow pathways in septic trenches. In: Proceedings of On-site’05 Conference, Performance Assessment for On-site Systems: Regulation, Operation, and Monitoring. University of New England, Australia, 67–74 pp
Bouma J (1975) Unsaturated flow during soil treatment of septic tank effluent. ASCE J Env Eng 101(6):967–983
Bumgarner JR, McCray JE (2007) Estimating biozone hydraulic conductivity in wastewater soil-infiltration systems using inverse numerical modeling. Water Res 41(11):2349–2360
CDPHE (2013) On-site Wastewater Treatment System Regulation, Regulation #43, 5 CCR 1002-43, Colorado Department of Public Health and Environment. Water Quality Control Commission, Denver, Colorado, https://www.colorado.gov/pacific/sites/default/files/Regulation-43.pdf, 91 pp
Cogger CG, Hajjar LM, Moe CL, Sobsey MD (1988) Septic system performances on a coastal barrier island. J Environ Qual 17(3):401–407
Conn KE, Siegrist RL, Barber LB, Meyer MT (2010) Fate of trace organic compounds during vadose zone soil treatment in an onsite wastewater system. J Environ Toxicol Chem 29(2):285–293
Eliasson J (2004) Septic tank effluent values. Rule Development Committee Issue Research Report. Washington State Department of Health, Waste Management Program, 16 pp
U.S. Environmental Protection Agency (2002) Onsite wastewater treatment systems manual. EPA/625/R-00/008. http://www.epa.gov/ORD/NRMRL/Pubs/625R00008/625R00008.htm
Geza M, McCray JE, Lowe KS, Tucholke M, Wunsch A, Roberts S (2009) A simple tool for predicting nutrient removal in soil treatment units. In: Proceedings of the NOWRA 18th Annual Technical Education Conference, Milwaukee
Geza M, McCray JE, Murray KE (2010) Model evaluation of potential impacts of on-site wastewater systems on phosphorus in Turkey Creek watershed. J Environ Qual 39(5):1636–1646
Geza M, Lowe KS, McCray JE (2013) STUMOD—a tool for predicting fate and transport of nitrogen in soil treatment units. Environ Model Assess 19:243–256
Hargett DL, Tyler EJ, Siegrist RL (1982) Soil infiltration capacity as affected by septic tank effluent application strategies. In: Proceedings of the 3rd National Symposium on Individual and Small Community Sewage Treatment. ASAE, St. Joseph, 72–84 pp
Heatwole KK, McCray JE (2007) Modeling potential vadose-zone transport of nitrogen from onsite wastewater systems at the development scale. J Contam Hydrol 91:184–201
Jenssen PD (1986) Infiltration of wastewater in norwegian soils – some design criteria for wastewater infiltration systems. Dr. Scient. thesis, Department of Geology, Agricultural University of Norway
Jenssen PD, Siegrist RL (1990) Technology assessment of wastewater treatment by soil infiltration systems. Water Sci Technol 22(34):83–92
Lowe KS, Siegrist RL (2008) Controlled field experiment for performance evaluation of septic tank effluent treatment during soil infiltration. ASCE J Env Eng 134(2):93–101
Lowe KS, VanCuyk SM, Siegrist RL (2007) Soil treatment unit performance as affected by hydraulic loading rate and applied effluent quality. In: Proceedings of the 11th National Symposium on Individual and Small Community Sewage Systems, American Society of Agricultural and Biological Engineers (ASABE), St. Joseph
McCray JE, Kirkland SL, Siegrist RL, Thyne GD (2005) Model parameters for simulating fate and transport of onsite wastewater nutrients. Ground Water 43(4):628–639
McCray JE, Lowe KS, Geza M, et al. (2009) State of the science: review of quantitative tools to determine wastewater soil treatment unit performance. Final project report by Colorado School of Mines. WERF, DEC1R06, 196 pp. http://www.decentralizedwater.org/
McCray JE, Geza M, Lowe KS, et al. (2010) Quantitative tools to determine the expected performance of wastewater soil treatment units. Final reports and tools. Final project report by Colorado School of Mines. WERF, DEC1R06a, 474 pp. http://www.decentralizedwater.org/
McKinley JW, Siegrist RL (2010) Accumulation of organic matter components in soil during conditions imposed by wastewater infiltration. Soil Sci Soc Am J 74(5):1690–1700
McKinley JW, Siegrist RL (2011) Soil clogging genesis in soil treatment units used for onsite wastewater reclamation: a review. Crit Rev Environ Sci Technol 41(24):2186–2209. doi:10.1080/10643389.2010.497445
Pang L, Nokes C, Simunek J, Kikkert H, Hector R (2006) Modeling the impact of clustered septic tank systems on groundwater quality. Vadose Zone J 5(2):599–609
Poeter E, McCray J, Thyne G, Siegrist R (2005a) Designing cluster and high-density wastewater soil-absorption systems to control groundwater mounding. Small Flows J 7(4):24–36
Poeter E, McCray J, Thyne G, Siegrist RL (2005) Guidance for evaluation of potential groundwater mounding associated with cluster and high-density wastewater soil absorption systems. Final report to U.S. EPA National Decentralized Water Resources Capacity Development Project, Project No. WU-HT-02-45, 135 pp. http://www.ndwrcdp.org/
Radcliffe DE, Bradshaw JK (2014) Model test of proposed loading rates for onsite wastewater treatment systems. Soil Sci Soc Am J 78(1):97–107
Radcliffe DE, West LT (2007) Modeling long term acceptance rates for OWMSs. In: Proceedings of the 11th National Symposium on Individual and Small Community Sewage Treatment, October 20–24, in Warwick, RI. ASABE, St. Joseph
Radcliffe DE, West LT, Singer J (2005) Gravel effect on wastewater infiltration from septic system trenches. Soil Sci Soc Am J 69:1217–1224
Siegrist RL (1987) Soil clogging during subsurface wastewater infiltration as affected by effluent composition and loading rate. J Environ Qual 16:181–187
Siegrist RL (1988) Hydraulic loading rates for soil absorption systems based on wastewater quality. Proceedings of the 5th National Symposium on Individual and Small Community Sewage Treatment. ASAE, St. Joseph, 232–241 pp
Siegrist RL (2006) Evolving a rational design approach for sizing soil treatment units: design for wastewater effluent infiltration. Small Flows J 7(2):16–24
Siegrist RL (2007) Engineering soil treatment units as a unit operation in onsite wastewater reclamation systems. In: Proceedings of the 11th National Symposium on Individual and Small Community Sewage Systems, American Society of Agricultural and Biological Engineers (ASABE), St. Joseph
Siegrist RL (2008) So much for so little: the modern soil treatment unit. Water Environ Technol 20(7):6–12
Siegrist RL (2014) Engineering design of a modern soil treatment unit. In: Innovations in soil-based onsite wastewater treatment, Proceedings of Soil Science Society of America Conference, Albuquerque, April 6–7 2014, 14 pp
Siegrist RL, Boyle WC (1987) Wastewater induced soil clogging development. ASCE J Env Eng 113(3):550–566
Siegrist RL, Anderson DL, Converse JC (1984) Onsite treatment and disposal of restaurant wastewater. Small scale waste management project. University of Wisconsin, Madison, 38pp
Siegrist RL, PD Jenssen (1989) Nitrogen removal during wastewater infiltration as affected by design and environmental factors. Proc 6th on-site wastewater treatment short course, Sept. 1989. University of Washington, Seattle, WA
Siegrist RL, Tyler EJ, Jenssen PD (2001) Design and performance of onsite wastewater soil absorption systems. In: Proceedings of Risk-based decision making for onsite wastewater treatment. Electric Power Research Institute, Palo Alto, 63–114 pp. http://ndwrcdp.werf.org/documents/RESEARCH_NEEDS_PROCEEDINGS_CD.PDF
Siegrist RL, Lowe KS, McCray JE, Beach D, VanCuyk S (2002) Accelerated loading methods to evaluate long-term performance of soil PMBs used for wastewater treatment. In: Proceedings 11th Northwest On-Site Wastewater Treatment Short Course and Equipment Exhibition, April 3–4, 2002, University of Washington, Seattle, 12 pp
Siegrist RL, McCray JE, Lowe KS (2004) Wastewater infiltration into soil and the effects of infiltrative surface architecture. Small Flows J 5(1):29–39
Siegrist R, McCray J, Weintraub L, et al. (2005) Quantifying site-scale processes & watershed-scale cumulative effects of decentralized wastewater systems. NDWRCDP, WUHT-02-27. Final project report, 587 pp. http://www.decentralizedwater.org/research_project_WU-HT-00-27.asp
SSWMP (1978) Management of small waste flows. Final report prepared by the University of Wisconsin, Small Scale Waste Management Project and submitted to the U.S. Environmental Protection Agency, Cincinnati. EPA 600/2-78-173, 810 pp
Tackett KN, KS Lowe, RL Siegrist, SM VanCuyk (2004) Vadose zone treatment during effluent reclamation as affected by infiltrative surface architecture and hydraulic loading rate. Proc 10th national symposium on individual and small community sewage systems, ASAE, March 21–24. pp. 655–667
Thomas RE, Schwartz WA, Bendixen TW (1966) Soil chemical changes and infiltration rate reduction under sewage spreading. Soil Sci Soc Am J 30:641–646
Tomaras J, Sahl JW, Siegrist RL, Spear JR (2009) Microbial diversity of septic tank effluent and a soil biomat. Appl Environ Microbiol 75(10):3348–3351
Tyler EJ, Converse JC (1989) Hydraulic loading based upon wastewater effluent quality. Proceedings of the 6th Northwest Onsite Wastewater Treatment Short Course, Sept, Seattle, 163–172 pp
VanCuyk S, Siegrist RL (2007) Virus removal within a soil infiltration zone as affected by effluent composition application rate and soil type. Water Res 41:699–709
VanCuyk S, Siegrist RL, Logan A, Masson S, Fischer E, Figueroa L (2001) Hydraulic and purification behaviors and their interactions during wastewater treatment in soil infiltration systems. Water Res 35(4):953–964
VanCuyk S, Siegrist RL, Lowe KS, Harvey RW (2004) Evaluating microbial purification during soil treatment of wastewater with multicomponent tracer and surrogate tests. J Environ Qual 33:316–329
VanCuyk S, Siegrist RL, Lowe KS, Drewes J, Munakata-Marr J, Figueroa L (2005) Performance of engineered pretreatment units and their effects on Biozone formation in soil and system purification efficiency. NDWRCDP, WU-HT-03-36. Final project report, 241 p. http://www.decentralizedwater.org/
Author information
Authors and Affiliations
Slides of Chapter 11: Decentralized Water Reclamation
Slides of Chapter 11: Decentralized Water Reclamation
11.1.1 Chapter 11: Treatment using Subsurface Soil Infiltration
Contents
-
11-1.
Introduction
-
11-2.
Treatment performance
-
11-3.
Principles and processes
-
11-4.
Design and implementation
-
11-5.
Summary
-
11-6.
Example problems
11.1.1.1 11-1. Introduction
-
■ Treatment using land-based systems
-
• Treatment of wastewaters (and other impaired waters) can be accomplished in land-based systems by exploiting specific characteristics of landscape and soil ecosystems
-
• In these systems wastewaters (primary or secondary effluents) are treated and assimilated into the local hydrologic system
-
○ Wastewater effluent is released to the land, either above ground or below ground, and migrates in one or more directions
-
* Downward and laterally through the soil profile to groundwater
-
* Upward via evapotranspiration to the atmosphere, and/or
-
* Laterally across a vegetated landscape surface
-
-
○ Treatment occurs during long hydraulic retention times by a dynamic set of processes that include physical, chemical, and biological reactions
-
-
• Land-based treatment systems can be classified by the method of wastewater dispersal and the receiving environment (Fig. 11.1)
Fig. 11.1 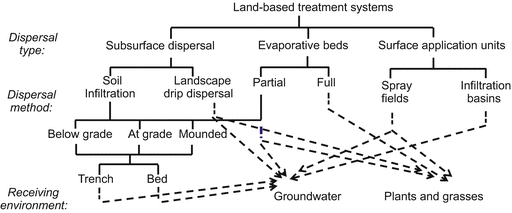
Classification of land-based treatment systems including subsurface soil infiltration and landscape drip dispersal, which are most commonly used in decentralized applications
-
-
■ Land-based systems have been used in decentralized applications for more than 100 year
-
• In the United States during much of the 20th century, land-based systems were used in various forms for waste disposal
-
○ e.g., in a pit privy, cesspool, seepage pit, or leachfield
-
-
• Advances in understanding during the 1970s led to improvements directed at effective treatment plus disposal
-
○ e.g., in a soil absorption system
-
-
• Millions of these land-based systems exist in the United States
-
○ Some are poorly designed, improperly located, and not performing well with respect to treatment efficiency
-
○ Some are more properly designed and located and are providing an acceptable treatment efficiency
-
-
-
■ Evolution of modern soil-based treatment systems
-
• Advancements were made in soil-based systems to enable long-term wastewater treatment in decentralized applications
-
○ Research projects and field experiences occurred through the late 1990s and early 2000s
-
○ Advancements in system science, engineering and modeling helped enable more rational design and implementation of a soil treatment unit (a.k.a. soil treatment area) that would reliably achieve tertiary treatment with natural disinfection during subsurface infiltration, percolation, and groundwater recharge
-
-
• Chapter 11 is focused on soil treatment units (STU) and the word “modern” is used to distinguish a contemporary STU from older land-based systems that were designed primarily for disposal
Note: Chap. 12 is focused on landscape drip dispersal.
-
-
■ Basic features of a modern STU
-
• Effluent from a confined unit operation (e.g., septic tank or aerobic unit) is delivered as the influent to a set of infiltration units (e.g., trenches or beds) that are constructed below ground surface
-
• The influent to the STU infiltrates into the native soil profile and percolates downward and transitions to a reclaimed water that can be further attenuated and assimilated in a local groundwater
-
• Treatment occurs during long hydraulic retention times in the subsurface (e.g., months to years) due to physico-chemical and attached growth biological processes as well as by attenuation through dilution and dispersion
-
• An example of a STU for a particular application and set of site conditions is illustrated in Figs. 11.2 and 11.3.
Fig. 11.2 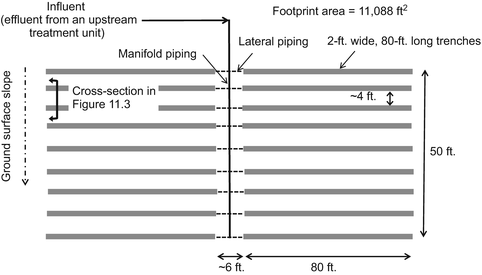
Plan view of a modern STU (network of 18 trenches for 2000 gal/day)
Fig. 11.3 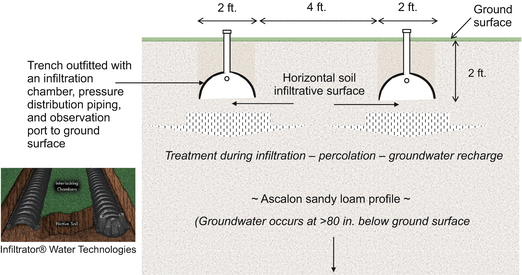
Cross-section view of a set of subsurface infiltration trenches used in a STU for a particular application and set of site conditions
-
• Placement of a soil infiltrative surface
-
○ The horizontal soil infiltrative surface can be placed so there is a depth interval of unsaturated aerobic soil before a limiting condition is reached (Fig. 11.4)
Fig. 11.4 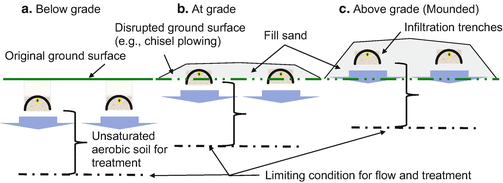
Optional placement of the soil infiltrative surface to provide an adequate depth of unsaturated aerobic soil before a limiting condition occurs
-
* Limiting conditions include a low permeability layer, fractured bedrock, perched zone of saturation or groundwater table
-
-
-
-
■ Where are STUs used?
-
• Where site conditions and soil properties are suitable and land area is available
-
○ For treatment of primary (e.g., septic tanks) or secondary treated wastewater (e.g., aerobic treatment or porous media biofilter effluent) and hydrologic assimilation of reclaimed water
-
○ For discharge and hydrologic assimilation of tertiary treated wastewater (e.g., membrane bioreactor effluent)
-
-
• A STU can be used in decentralized systems to treat wastewaters, graywaters, and other impaired waters generated in buildings and developments including:
-
○ Isolated homes and businesses in rural areas
-
○ Clusters of buildings including mixed-use development centers
-
○ Suburban developments and small towns
-
-


11.1.1.2 11-2. Treatment Performance
-
■ STUs are commonly designed to receive primary or secondary treated wastewaters and achieve tertiary treatment with natural disinfection
-
• Treatment occurs within two or more zones in the subsurface
-
○ Treatment within the STU—boundaries are variably defined
-
○ Attenuation and assimilation within the subsurface under and away from the STU
-
-
• Treatment performance depends on site conditions and soil properties as well as STU design and implementation
-
-
■ STUs can also be designed to receive tertiary quality effluents (e.g., from a membrane bioreactor)
-
• Primary goal is to enable discharge via high rate infiltration into the subsurface and polishing of any residual constituents of concern
-
-
■ Treatment efficiency
-
• Assessing treatment efficiency for a STU is more complicated than for a confined unit like a packaged biofilter since in a STU there is not an outlet per se for a treated effluent
-
○ Concentrations in percolate (soil pore water, CPW) at a depth below the infiltrative surface (e.g., 3 ft) can be compared to the effluent applied (CI) to determine removal efficiency (RE) using Eq. 11.1 (Fig. 11.5)
Fig. 11.5 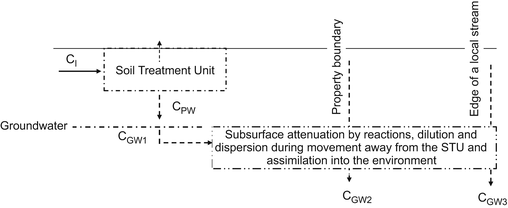
Definition schematic for components and compliance points that can be used to define the treatment efficiency in a STU
-
○ In most situations it is very hard to assess RE in this manner due to the difficulties and costs of monitoring soil pore water
-
-
• Oftentimes what is most important is that the treatment efficiency is sufficient to reduce the concentrations of constituents of concern to a certain level at a certain location
-
○ e.g., CGW2 = 10-mgN/L in groundwater at the property boundary (Fig. 11.5)
$$ {\mathrm{R}}_{\mathrm{E}}=\left[\frac{{\mathrm{C}}_{\mathrm{I}}-{\mathrm{C}}_{\mathrm{PW}}}{{\mathrm{C}}_{\mathrm{I}}}\right]\kern0.5em \times \kern0.5em 100\% $$(11.1)
-
-
• Treatment efficiencies achievable in a STU are shown in Table 11.1
Table 11.1 Treatment efficiency achieved within a well designed and operated STUa -
• Treatment efficiency for nitrogen can be complicated
-
○ Total N removal involves nitrification and denitrification, which depend on soil profile attributes combined with the wastewater loading rate and composition (Tables 11.2 and 11.3)
Table 11.2 STUMOD model simulations of nitrogen fate by two-foot depth below the soil infiltrative surface for septic tank effluent infiltration at two rates in different soilsa Table 11.3 STUMOD model simulations of total nitrogen removal during subsurface soil infiltration compared to measured data from laboratory or field studies (Geza et al. 2014) -
○ Results of model simulations and studies illustrate varied interactions affecting the removal of NH4-N and total N, e.g.:
-
* Complete conversion of NH4 + by 2 ft depth is common, except at higher HLRs applied to finer-grained soils
-
* By 2 ft depth total N removal is often 30–50 % or more except at higher HLRs (e.g., 1.2 gal/day/ft2) applied to coarse grained soils (Table 11.2)
-
* By 3 ft depth or more, total N removal can be 70–100 % at low HLRs (e.g., 0.5 gal/day/ft2 or less) (Table 11.3)
-
-
○ If the soil infiltrative surface is continuously ponded with influent, the soil below it may be anoxic and nitrification will be hindered
-
* Application of nitrified effluent under this condition could yield high total N removals by denitrification processes
-
-
-
-
■ STU effluent (soil pore water) composition
-
• Factors affecting treatment efficiency and water quality
-
○ Site conditions and soil profile properties and their suitability for wastewater infiltration and migration in the subsurface
-
○ A design hydraulic loading rate that is appropriate for the influent wastewater composition and the site conditions and soil properties
-
○ A method of wastewater influent delivery and distribution that results in utilization of the soil infiltrative surface per the design
-
○ During operation, unsaturated aerobic conditions are present in the soil profile for a minimum depth below the soil infiltrative surface before a limiting condition is encountered
-
○ Groundwater conditions under the site help provide attenuation and assimilation of reclaimed water
-
-

11.1.1.3 11-3. Principles and Processes
-
■ Natural soil in the environment
-
• Soil has been defined by the National Resources Conservation Service (NRCS) as follows:
-
“Soil is a natural body comprised of solids (minerals and organic matter), liquid, and gases that occurs on the land surface, occupies space, and is characterized by one or both of the following: horizons, or layers, that are distinguishable from the initial material as a result of additions, losses, transfers, and transformations of energy and matter or the ability to support rooted plants in a natural environment.”—NRCSa
-
-
• A basic understanding of soil science is needed
-
○ To understand the principles and processes important to wastewater treatment in a native soil profile
-
○ Several key concepts and considerations are highlighted in Fig. 11.6
Fig. 11.6 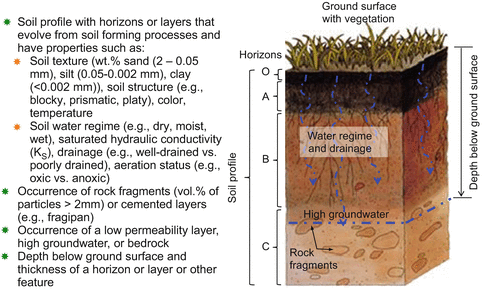
Basic illustration of several soil science concepts and considerations related to wastewater treatment and water reclamation in a native soil profile
a Source: http://www.nrcs.usda.gov/wps/portal/nrcs/detail/soils/edu/?cid=nrcs142p2_054280
-
-
-
■ Processes affecting wastewater treatment in soila
-
• Major processes affecting wastewater applied to subsurface soil
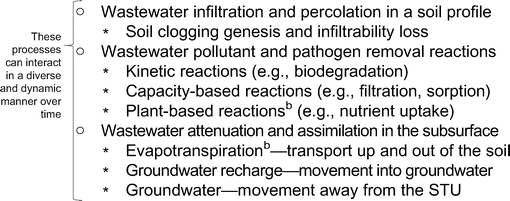
aIn the context of subsurface soil infiltration, wastewater applied is almost always an effluent from a confined unit operation like a septic tank, aerobic treatment unit, porous media biofilter, etc.
bET contributions to a water balance in a STU (e.g., < 15 %) and plant-based reaction contributions to treatment are normally very low based on STU design features (e.g., depth and absence of rooting). ET and plant-based reactions are important during treatment using landscape drip dispersal (refer to Chap. 12).
-
-
■ Wastewater infiltration and percolation
-
• Infiltration of clean water into a soil profile
-
○ Definition
“Infiltration is the term applied to the process of water entry into the soil, generally by downward flow through all or part of the soil surface.”—Hillel 1998
-
-
-
○ Terminology
-
* Infiltration rate
-
– IR or q = the volume flux of water per unit surface area per time (e.g., gal/day/ft2, cm3/cm2/day or cm/day)
-
-
* Infiltrability
-
– i = the infiltration rate when water is made freely available at a soil infiltrative surface (at the ground surface or within the subsurface)
-
-
-
-
• Infiltration of clean water into soil
-
○ Infiltration is affected by the rate of water addition and the hydraulic properties of the native soil profile
-
○ If the water delivery rate < the soil infiltrability
-
* IR is supply-controlled (a.k.a. flux controlled)
-
-
○ If the water delivery rate > the soil infiltrability
-
* IR is soil-controlled
-
– Surface controlled IR
-
e.g., by a surface crust
-
-
– Profile controlled IR
-
e.g., by layers with low permeability
-
-
-
-
○ Soil-controlled IR situations are illustrated in Fig. 11.7
Fig. 11.7 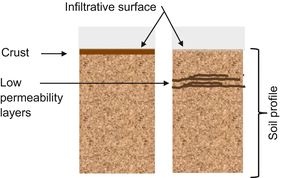
Illustration of two types of controls on infiltration rates into a soil profile
-
-
• Infiltration of clean water into soil where there is a crust
-
○ For a crust-topped soil, and steady infiltration, the IR can be soil-surface controlled but affected by a subcrust ‘soil suction’
-
○ A crust has a resistance to flow (RC) which determines the hydraulic conductivity of the crust (KC) (Fig. 11.8)
Fig. 11.8 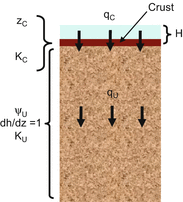
Definition schematic for infiltration into a crust-topped soil profile
-
○ Crust resistance can yield unsaturated water content in the soil under the crust
-
* Unsaturated soils have an unsaturated hydraulic conductivity (KU) which depends on the soil properties and the water content
-
* At a given water content, there is a ‘suction’ (Ψu) due to capillary action of the soil pores
-
-
○ With water ponding on top of the crust (H), flow through the crust (qC) is equal to flow in the unsaturated soil (qU) which reaches an equilibrium based on RC and ΨU (Eqs. 11.2 and 11.3)
$$ \begin{array}{l}{\mathrm{q}}_{\mathrm{C}}={\mathrm{K}}_{\mathrm{C}}{\left(\frac{\mathrm{dh}}{\mathrm{dz}}\right)}_{\mathrm{C}} \approx {\mathrm{q}}_{\mathrm{U}}={\mathrm{K}}_{\mathrm{U}}{\left(\frac{\mathrm{dh}}{\mathrm{dz}}\right)}_{\mathrm{U}}\end{array} $$(11.2,11.3)
-
-
• Infiltration of wastewater into a soil profile depends generally on the same factors that govern infiltration of clean water, but there are important differences in three areas
-
○ Potential presence of expandable clay minerals
-
* If a soil profile has expandable clay minerals (e.g., montmorillonite and bentonite) addition of water can cause swelling, loss in permeability, and a reduced KS
-
* Water chemistry interactions (e.g., Na+ cation exchange) can also cause dispersion of clays and reduce KS
-
* Both effects can reduce the infiltration capacity of the soil
-
* Sites with expandable clay minerals can be avoided
-
-
○ Potential damage caused during construction
-
* If construction is done poorly, soil compaction and smearing can cause soil pores to be blocked or sealed
-
* This can greatly reduce the infiltration capacity compared to that of undisturbed native soil
-
* Careful construction practices can mitigate this damage
-
-
○ Wastewater can induce changes as illustrated in Fig. 11.9
Fig. 11.9 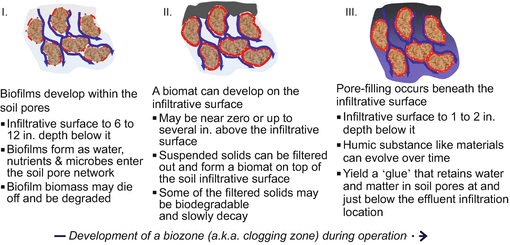
Illustration of effluent-induced effects on properties important to infiltration that result in formation of a biozone (a.k.a. clogging zone). Note: the nature and extent of the changes and effects illustrated depends on soil properties and site conditions as well as effluent composition and loading rate
-
-
• Infiltrability declines due to wastewater-induced effects
-
○ Concept of three phases and infiltrability declining over time to a low infiltration rate is illustrated in Fig. 11.10
Fig. 11.10 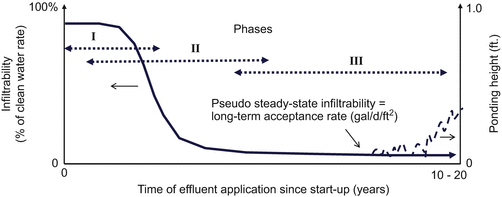
Illustration of how soil infiltrability declines during three phases due to soil clogging caused by application of domestic septic tank effluent to a soil infiltrative surface (Note: for other higher quality effluents the nature and extent of infiltrability decline can be less pronounced and take longer than shown in this figure.)
-
* Infiltrability declines due to soil clogging are caused primarily by a biomat (II) and pore-filling agents (III)
-
-
○ Infiltrability declines to a pseudo steady-state infiltrability that occurs after a period of operation when wastewater ponding just begins intermittently on the soil infiltrative surface
-
* This is defined as the long-term acceptance rate (LTAR)
-
-
○ With long-term operation, the infiltrability can decline to a LTAR that is less than the actual hydraulic loading rate (HLRA) being applied to the soil infiltrative surface
-
* Ponding of wastewater above the soil infiltrative surface can help drive infiltration and enable processing of the daily flow
-
* Continuous ponding on the soil infiltrative surface is not inherently a bad condition as long as the soil beneath it continues to be unsaturated and aerobic
-
-
-
• Key factors that affect infiltrability decline and the LTAR
-
○ Soil properties and site conditions —these are generally given
-
* Soil texture and structure at/near the soil infiltrative surface
-
* Soil profile lithology and hydrogeology
-
* Site climatic and hydrologic conditions
-
-
○ Design and operation —these are generally chosen
-
* Infiltrative surface architecture
-
– Infiltrative surface geometry and depth
-
– Infiltrative surface features
-
-
* Effluent application rate and method
-
– Hydraulic loading rate for design (HLRD) and hydraulic loading rate actually experienced during operation
-
– Frequency, uniformity, and continuity of wastewater application
-
-
* Effluent quality
-
– Concentrations of BOD, Kjeldahl N, and TSS
-
-
-
○ Effects of STU attributes on the LTAR are summarized in Table 11.4
Table 11.4 Relative effects of STU attributes on the LTAR for a given systema
-
-
• Effects on infiltrability—Wastewater composition
-
○ Infiltrability decline is most strongly impacted by wastewater HLR and composition
-
○ Equation 11.4 describes IR decline and Fig. 11.11 presents simulations showing the effects of HLR and composition
$$ \frac{{\mathrm{IR}}_{\mathrm{t}}}{{\mathrm{IR}}_{\mathrm{o}}}=\frac{exp\left[2.63-5.70\left(\mathrm{tBOD}\right)+41.08\left(\mathrm{T}\mathrm{S}\mathrm{S}\right)-0.048\left(\mathrm{tBOD}\times \mathrm{T}\mathrm{S}\mathrm{S}\right)\right]}{1+ exp\left[2.63-5.70\left(\mathrm{tBOD}\right)+41.08\left(\mathrm{T}\mathrm{S}\mathrm{S}\right)-0.048\left(\mathrm{tBOD}\times \mathrm{T}\mathrm{S}\mathrm{S}\right)\right]} $$(11.4)Fig. 11.11 Where:
-
IRt = infiltration rate after a period of operation (cm/day)
-
IRo = infiltration rate at startup (cm/day)
-
tBOD = cumulative mass loading of tBOD applied to the infiltrative surface after a period of operation (kg/m2)
= ultimate cBOD plus nBOD
-
TSS = cumulative mass loading of TSS applied to the infiltrative surface after a period of operation (kg/m2)
-
Source: Siegrist and Boyle 1987.
-
-
• Effects on infiltrability—Infiltrative surface architecture
-
○ Infiltrative surface architecture (ISA) can be a difficult concept to grasp but think of it as analogous to the architecture of a building
-
○ ISA applied to a STU includes physical attributes, primarily:
-
* Geometry of the infiltration trench or bed
-
– Infiltration through horizontal vs. vertical surfaces (e.g., bottom and sidewall in narrow trenches vs. bottom area in wider beds)
-
– Infiltrative surface depth below ground surface (e.g., shallow vs. deep trenches)
-
-
* Features of how the infiltrative surface is established
-
– Physical characteristics of the space through which wastewater influent moves once it is released from the delivery piping network and infiltrates into the native soil (e.g., gravel filled vs. chamber outfitted trenches)
-
-
-
○ ISA choices can affect infiltrability and the LTAR within a STU
-
* Narrow, low-profile trenches placed shallow in the soil profile benefit from higher porosity, organic matter, and subsurface aeration
-
* Open infiltrative surface areas (e.g., chamber-equipped and similar designs without buried stones or similar media (referred to as object laden surfaces)):
-
– Avoid compaction and fines from dirty gravel media
-
– Avoid pore entry blockage and embedment
-
– Enable inspection and maintenance as needed
-
-
* LTARs for open infiltrative surface areas:
-
– For STE and similar primary quality effluents
-
LTAR for open surface > object laden surface
-
-
– For PMB effluent and similar higher quality effluents
-
LTARs for open surface ≅ object laden surface
-
-
-
-
-
• Percolation of wastewater through an unsaturated soil profile
-
○ Wastewater that infiltrates into the soil below a soil infiltrative surface percolates downward by gravity forces
-
* Due to soil clogging, unsaturated flow typically occurs and the rate of vertical water movement can be described by Eq. 11.3
$$ {\mathrm{q}}_{\mathrm{u}} = \kern0.5em {\mathrm{K}}_{\mathrm{u}}\ {\left(\frac{\mathrm{dh}}{\mathrm{dz}}\right)}_{\mathrm{u}} $$(11.3)Where:
-
qu = rate of water movement in unsaturated soil (ft/day)
-
Ku = unsaturated soil hydraulic conductivity (ft/day)
(Ku depends on the soil texture and water content)
-
dh/dz = hydraulic gradient (−) (typ. 1)
-
-
-
○ Depending on subsurface conditions, a portion of the infiltrated wastewater may move laterally and upward based on differences in water content and capillary forces in the soil
-
-
• Wastewater transitions to a reclaimed water
-
○ Wastewater influent that percolates downward is gradually transformed to a reclaimed water as constituents in the wastewater are transformed and removed within the soil profile
-
○ The reclaimed water typically recharges local groundwater under the site where wastewater infiltration occurs
-
○ The reclaimed water can undergo further treatment by attenuation processes that can occur in the deeper vadose zone and in the groundwater as it migrates away from the site
-
-
-
■ Pollutant and pathogen transformation and removal
-
• Many of the key processes in a subsurface STU are analogous to those in a single-pass sand filter (SPSF)
-
• However, the processes in a STU can be more complex and dynamic than those in a SPSF because:
-
○ Soil has more dynamic properties and heterogeneities that affect water movement and treatment
-
○ A STU “lives” in the natural environment and is connected to groundwater and surface waters which can help attenuate constituents of concern and assimilate reclaimed water
-
-
• Conceptually, removal processes in a STU occur in several zones encompassing wastewater infiltration, soil percolation, groundwater recharge and transport, and discharge to a surface water (Fig. 11.12)
Fig. 11.12 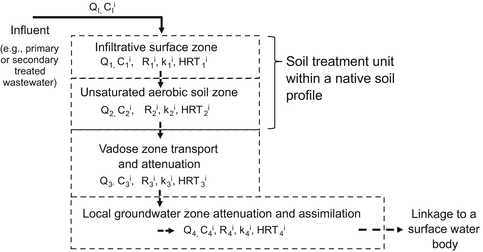
Illustration of pollutant and pathogen removal occurring through processes in several zones within and around a STU (after Siegrist 2014) (Note: QI = influent flow rate tothe STU, CI i = influent concentration, R = reaction in a zone, k = reaction rate, HRT = retention time, Q = flow rate and C = concentration leaving the zone, where the subscript (e.g., 1) designates a zone and the superscript (i.e., i) designates a constituent.)
-
• General attributes of a native soil profile important to treatment
-
○ Suitable saturated hydraulic conductivity (KS) for water movement
-
* Not too slow: e.g., KS >1–2 gal/day/ft2
-
* Not too fast: e.g., KS <100–200 gal/day/ft2
-
-
○ Adequate unsaturated soil profile depth
-
* Depending on wastewater HLR and composition, 2–4 ft of unsaturated soil is typically sufficient
-
-
○ Conditions conducive to removal of pollutants and pathogens
-
* Unsaturated aerobic soil with film flow over soil grains and long travel times for kinetic processes (e.g., BOD and NH4 + removal, virus inactivation)
-
* Adequate volume of soil to provide grain surface area for biofilms and sorption reactions (e.g., P removal)
-
* Properties conducive to treatment (e.g., circumneutral pH, high Eh, moderate temperatures, no biotoxins)
-
-
-
• At a site with generally suitable soil profile conditions, design factors affect treatment by determining the types and rates of reactions (k) plus the hydraulic retention time (HRT)
-
○ Wastewater HLR and composition
-
* HLR and composition can affect infiltrability, which can affect uniformity of infiltration and the HRT in a soil profile
-
-
○ Method of wastewater delivery and uniformity of application
-
* The application method can affect uniformity of infiltration, unsaturated flow conditions, and the HRT
-
-
○ Infiltration depth and unsaturated soil properties
-
* Depth affects aeration and plant-based processes
-
* Unsaturated soil thickness affects aeration and HRT
-
* Soil properties can affect wastewater movement and reaction types and rates (e.g., pH, Eh, mineralogy, natural organic matter content)
-
-
-
• Treatment of constituents often occurs by kinetic reactions
-
○ A very simplified estimate of removal for BOD as an example can be made assuming uniform unsaturated flow and 1st-order kinetics (Eqs. 11.5 and 11.6) (Fig.11.13)
Fig. 11.13 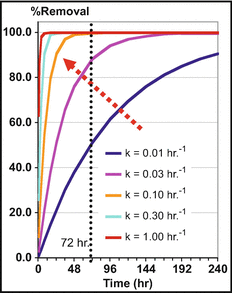
Illustration of removal efficiencies as a function of 1st-order rate constants under example conditions during subsurface soil infiltration (HLR = 1 gal/day/ft2, soil profile travel distance = 2 ft with ne = 0.2, HRT = 72 h) (after Siegrist 2007)
-
○ For some constituents and conditions a more complex model is required to properly capture the flow and transport processes involved in treatment (e.g., STUMOD or Hydrus 2D)
$$ {\mathrm{R}}_{\mathrm{E}}=\left(1-{\mathrm{e}}^{-\mathrm{k}\mathrm{t}}\right)\times 100\% $$(11.5)$$ \mathrm{t}=\mathrm{H}\mathrm{R}\mathrm{T}=\frac{\left({\mathrm{d}}_{\mathrm{u}}\right)\left({\mathrm{n}}_{\mathrm{e}}\right)}{\mathrm{HLR}} $$(11.6)Where:
-
RE = removal efficiency (%)
-
k = 1st-order reaction rate (h−1)
k: BOD = 0.04–0.09; NH4 + = 0.4–0.9; Fecal coli. = 0.1–0.3
-
HRT = hydraulic retention time for removal reaction (h)
-
du = unsaturated soil depth (ft)
-
ne = effective porosity (v/v)
-
HLR = hydraulic loading rate (ft/h)
Source: after Siegrist 2007.
-
-
○ Effects of temperature on reaction rates
-
* Temperature affects the rates of processes during biological treatment
-
* Temperature effects on biological reaction rate constants can be significant and are expressed by Eq. 11.7
$$ {\mathrm{k}}_{\mathrm{T}} = {\mathrm{k}}_{20}{\uptheta}^{\left(\mathrm{T}-20\right)} $$(11.7)Where:
-
kT = reaction rate at temperature, T (°C)
-
k20 = reaction rate at 20 °C
-
T = temperature (°C)
-
θ = temperature activity coefficient (−)In activated sludge biological systems, θ for BOD removal can be about 1.02–1.06 and some adopt values in this range for use with subsurface soil infiltration
-
-
-
-
• Treatment effects—Uniformity of infiltration
-
○ Infiltration—by engineered distribution or due to soil clogging—affects the IR, HRT and treatment efficiency (Fig. 11.14)
Fig. 11.14 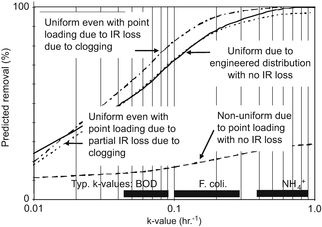
Illustration of the purification effects of uniformity of infiltration which impacts the HRT in the soil (after Ausland 1998) (Note: removal predicted using Eq. 11.5 with HRT values determined by tracer testing during application of 2.4 gal/day/ft2 through 3 ft of sand (d50 = 0.86 mm))
-
-
• Treatment effects—Unsaturated soil thickness
-
○ The thickness of the unsaturated soil beneath the soil infiltrative surface (dU) impacts HRT, which affects the removal efficiency achieved by kinetic reactions (e.g., BOD removal)
-
* dU also impacts the extent of wastewater contact with soil grain surface areas, which impacts sorption (e.g., P removal)
-
-
○ Wastewater infiltration can change the unsaturated soil thickness by causing:
-
* A perched zone of saturation above a low permeability layer in the soil profile or mounding of a local groundwater table
-
-
○ For STUs handling larger flows, the hydrologic effects of wastewater application on dU must be carefully considered
-
○ Unsaturated soil thickness is normally assessed through a site investigation and during design (discussion to follow)
-
-
• Treatment effects—Layering in the soil profile
-
○ If there are layers in a soil profile with different grain size properties, contrasting KS values and capillary forces can cause saturation at the boundary, e.g.:
-
* Sandy loam over a coarse sand—saturation can occur in the finer grained sandy loam (lower KS and higher ΨU)
-
* Coarse sand over sandy loam—saturation can occur in the coarse sand (higher KS compared to sandy loam)
-
-
○ Depending on conditions, layering can cause a sequence of aerobic and anaerobic zones in a soil profile
-
* This can be important to removal of pollutants that benefit from aerobic conditions followed by anaerobic conditions
-
* For example, nitrification can occur in an aerobic zone and denitrification can occur in an underlying anaerobic zone
-
-
-
• Treatment effects —Presence of rock fragments
-
○ Rock fragments (>2-mm diam.) within a soil profile occupy volume and can have varied effects on water movement and treatment processes (Fig. 11.15)
Fig. 11.15 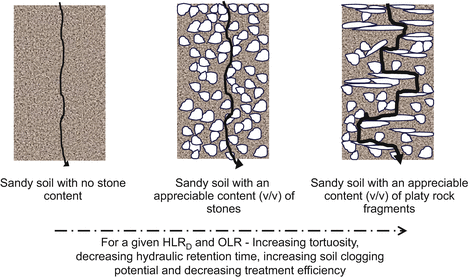
Illustration of rock fragments and potential effects on tortuosity and water movement, hydraulic retention time, soil clogging potential, and treatment efficiency
-
* A reduction in the bulk soil porosity can lead to an increased water-filled porosity and reduced aeration
-
* A reduced porosity can increase the rate of water movement, which can reduce the HRT and treatment achieved in a given depth interval
-
-
○ Reduction in treatment capacity due to rock fragments?
-
* For treatment of domestic STE, it is reasonable to limit the volume occupied by stones (>2-mm diameter) to < 35 % of the bulk volume
-
* For profiles with 35–60 % by volume, it is advised to use a buried sand filter design or provide a higher degree of treatment prior to discharge to the soil (e.g., secondary rather than primary)
-
-
-
-
■ Attenuation and assimilation in the subsurface
-
• Percolate from a STU commonly recharges groundwater
-
○ Groundwater is typically flowing in some direction toward a surface water (e.g., stream, lake, estuary)
-
-
• Recharge can cause a plume of affected groundwater
-
○ This plume can migrate for a short (10 s of ft) or long (100 s of ft or more) distance away from the location of the STU
-
* At some location the plume dissipates sufficiently that it is no longer distinguishable from unaffected local groundwater
-
* The extent of an identifiable plume depends on aquifer thickness, flow velocity, and biogeochemical conditions
-
-
○ The plume may or may not be a concern re: water quality deterioration and risk
-
-
• A schematic illustration of attenuation and assimilation under and away from a STU is shown in Fig. 11.16
Fig. 11.16 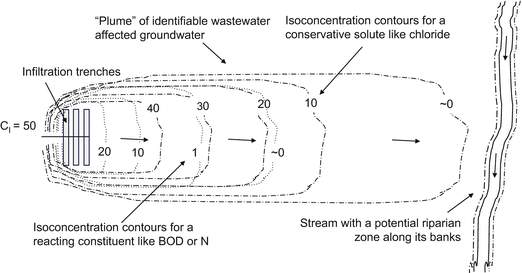
Plan view illustration of a STU and a constituent plume , the nature and extent of which depends on subsurface conditions and the constituent attenuation and assimilation under and away from the location of infiltration
-


11.1.1.4 11-4. Design and Implementation
-
■ Considerations for design and implementation (D&I) of a soil treatment unit to achieve tertiary treatment and natural disinfection
-
• Treatment goals and method of assessment
-
• Site evaluation and suitability assessment
-
• Treatment options prior to wastewater application to the soil
-
• Infiltrative surface architecture
-
• Wastewater application rates for infiltration area sizing
-
• Depth of soil required beneath the infiltrative surface
-
• Landscape placement and layout
-
• Effluent delivery and distribution, resting and cyclic loading
-
• Design for long-term service
-
• Installation and startup, operation and maintenance, monitoring
-
• Overcoming site limitations and use of design variants
-
• Modeling tools for system design and assessment
-
-
■ D&I considerations—Treatment goals and assessment
-
• For a STU, treatment goals can be set in different ways
-
○ It depends on how and where boundaries and points of compliance are set or required
-
○ Treatment goals can include the performance of the STU alone (based on boundaries defined) or include the attenuation within the deeper vadose zone and receiving groundwater, e.g.:
-
* NO3─N concentrations will be <10 mg-N/L when the reclaimed water reaches the groundwater table, or
-
* NO3─N concentrations in groundwater at the property boundary will be <10 mg-N/L
-
-
-
• Assessments can be done a priori or after operation startup
-
○ Predictions can be made using modeling tools (e.g., STUMOD)
-
○ Monitoring can be carried out after system startup
-
-
• Assessment of treatment efficiency and achievement of treatment goals requires boundaries and points of compliance as illustrated in Figs. 11.17 and 11.18
Fig. 11.17 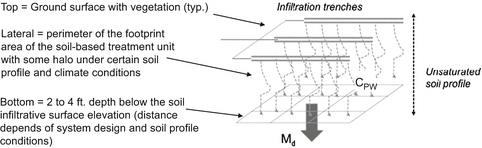
Illustration of one approach to setting boundaries for the top, bottom, and lateral planes associated with treatment within a STU
Fig. 11.18 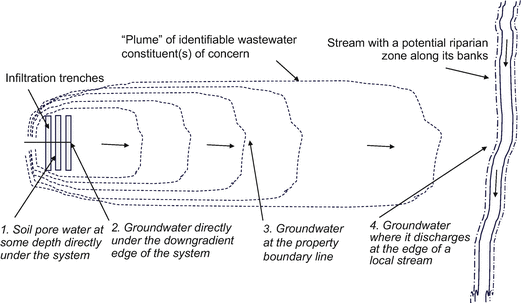
Plan view illustration of a STU and four potential points of compliance that might be used to assess achievement of a treatment goal
-
• Assessment of treatment efficiency requires data for concentration (CPW or CGW) or mass discharge (Md) as illustrated in Fig. 11.19
Fig. 11.19 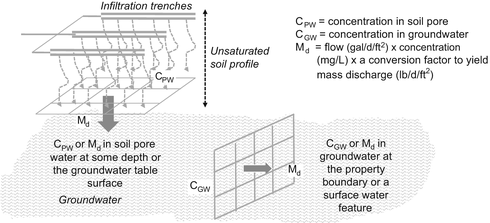
Treatment performance can be assessed using a mass discharge approach or one that assesses changes in concentrations (Note: you can model and predict CPW, CGW or Md or you can use monitoring data to estimate these parameters)
-
• Mathematical models can help assess treatment efficiency for different STU designs and environmental settings
-
○ STUMOD is a spreadsheet-based analytical model that was initially developed to simulate nitrogen concentrations or mass flux with depth under a soil infiltrative surface (Geza et al. 2009, 2014)
-
* Figure 11.20 presents simulation results for a current version of STUMOD and an example set of conditions
Fig. 11.20 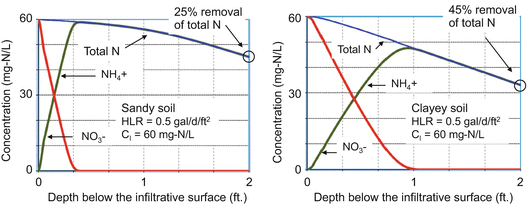
Example outputs from simulations completed with STUMOD to predict nitrogen concentrations with depth below the infiltrative surface for a STU installed in sandy versus clayey soils (Geza et al. 2014) (Note: the removal of total nitrogen is predicted by 2 ft depth to be 45 % in clayey soilds compared to 25 % in sandy soils due to a higher denitrification rate in the higher water content clayey soils)
-
* Recent refinements to STUMOD have focused on including evapotranspiration and plant uptake and nitrogen transport and fate in an underlying groundwater system
-
* Future plans are to extend STUMOD so it can simulate transport and fate of other wastewater pollutants and pathogens and to generate generalized export coefficients for catchments that can be used in watershed scale assessment and modeling
-
-
-
-
■ D&I considerations—Evaluation of site suitability
-
• Components of a typical site evaluation appear in Table 11.5
Table 11.5 Typical components of a site evaluation used for assessing suitability for a STU -
• Key methods used during a site evaluation commonly include:
-
○ Review of existing information
-
* e.g., land use, topographic maps, environmental reports, Web Soil Survey, etc.
-
-
○ Site characterization field observations along with sampling and lab analyses to determine:
-
* Available landscape area, topography, drainage features, etc.
-
* Soil profile morphology and soil properties
-
– Hydraulic properties (e.g., layering, texture, structure, color, etc.)
-
– Treatment properties (e.g., mineralogy, aeration status, etc.)
-
-
-
○ Larger systems require very careful evaluation of a site’s overall “assimilative capacity” for water, pollutants and pathogens
-
-
• Site suitability is judged based on comparison of the site evaluation results against a set of requirements (e.g., Table 11.6)
Table 11.6 Example requirements for judging the suitability of a site for a STU
-
-
■ D&I considerations—Treatment prior to the STU
-
• At a minimum, primary or advanced primary treatment of wastewater using a septic tank or similar unit is needed
-
• Secondary treatment (e.g., using an aerobic unit or porous media biofilter) can be warranted to enable soil-based treatment in otherwise challenging sites, such as where:
-
○ Subsurface soils have a low KS and reduced aeration
-
○ Subsurface soils have a high KS and a low HRT
-
○ Limited land area requires a higher HLRD
-
-
• Tertiary treatment using a membrane bioreactor or similar technology may be warranted in some areas, for example:
-
○ To enable a very high HLRD to a small footprint STU in a high density development
-
○ To enable use of a STU for commercial applications in locations with sensitive water quality conditions
-
-
• Classification of wastewater effluents applied to STUs
-
○ Classification can be based on composition characteristics that control infiltrability and are also important to treatment efficiency
-
○ An effluent classification scheme, first proposed by Siegrist in 2006, is given in Table 11.7
Table 11.7 Classification scheme for the effluents applied to a STU (Siegrist 2014) -
○ An effluent classification scheme published in regulations adopted in Colorado in 2013 is shown in Table 11.8
Table 11.8 Example treatment level classification scheme prescribed in Colorado for effluents applied to a STU (CDPHE 2013)
-
-
-
■ D&I considerations—Infiltrative surface architecture
-
• A soil infiltrative surface can be established in the subsurface with a horizontal or vertical orientation within one or more excavated trenches or beds
-
• In general, narrow trenches with short sidewall heights that are placed just below the ground surface are preferred for several reasons
-
○ Shallow depth below ground surface—the infiltrative surface is located in a more biogeochemically active depth zone
-
○ Narrow width and short height—the path length for oxygen transport from the atmosphere to the infiltrative surface is shortened leading to better re-aeration of the soil beneath and around the STU (Fig. 11.21)
Fig. 11.21 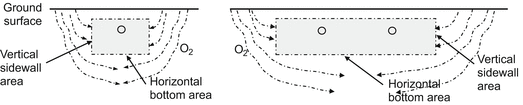
Cross-section view of a trench (left) versus bed (right) geometry illustrating horizontal bottom area versus vertical sidewall area for infiltration
-
○ Narrow width—The risk of damage caused during construction is lessoned since heavy equipment does not have to operate on the soil infiltrative surface and there is typically more sidewall as a reserve area for infiltration
-
-
• Soil infiltrative surface orientation (Fig. 11.21)
-
○ At startup, only the horizontal infiltrative surface is used
-
○ With operation, the HLR can exceed the infiltrability of the horizontal infiltrative surface and ponding may develop
-
* With ponding, infiltration also occurs through the vertical sidewall area
-
* As biomat development and pore-filling evolves, ponding depth can increase and more vertical sidewall area is used
-
-
○ Sizing based on bottom area alone leaves the sidewall area to provide extra infiltrative surface area as needed
-
-
• Geometry of trenches and beds
-
○ Suggested trench dimensions
-
* Width ≤ 3 ft, Height (sidewall) < 2 ft, Length < 100 ft.
-
-
○ Suggested bed dimensions
-
* Width ≤ 12 ft, Height (sidewall) < 2 ft, Length < 100 ft.
-
-
○ Avoid wide beds, especially for primary treated wastewaters which have high O2 demands due to high BOD and NH4 + levels
-
-
• Placement of the soil infiltrative surface
-
○ Suggested placement of the horizontal infiltrative surface at 1–3 ft bgs
-
* Deeper placement can be considered for some sites
-
– e.g., profile layering might be conducive to infiltration below a shallow low permeability layer
-
-
-
○ Placement needs to provide adequate unsaturated soil depth below the infiltrative surface to a limiting condition
-
* If site conditions warrant it, a STU can be established at grade or in a mound of fill sand (discussed later)
-
-
-
• Use of bigger beds under special circumstances
-
○ Trenches are generally preferred but they can have practical disadvantages or be infeasible due to land area constraints
-
* Trenches require more landscape footprint area for a given horizontal infiltrative surface area
-
* Trenches can take more time for installation
-
-
○ Bed geometries that have widths greater than 12 ft can be appropriate for some applications
-
* With secondary and tertiary effluents where O2 demands are very low and soil clogging is very limited
-
* Where only part of the horizontal surface within the bed is used to provide a soil infiltrative surface—e.g., with chambers placed on the bottom of the bed with unused area as spacing between adjacent chambers
-
-
○ Installation of bigger wider beds must be done very carefully to avoid construction damage to the soil infiltrative surface
-
-
• Infiltrative surface features
-
○ Various options have been used to establish a soil infiltrative surface to which treated wastewater effluent can be applied
-
○ Gravel was widely used in the past since it was locally available and relatively inexpensive
-
○ But in the late 1900s, research findings revealed several potential negative aspects of using gravel for establishing an infiltrative surface, including:
-
* Gravel can cause soil compaction when dumped onto a soil infiltrative surface
-
* Fines can be washed off gravel and cause soil clogging
-
* Gravel can mask soil pore entries and get embedded into a gravel-soil zone with a lower KS and higher clogging potential
-
* There can be life-cycle costs due to excavation, processing, and hauling gravel from a quarry to a project site
-
-
○ Alternative aggregate materials emerged
-
* Alternatives included lightweight expanded clay aggregate, glass fragments, shredded tire chips, or bundled plastic beads
-
* These media were lighter than gravel, did not cause compaction, did not have fines and in some cases were made from recycled materials
-
-
○ Manufactured products were also developed
-
* Chambers were developed to use in place of aggregate
-
* Chambers eliminate the issue with gravel compaction and fines, but also avoid pore entry blockage and embedment, and enable inspection and maintenance of the infiltrative surface
-
-
○ Table 11.9 highlights the features of two contrasting options—gravel-filled versus chamber-equipped
Table 11.9 Examples of two contrasting methods to enable access to a below-ground soil infiltrative surface a
-
-
-
■ D&I considerations—Design hydraulic loading rate
-
• Design hydraulic loading rates are set to account for:
-
○ Hydraulic considerations—Need for long-term infiltration and processing of the wastewater effluent applied to the soil
-
○ Treatment considerations—Need for treatment to remove pollutants and pathogens to an acceptable level
-
-
• Design hydraulic loading rates are normally controlled by hydraulic considerations and the need to manage soil clogging
-
○ Hydraulic loading rate for design
-
* HLRD = design hydraulic loading rate based on soil classification and effluent quality with adjustments for design attributes and soil clogging processes
-
-
○ Long-term acceptance rate
-
* LTAR = infiltrability that exists after a period of operation but prior to the development of continuous ponding
-
-
-
• Selection of a HLRD for a particular site and STU design
-
○ The HLRD is not just an inherent property of a soil profile, but is “system conditional” and depends on soil and site conditions but also wastewater composition, STU design features, operation, etc.
-
○ HLRD is normally set based on soil clogging and infiltrability considerations
-
* Higher HLRD can be used for higher quality effluents
-
* But, even for high quality effluents, the HLRD should be ≤ 5–10 % of the KS in the depth interval of the infiltrative surface to help maintain unsaturated aerobic conditions
-
-
○ In addition, the HLRD must not exceed the hydraulic and treatment capacity of the entire soil profile and site
-
* The HLRD can not cause excessive groundwater mounding on potential low KS zones or a shallow groundwater table
-
* The HLRD needs to provide an adequate HRT for treatment
-
-
○ The value of HLRD is typically limited to a fraction of the native soil KS
-
* Benefits of setting HLRD < < KS (Eq. 11.7)
-
– Provides unsaturated flow in the soil profile which aids treatment: soil profile aeration can occur, wastewater flows in films over biofilm coated soil particles, and wastewater remains in the soil profile for a long HRT
-
– Accounts for the loss in infiltrability during operation
-
– Ensures that the HLRD can be processed over the design lifetime
$$ \mathrm{H}\mathrm{L}{\mathrm{R}}_{\mathrm{D}}\le \mathrm{F}\times {\mathrm{K}}_{\mathrm{S}} $$(11.7)Where:
-
HLRD = hydraulic loading rate used in design (gal/day/ft2)
-
F = factor to account for long-term wastewater infiltration
e.g., F = 0.05 for STE and up to F = 0.10 for MBR effluent
-
KS = saturated hydraulic conductivity of the native soil (gal/day/ft2)
-
-
-
-
-
• Setting a HLRD—a simplified approach
-
○ Soil profile conditions can be classified as shown in Table 11.10
Table 11.10 Example classification scheme for soil profiles (Siegrist 2006) -
* Based on hydraulic and purification processes, consider three major soil classes with different representative KS
-
* Exclude soil profiles with KS values that are too high or too low unless design modifications are made
-
-
○ Selection of a baseline HLR
-
-
-
■ D&I considerations—Infiltrative surface area required
-
• Once the HLRD is chosen for a given STU design, the infiltrative surface area can be determined using Eqs. 11.8 or 11.9
$$ {\mathrm{A}}_{\mathrm{IS}}=\left[\frac{{\mathrm{Q}}_{\mathrm{D}}}{\mathrm{HL}{\mathrm{R}}_{\mathrm{D}}}\right]\kern0.5em \left(\frac{1}{\mathrm{EF}}\right) $$(11.8)$$ {\mathrm{A}}_{\mathrm{IS}}=\left[\frac{{\mathrm{Q}}_{\mathrm{D}}}{\mathrm{HL}{\mathrm{R}}_{\mathrm{D}}}\right]\kern0.5em \left(\mathrm{A}\mathrm{F}\right) $$(11.9)Where:
-
AIS = area of the soil infiltrative surface (ft2)
-
QD = design daily flow (gal/day)
-
HLRD = design hydraulic loading rate (gal/day/ft2) (Tables 11.11 or 11.12)
-
EF = infiltration efficiency factor = ƒ (design, construction, operation) (−)
-
AF = area adjustment factor = ƒ (design, construction, operation) (−)
-
○ Efficiency Factors (EF) can be used to account for the infiltration effects of design, construction, and operation (Table 11.13)
-
○ Area Adjustment Factors (AF) can be used instead of EF (Table 11.14)
Table 11.14 Examples of Area Adjustment Factors used to adjust the area of the soil infiltrative surface required (CDPHE 2013)
-
-
• Example infiltrative surface areas for different site conditions and design choices are shown in Table 11.15
Table 11.15 Infiltrative surface areas required to handle a design flow of 1000 gal/day for different example site conditions and design choices -
• With the area determined based on the HLRD, the organic loading rate needs to be checked using Eq. 11.10
-
○ If the OLR is too high, anoxic or anaerobic conditions may develop in the soil profile under the soil infiltrative surface
-
○ Suggested OLR limits are shown in Table 11.16
Table 11.16 Organic loading rates to a soil infiltrative surface -
* If the OLR is too high, additional AIS is required or treatment must reduce the BOD5 applied to the STU
$$ \mathrm{O}\mathrm{L}\mathrm{R}=\frac{\left({\mathrm{Q}}_{\mathrm{D}}\right)\left(\mathrm{BO}{\mathrm{D}}_5\right)\left(\mathrm{F}\right)}{{\mathrm{A}}_{\mathrm{IS}}^{\prime }} $$(11.10)Where:
-
A′IS = area of horizontal soil infiltrative surface provided based on the STU layout (ft2) (see Eq. 11.11) (Note: A’IS will be ≅ AIS)
-
QD = design daily flow (gal/day) (e.g., typ. QA × PF, with PF = 1.5)
-
HLRD = design hydraulic loading rate (gal/day/ft2)
-
OLR = organic loading rate (lb-BOD5/day per ft2); suggested OLR limits: Class I soil = 0.001; Class II soil = 0.0005, Class III soil = 0.0002
-
BOD5 = Influent BOD5 (mg/L)
-
F = 8.34 × 10−6 = conversion factor for mg/L to lb/gal
-
-
-
-
■ D&I considerations—Unsaturated soil thickness needed
-
• Minimum depth to a limiting condition (e.g., groundwater, bedrock) accounting for capillary rise and preferential flow
-
○ Type I to III effluents in coarse grained Class I soils: > 2 ft.
-
○ Type I to III effluents in structured Class II and III soils: > 3 ft.
-
-
• Depth requirements for special conditions
-
○ For larger systems and sites with low assimilative capacity for reclaimed water recharge into the local groundwater
-
* Need to consider and evaluate water mounding potential
-
-
○ For higher strength wastewater effluents where Type I effluent may not be reliably achieved, or where certain pollutants may still be at unusually high levels (e.g., N)
-
* Need to evaluate need for higher treatment prior to the STU and/or a greater thickness of unsaturated soil
-
-
-
-
■ D&I considerations—Landscape placement and layout
-
• A STU should be placed in well-drained, upslope locations within reasonable proximity to the pre-STU treatment units
-
• Infiltration trenches or beds should be oriented along landscape contours (Fig. 11.22)
Fig. 11.22 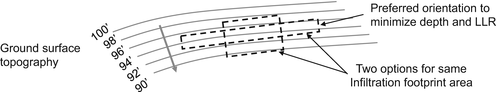
Illustration of the preferred orientation of a STU on a sloping site
-
○ Enables the soil infiltrative surface to be placed shallow
-
○ Minimizes linear-loading rates (LLR) and reduces groundwater perching or mounding effects on unsaturated soil thickness
-
* LLR = gal/day per ft of STU length along the slope
-
-
-
• Layout of trenches or narrow beds
-
○ Based on the AIS required and the landscape features, the details of the layout for the STU need to be determined
-
* A layout needs to be designed with consideration of effluent delivery and distribution options
-
* The width of a trench (e.g., 2 ft) or narrow bed (e.g., 10 ft) and the length (e.g., 50 ft) need to be selected
-
– Figure 11.23 shows 2 layout options for the same AIS
Fig. 11.23 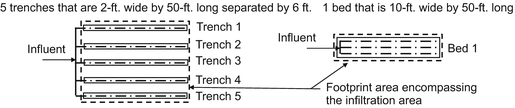
Illustration of a trench layout versus a bed layout , both of which provide the same horizontal infiltrative surface area
-
-
-
○ Based on the geometry and general layout chosen, the length and number of infiltration units can be determined using Eqs. 11.11 and 11.12
-
* Then a specific layout with dimensions can be determined and the infiltrative surface can be calculated (Eq. 11.13)
$$ {\mathrm{L}}_{\mathrm{T}}=\left(\frac{{\mathrm{A}}_{\mathrm{I}\mathrm{S}}}{{\mathrm{W}}_{\mathrm{I}}}\right) $$(11.11)$$ \mathrm{n}=\left(\frac{{\mathrm{L}}_{\mathrm{T}}}{{\mathrm{L}}_{\mathrm{I}}}\right) $$(11.12)$$ {\mathrm{A}}_{\mathrm{I}\mathrm{S}}^{\prime }=\mathrm{n}\left({\mathrm{L}}_{\mathrm{I}}\times {\mathrm{W}}_{\mathrm{I}}\right) $$(11.13)Where:
-
LT = total length of trenches or narrow beds required at the selected width (ft)
-
AIS = infiltrative surface area required within the infiltration unit (ft2)
-
A′IS = infiltrative surface area provided based on the final layout (ft2)
-
WI = width of an individual trench or narrow bed (ft)
-
LI = length of an individual trench or bed (ft)
-
n = number of narrow trenches or beds (−) (to be assembled in a layout)
-
-
-
-
• The landscape footprint area (AF)
-
○ The AF required includes AIS plus any land between adjacent infiltration units (Fig. 11.24)
Fig. 11.24 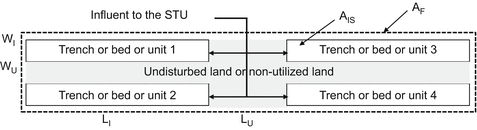
Illustration of the footprint area required for a set of trenches or narrow beds or a set of separated chambers placed within a larger bed
-
* Undisturbed land enables construction without driving heavy equipment on the infiltrative surface and also provides for soil aerationd
-
* Typically, undisturbed land between adjacent trenches or narrow beds is equal to a % of the trench or bed width
-
d Note: If a larger bed is used with multiple infiltration chambers or units placed within it, separation between adjacent chambers or units (i.e., non-utilized land) can provide for soil re-aeration.
-
-
○ For simple layouts with one or more zones along the contour (e.g. Fig. 11.22), the landscape footprint area required can be calculated using Eq. 11.14
-
○ For more complicated layouts, geometry computations for the specific layout are required
$$ \begin{array}{l}{\mathrm{A}}_{\mathrm{F}}=\left(\mathrm{y}\right)\left[\left({\mathrm{L}}_{\mathrm{I}}\right)\left({\mathrm{W}}_{\mathrm{I}}\right)\left(\mathrm{n}\right)+\left({\mathrm{L}}_{\mathrm{I}}\right)\left({\mathrm{W}}_{\mathrm{U}}\right)\left(\mathrm{n}-1\right)\right]+\\ {}\kern2em \left(\mathrm{y}-1\right)\left[\left({\mathrm{L}}_{\mathrm{U}}\right){\left(\mathrm{W}\right)}_{\mathrm{I}}\left(\mathrm{n}\right)+\left({\mathrm{L}}_{\mathrm{U}}\right)\left({\mathrm{W}}_{\mathrm{U}}\right)\left(\mathrm{n}-1\right)\right]\end{array} $$(11.14)Where:
-
AF = landscape footprint area of the entire STU (ft2)
-
LI = length of the trench or narrow bed or other infiltration unit (ft)
-
WI = width of the trench or narrow bed or other infiltration unit (ft)
-
n = number of trenches or narrow beds or other infiltration units (-)
-
y = number of zones with trenches or narrow beds or other infiltration units (−)
-
LU = length of the undisturbed land between adjacent zones (ft)
-
WU = width of the undisturbed land between each trench or bed or chamber (ft)
-
-
-
-
■ D&I considerations—Influent delivery and distribution
-
• Delivery and distribution of wastewater (e.g., STE) to a STU is very important to the performance achieved in the STU
-
• Delivery methods transport the effluent from a pre-STU treatment unit (e.g., ST, PMB, etc.) to the site of the STU (Table 11.17)
Table 11.17 Example approaches for wastewater delivery and distribution to a STUa -
○ Delivery methods can include:
-
* Semi-continuous trickle flow under gravity
-
* Intermittent dosing under pressurized flow
-
– Based on a timer (timed dosing)
-
– Based on wastewater generation (demand dosing)
-
-
-
○ Distribution methods that disperse the influent to the STU over the design soil infiltrative surface area can include:
-
* Gravity flow in larger diameter perforated piping
-
* Pressurized flow in small diameter piping networks
-
-
-
• Infiltrative surface utilization during startup and early operation
-
○ Based on the methods used (Table 11.17), during startup and early operation, the infiltrative surface utilization (ISU) in a STU is less than the entire surface area provided by design
-
○ Localized overloading occurs to some degree
-
* For domestic STE, actual HLRs to localized areas in some STU designs can be up to 30× the HLRD
-
* Localized overloading leads to accelerated soil clogging
-
* As soil clogging develops, wastewater influent spreads laterally until sufficient infiltrative area can process the daily loading
-
-
○ Progressive soil clogging leads to an ISU equal to design
-
* Months to years may pass before achieving uniform distribution to the design soil infiltrative surface area
-
* Non-uniformity can be prolonged when higher quality effluents are applied using delivery and distribution designs that do not achieve uniform application
-
-
-
• In general, dosing with pressure distribution is preferred
-
○ An example distribution layout is illustrated in Fig. 11.25
Fig. 11.25 
Illustration of the layout and components of a dosing and pressurized distribution network for wastewater application to a set of subsurface infiltration trenches
-
○ Dosing can be beneficial to treatment in all STUs by allowing alternating loading and resting
-
* Enables drainage and re-aeration of the soil profile
-
* Suggested dosing frequencies depend on soil properties
-
– Coarse grained, fast-draining soils (e.g., Class I): >4/day
-
– Fine grained, slowly-draining soil (e.g., Class III): <2/day
-
-
-
○ Pressure distribution can help achieve more uniform distribution to the design soil infiltrative surface area
-
* Benefits overall performance with respect to hydraulic and treatment processes
-
-
○ For secondary and higher quality effluents (e.g., Type II, III), dosing and pressure distribution is essential to achieve a high ISU and a desired treatment efficiency in a STU since soil clogging may be retarded or nearly absent
-
-
• Micro-dosing and pressure distribution approaches
-
○ Some sites have treatment limitations
-
* For example, sites where there are soils with very high KS and inadequate unsaturated soil thickness, or shallow groundwater with nearby drinking water wells
-
-
○ Pressurized delivery and micro-dosing can help achieve highly uniform distribution and unsaturated flow conditions
-
* Pressurized distribution networks can use spray nozzles (Fig. 11.26) or drip dispersal tubing (see Chap. 12)
Fig. 11.26 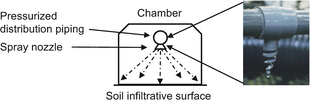
Illustration of wastewater delivery and distribution using spray nozzles on pressurized distribution piping within a chamber-equipped trench
-
* Micro-dosing can deliver several to many timed doses distributed uniformly during the day (e.g., 4–12/day)
-
-
-
• Pressurized delivery can also be used for dosing and distribution to zones within a larger STU
-
○ Figure 11.27 illustrates the use of distributor valves
Fig. 11.27 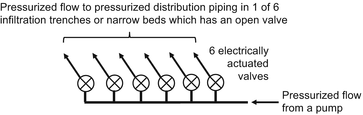
Pressurized delivery and uniform distribution sequentially to different trenches or beds can be accomplished with electric or hydraulically actuated distributor valves
-
* In this example, distributor valves are used to distribute flow between 6 zones of a STU by directing each sequential dose to 1 of the 6 zones
-
* Each zone uses pressurized delivery and distribution within it
-
-
○ Figure 11.28 illustrates the use of a pressurized hydrosplitter
Fig. 11.28 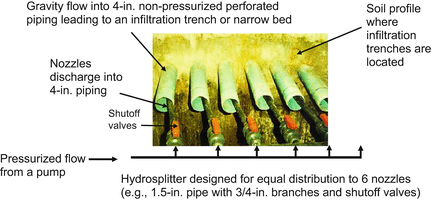
Use of a hydrosplitter to achieve pressurized delivery of a dose into gravity flow distribution pipes connected to different trenches or narrow beds
-
* Hydraulic design to distribute flow during a dose between 6 zones of a STU with gravity delivery and distribution in each of the 6 zones
-
-
-
• Design of dosing and pressure distribution networks
-
○ The basic design process is the same as that used for porous media biofilters and includes several steps (refer to Chap. 8 for design details)
-
* Layout the STU, considering use of multiple zones
-
* Layout the delivery and distribution network(s)
-
* Choose an orifice size and calculate the discharge rate
-
* Check the uniformity of distribution (orifice flow rates should vary by <10 % of each other and the dose volume should be >5× the volume to fill the distribution piping)
-
* Calculate the total dynamic head during a dosing event
-
* Select a pump or siphon to deliver the dosing flow rate against the TDH calculated
-
* Select a dosing approach—demand based or timer based
-
* Calculate the dose volumes and timer settings if a timer is used
-
-
-
-
■ D&I considerations—Resting and cyclic application
-
• Resting cycles on the order of 1 year or more can help rejuvenate the infiltrability of a soil infiltrative surface
-
○ One option is to have two parallel units each equivalent to 75 % of the size required and alternate operation between the 2 units
-
○ Another option is to use dosing and sequential application to apply a cyclic higher HLRD to one or more parts of a system
-
* For example, a 4-trench network with a 4-year cycle of 1 year on-line and 3 years off-line and resting is shown in Fig. 11.29
Fig. 11.29 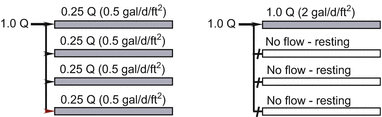
Uniform distribution between four trenches (left) versus cyclic overloading to one trench while the other three are rested (right)
-
-
-
-
■ D&I considerations—Design for long-term service
-
• Options for design for a sustainable service life (e.g., 20 year+)
-
○ Rejuvenation of infiltrability if soil clogging becomes excessive
-
* Apply higher effluent quality
-
* Use physical or chemical rehabilitation methods
-
* Enable long-term resting (e.g., 1 year or more)
-
-
○ Plan for installation of a new STU if needed
-
* Reconstruction (e.g., new trenches between the old ones)
-
* Reserve an area for a new STU (Fig. 11.30)—Resting of the original STU may restore capacity and enable use of the old along with the new unit
Fig. 11.30 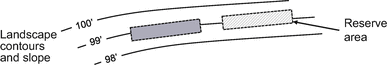
Illustration of a reserve area for a new STU if it is needed in the future
-
-
-
-
■ D&I considerations—Installation at the site
-
• Careful installation and startup are critical to long-term performance of a STU
-
• Construction practices must prevent damage to the soil and loss of infiltration capacity during installation
-
• Recommended practices include:
-
○ Do not drive, or even walk, on the soil infiltrative surface
-
○ Do not dump or place gravel or other solid objects on the infiltrative surface
-
○ Avoid construction in fine-grained soils during wet periods
-
○ Complete the installation quickly and minimize the time the soil infiltrative surface is exposed
-
-
• Figure 11.31 present photographs illustrating the installation of chamber-equipped soil treatment units for subsurface soil infiltration
Fig. 11.31 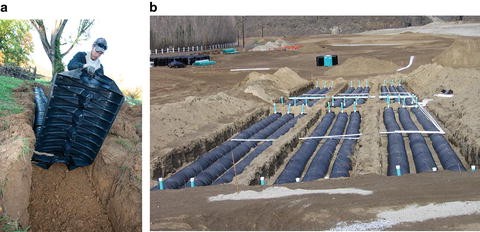
Photographs illustrating (a) a chamber-equipped trench being placed without walking on the infiltrative surface and (b) a large system serving a clustered development established in a larger bed excavation but with unused separation between adjacent infiltration units (Photographs courtesy of Infiltrator® Water Technologies)
-
• Startup activities and events
-
○ Flush lines to remove debris resulting from construction
-
○ Verify that all piping connections are solid
-
○ Verify functioning of pumps, distributor valves, etc.
-
○ Record and examine initial readings (e.g., for units with pumps and controls)
-
○ Initiate application of treatment unit effluent to the STU
-
-
• It is generally advisable to avoid construction and startup during ‘harsh’ weather and climatic conditions (e.g., cold winter months)
-
-
■ D&I considerations—Operation and maintenance
-
• STUs can be designed to have limited O&M
-
• Potential routine O&M requirements
-
○ Inspect and maintain all upstream treatment units (e.g., with a septic tank, clean effluent screens and pump septage)
-
○ Inspect and record conditions related to infiltration
-
* Landscape inspection—inspect the ground surface above the STU to ensure no seepage is occurring—if seepage is present, consider corrective actions
-
* Observe the magnitude of any ponding (Note: ponding is not necessarily an indicator of poor performance)—if excessive, reduce flow and/or plan for rehabilitation
-
* Verify that all portions of the STU that are supposed to be operational are receiving flow—adjust as needed
-
* Wastewater HLRD and OLR—if outside design limits consider flow reduction and/or higher treatment
-
-
-
-
■ D&I considerations—Monitoring and controls
-
• Monitoring requirements depend on the application, but all systems should have:
-
○ A method to reliably measure and record daily flow (e.g., indoor water meter, dosing counter) and flow to each zone of a STU
-
○ A means for inspection (and maintenance) of the infiltrative surface (e.g., observation ports)
-
-
• What may or may not be required and/or feasible
-
○ Monitoring of the wastewater to be treated in the STU is costly if done properly, and it is normally not needed, except for:
-
* STUs serving commercial or institutional buildings or larger developments
-
-
○ Sampling and analysis of soil and groundwater is difficult and costly, and should only be considered for special cases, e.g.:
-
* Larger systems (e.g., ≥ 25,000 gal/day), particularly those in sensitive environmental areas
-
-
○ Other sensors and alarms can be included if deemed important for monitoring and process control purposes, e.g.:
-
* Water level sensor for a dosing basin to detect and provide an alert if there is a pump or siphon problem
-
* Level sensors to detect and measure the depth of ponding in a trench or bed
-
– Could be used to turn off one portion of a STU and direct flow to another
-
-
* Subsurface sensors for measuring soil water content and temperature below a soil infiltrative surface
-
* Telemetry options for data acquisition and alarm communication
-
-
-
-
■ Overcoming site limitations and use of design variants
-
• Some sites are unsuitable for a normal STU application due to constraints related to:
-
○ Soil permeability being too high or too low, e.g.:
-
* Permeability is too high and inadequate treatment may result
-
* Permeability is too low and there is also susceptibility to construction damage
-
-
○ Inadequate soil depth to a limiting condition, e.g.:
-
* Shallow soil over creviced or porous bedrock
-
* Groundwater table is located near the ground surface
-
-
○ Landscape features e.g.:
-
* Inadequate land area and insufficient setback distances
-
-
○ Site assimilative capacity, e.g.:
-
* Inadequate hydrologic conditions for groundwater recharge without excessive water table mounding
-
-
-
• Design approaches can overcome some limitations (Table 11.18)
Table 11.18 Examples of system design approaches that can be used to overcome site conditions that prevent use of a normal STU -
• Basic features of at-grade and mounded STUs
-
○ Infiltration units are constructed within fill sand placed on the landscape surface (Fig. 11.32)
Fig. 11.32 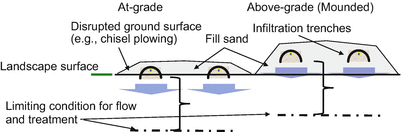
Illustration of an at-grade or mounded STU
-
○ Infiltration surface is placed in a chisel-plowed landscape surface or in a sand layer placed on the plowed soil surface
-
○ System performance can be equal or better than a typical STU (i.e., installed below the original ground surface) but costs are normally much higher
-
-
• Mound system design and application guidance
-
○ Considerations include those that are generally applicable to STUs as well as those that are unique to an at- or above-grade unit
-
○ Site conditions that are generally suitable for a mound system
-
* Depth below the landscape surface to a limiting condition
-
– High water table ≥ 10 in.
-
– Bedrock
-
Creviced bedrock ≥ 2 ft.
-
Non-creviced bedrock ≥ 1 ft.
-
-
-
* Soil permeability
-
– For the top 10 in., “moderately low” or better (e.g., percolation rate of 60–120 min/in)
-
-
* Landscape slope
-
– Up to 25 %
-
-
-
○ Key design features
-
* Sand fill
-
– The sand fill is critical to system performance
-
– Clean coarse sands are used for the mound fill
-
≤20 % coarse >2.0 mm and <5 % finer than 0.053 mm
-
-
-
* Wastewater application rates
-
– Based on wastewater composition and soil conditions
-
Application rate to the sand fill (e.g., 1 gal/day/ft2)
-
Rate for the basal area native soil (e.g., 0.25 gal/day/ft2)
-
-
-
* Wastewater delivery and distribution
-
– Intermittent dosing with pressurized distribution is normally required
-
-
-
-
• Figure 11.33 shows a photograph of the landscape where a mounded STU has been installed
Fig. 11.33 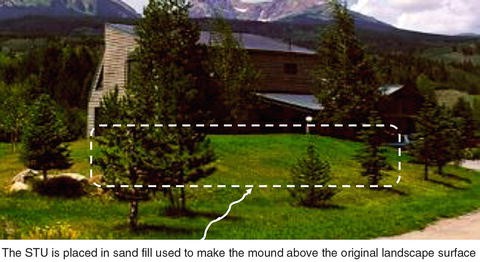
Photograph of a STU within an above-grade mound established using filter sand with certain specifications
-
-
■ D&I considerations—Modeling tools
-
• Modeling tools are available that can help with STU design and performance assessment
-
• Examples of several modeling tools include:
-
○ Analytical and numerical models of flow and transport for a single system that can be used to evaluate:
-
○ Watershed-scale models that can be used to evaluate:
-
* The relative effects of a large number of decentralized systems on water quality within a watershed (WARMF) (Siegrist et al. 2005)
-
-
-


11.1.1.5 11-5. Summary
-
■ Land-based wastewater systems have been used for more than 100 year, initially for simple short-term waste disposal but later for longer-term treatment and disposal
-
■ Today, soil treatment units can be designed to achieve:
-
○ Tertiary treatment of primary or secondary effluents,
-
○ Natural disinfection during subsurface transport, and
-
○ Groundwater recharge of the reclaimed water
-
-
■ Design and implementation requires integrated consideration of treatment goals, environmental conditions, and key factors affecting hydraulic and treatment processes in a soil profile
-
■ Soil treatment units can provide a long service life with limited power and O&M requirements
11.1.1.6 11-6. Example Problems
-
■ 11EP.1. Assessing site conditions and soil properties
-
• Given information
-
○ The site of interest is located northwest of Golden, Colorado where a developer wants to build a new condominium building (Fig. 11EP.1)
Fig. 11EP.1 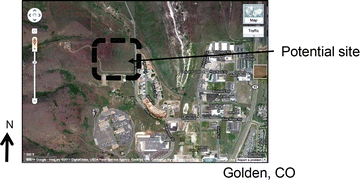
Aerial view of the location of a proposed development northwest of Golden
-
-
• Determine
-
○ Complete a preliminary assessment of soil and site conditions and the likely suitability for a STU
-
-
• Solution
-
○ Preliminary assessment using Web Soil Survey (WSS)
-
* Go to WSS URL: http://websoilsurvey.nrcs.usda.gov/app/HomePage.htm and choose “Start WSS” green button
-
* Under tab for “Area of Interest (AOI) ”, choose “Navigate By…” and enter state and county; select “View” button
-
* With AOI interactive map, use icons for zooming and map movement to focus in on site of interest; note if you zoom in too far and reach the scale limit, you can zoom out
-
* Choose the AOI icon (rectangle or polygon) and draw AOI boundary on map image around site of interest
-
* Select tab for “Soil Map” to review soil map units in AOI
-
* Under “Map Unit Legend”, select “Map Unit Name” to view description and properties
-
* Under tab for “Soil Data Explorer” choose “Sanitary Facilities” and “Septic Tank Absorption Fields” and “View Ratings”
-
-
○ Location of development site as area of interest on WSS appears in Figs. 11EP.2 and 11EP.3
Fig. 11EP.2 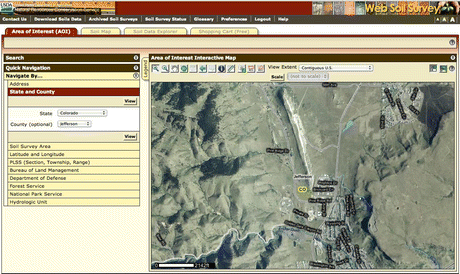
Web page from Web Soil Survey that shows the location of a proposed development site northwest of Golden (http://websoilsurvey.nrcs.usda.gov/app/HomePage.htm)
Fig. 11EP.3 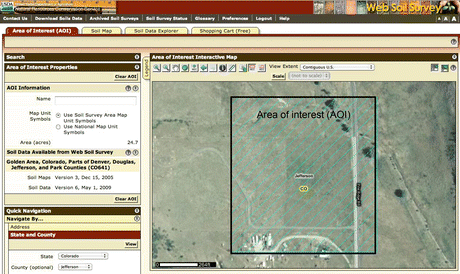
Web page from Web Soil Survey that shows the area of interest (AOI) for the proposed development site northwest of Golden (http://websoilsurvey.nrcs.usda.gov/app/HomePage.htm)
-
○ Soil mapping within the AOI is illustrated in Fig. 11EP.4
Fig. 11EP.4 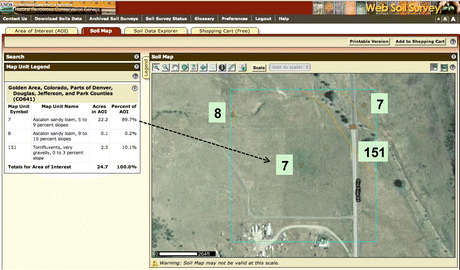
Web page from Web Soil Survey that shows the soil series within the AOI for a proposed development site (http://websoilsurvey.nrcs.usda.gov/app/HomePage.htm)
-
○ Soil properties for Map Unit 7 are shown in Fig. 11EP.5
Fig. 11EP.5 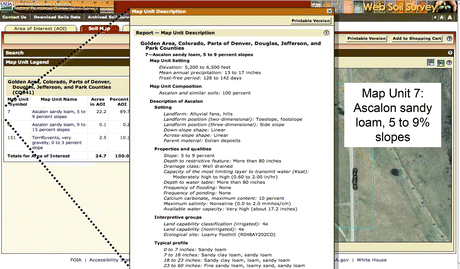
Web page from Web Soil Survey that shows the soil properties for Map Unit 7 which occurs within the AOI for a proposed development site (http://websoilsurvey.nrcs.usda.gov/app/HomePage.htm)
-
○ Suitability ratings for the AOI are shown in Fig. 11EP.6
Fig. 11EP.6 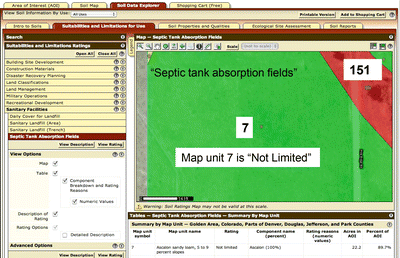
Web page from Web Soil Survey that shows Map Unit 7 which occurs within the AOI for a proposed development site is not limited for soil-based effluent treatment (http://websoilsurvey.nrcs.usda.gov/app/HomePage.htm)
-
○ Assessment of site suitability
-
* Site appears suitable based on WSS reported conditions:
-
– Profile: Ascalon sandy loam
-
– Land slope: 5–9 %
-
– Depth to restrictive zone: > 80 in
-
– Drainage class: Well drained
-
– KS of most limiting layer:
-
Moderately high to high (0.6–2.0 in./h)
-
-
– Depth to water table: > 80 in
-
– Frequency of flooding: none
-
– Frequency of ponding: none
-
-
* Site appears suitable, but a site investigation is needed
-
– Soil borings, backhoe test pits, and possibly hydraulic tests to verify conditions
-
– Assessment of site assimilative capacity might be warranted (e.g., groundwater mounding) depending on system size and design features
-
-
-
-
-
■ 11EP.2. Design of a subsurface soil treatment unit
-
• Given information
-
○ Site is located outside Denver, Colorado and a site evaluation revealed suitable site conditions with no limiting conditions observed during borings and testpits to 7 ft below ground surface
-
○ Convenience store with a design QD = 2000 gal/day
-
○ Treatment before the STU is a recirculating sand filter (RSF) (RSF effluent = 20 mg/L BOD5, 20 mg/L TSS and 50 % N removal)
-
○ A network of trenches outfitted with chambers will be used and RSF effluent distribution will be by pressurized dosing
-
○ Treatment goal: remove BOD5 and TSS as typical for a STU
-
-
• Determine
-
○ HLRD and total infiltrative surface (IS) area required (ft2), number of trenches needed and layout, and the total footprint area required (ft2)
-
-
• Solution
-
○ Select a HLRD based on LTARs in Colorado Regulation 43
-
* Soil profile conditions (based on a site evaluation)
-
– 0–30 in.: fine sandy loam (strong granular structure)
-
– 30–60 in.: sandy loam (moderate granular structure)
-
– 60–84 in.: medium to coarse sand (single grain)
-
-
* LTAR in Colorado Reg. 43 (see Tables 11EP.1 and 11EP.2)
Table 11EP.1 Treatment levels prescribed in Colorado Regulation 43 (CDPHE 2013) Table 11EP.2 The LTAR prescribed for system sizing is based on the treatment level and soil type in Colorado Regulation 43 (CDPHE 2013) -
– Soil Type 2 (assume placement of IS at 24 in. depth)
-
– Treatment Level = 2 N (RSF with 50 % N removal)
-
– Prescribed LTAR = 0.90 gal/day/ft2
-
-
-
○ Classification of the effluent to be applied to the STU
-
* Based on typical RSF performance the treatment level = TL2N (Table 11EP.1)
-
-
○ Determining the LTAR for sizing the STU
-
* LTAR = 0.90 gal/day/ft2 as shown in Table 11EP.2
-
-
○ Infiltration depth and area required
-
* The soil infiltrative surface will be placed at 24 in. depth bgs
-
– HLRD = LTAR = 0.90 gal/day/ft2
-
– Adjustments for architecture and pressurized dosing
-
Sizing adjustment factor = 0.8 (Table 11EP.3)
$$ \begin{array}{l}{\mathrm{A}}_{\mathrm{IS}}=\left(\frac{{\mathrm{Q}}_{\mathrm{D}}}{{\mathrm{HLR}}_{\mathrm{D}}}\right)\left(\mathrm{A}\mathrm{F}\right)=\left(\frac{2000\;\mathrm{gal}/\mathrm{day}}{0.90\;\frac{\mathrm{gal}/\mathrm{day}}{{\mathrm{ft}}^2}}\right)(0.8)\\ {}{\mathrm{A}}_{\mathrm{IS}}=\left(2222\;{\mathrm{ft}}^2\right)(0.8)=1778\;{\mathrm{ft}}^2\end{array} $$(11.9)Table 11EP.3 System sizing is adjusted based on the geometry of the STU and the method of effluent application in Colorado Regulation 43 (CDPHE 2013)
-
-
-
-
○ Check the organic loading rate
$$ \begin{array}{l}\mathrm{O}\mathrm{L}\mathrm{R}=\frac{\left({\mathrm{Q}}_{\mathrm{D}}\right)\left(\mathrm{BO}{\mathrm{D}}_5\right)\left(\mathrm{F}\right)}{{\mathrm{A}}_{\mathrm{IS}}^{\prime }}\\ {}\mathrm{O}\mathrm{L}\mathrm{R}=\frac{\left(2000\;\mathrm{gal}\;\mathrm{d}\mathrm{a}{\mathrm{y}}^{-1}\right)\left(20\;\mathrm{mg}\;{\mathrm{L}}^{-1}\right)\left(8.34\times 1{0}^{-6}\right)}{\sim 1778\;\mathrm{f}{\mathrm{t}}^2}\\ {}\mathrm{O}\mathrm{L}\mathrm{R}=0.00019\kern0.24em \mathrm{lb}\kern0.04em \hbox{--} \kern0.01em {\mathrm{BOD}}_5\kern0.1em /\kern0.1em \mathrm{da}\mathrm{y}\;\mathrm{per}\;\mathrm{f}{\mathrm{t}}^2\end{array} $$(11.10)✓ Okay, since OLR ≪ 0.001 lb-BOD5/day per ft2, which is a suggested limit for Class I soil (see Table 11.16)
-
○ Number of trenches required
-
* Select trench width (narrow preferred) and length (based on footprint area available and to keep length reasonable to aid delivery and distribution (e.g., < 100 ft long))
-
* Choose 2-ft wide trenches with a length of 75-ft.
$$ {\mathrm{L}}_{\mathrm{T}}=\left(\frac{{\mathrm{A}}_{\mathrm{I}\mathrm{S}}}{{\mathrm{W}}_{\mathrm{I}}}\right)=\left(\frac{1778\kern0.5em {\mathrm{ft}}^2}{2\kern0.5em \mathrm{ft}}\right)=889\kern0.5em \mathrm{ft} $$(11.11)$$ \mathrm{n}=\left(\frac{{\mathrm{L}}_{\mathrm{T}}}{{\mathrm{L}}_{\mathrm{I}}}\right)=\left(\frac{889\;\mathrm{ft}}{75\kern0.5em \mathrm{ft}}\right)=11.9\kern1em \therefore \mathrm{chose}\kern0.5em 12 $$(11.12)
-
-
○ Soil infiltrative surface area provided in the layout chosen
$$ {\mathrm{A}}_{\mathrm{I}\mathrm{S}}^{\prime }=\mathrm{n}\left({\mathrm{L}}_{\mathrm{I}}\times {\mathrm{W}}_{\mathrm{I}}\right)=12\left(75\;\mathrm{ft}\times 2\;\mathrm{ft}\right)=1800\;{\mathrm{ft}}^2 $$(11.13) -
○ System layout
-
○ Footprint area required
-
* Separation between trenches is needed to (1) enable construction and (2) to provide sidewall and undisturbed soil between trenches for oxygen diffusion to help maintain aerobic conditions in the soil profile within the STU
-
* With 4-ft separation between 12, 2-ft wide trenches that are each 75-ft long on each side of a center manifold (2 groupings of 6 trenches each separated by 8 ft.) the footprint area can be calculated using Eq. 11.14
$$ \begin{array}{l}{\mathrm{A}}_{\mathrm{F}}=\left(\mathrm{y}\right)\left[\left({\mathrm{L}}_{\mathrm{I}}\right)\left({\mathrm{W}}_{\mathrm{I}}\right)\left(\mathrm{n}\right)+\left({\mathrm{L}}_{\mathrm{I}}\right)\left({\mathrm{W}}_{\mathrm{U}}\right)\left(\mathrm{n}-1\right)\right]+\\ {}\kern2.5em \left(\mathrm{y}-1\right)\left[\left({\mathrm{L}}_{\mathrm{U}}\right){\left(\mathrm{W}\right)}_{\mathrm{I}}\left(\mathrm{n}\right)+\left({\mathrm{L}}_{\mathrm{U}}\right)\left({\mathrm{W}}_{\mathrm{U}}\right)\left(\mathrm{n}-1\right)\right]\\ {}{\mathrm{A}}_{\mathrm{F}}=(2)\left[(75)(2)(6)+(75)(4)\left(6-\mathsf{1}\right)\right]+\\ {}\kern2.5em \left(2-1\right)\left[(8)(2)(6)+(8)(4)\left(6-1\right)\right]\\ {}{\mathrm{A}}_{\mathrm{F}}=(2)\left[900+1,500\right]+256=5056\;{\mathrm{ft}}^2\end{array} $$(11.14)
-
-
○ Influent (RSF effluent) delivery and distribution
-
* Dosing frequency and volume
-
– For a sandy loam soil: select 4 doses per day
-
Check to be sure this no. is okay per the distribution network design and requirement that the dose volume is >5× the pipe fill volume
-
-
– For 4 doses per day and QD = 2000 gal/day, dose volume under design conditions = 500 gal/day
-
-
* Dosing tank size
-
– Volume for HRT = 1 day and F = 0.8
$$ \begin{array}{l}{\mathrm{V}}_{\mathrm{D}\mathrm{T}}=\left(\mathrm{F}\right)\left(\mathrm{H}\mathrm{R}\mathrm{T}\right)\left({\mathrm{Q}}_{\mathrm{D}}\right)\\ {}{\mathrm{V}}_{\mathrm{D}\mathrm{T}}=(0.8)\left(1\;\mathrm{day}\right)\left(2000\;\mathrm{gal}\kern0.1em /\kern0.1em \mathrm{day}\right)\\ {}{\mathrm{V}}_{\mathrm{D}\mathrm{T}}=1600\kern0.5em \mathrm{gal}\end{array} $$(8.13)
-
-
-
○ Distribution within the trench network
-
* Design of a pressurized network for a STU follows a process that is essentially the same as that used for pressure distribution to PMBs (See Chap. 8)
-
* However, STUs are larger than PMBs and hydraulic design is important to avoid large pumps or siphons; e.g.:
-
– For a 75-ft long lateral with 1/8-in. diam. orifices on 2-ft spacing, each trench has a lateral with 38 orifices
-
– Orifice Q at hr = 4 ft is 0.39 gal/min so lateral Q = 14.8 gal/min
-
– Total network Q = (12)(14.8 gal/min) = 178 gal/min
-
– To reduce pumping Q during a dose, consider dividing the STU into zones and using distributor valves, e.g.:
-
4 valves for 4 zones with 3 trenches in each zone
-
Pumping Q = (3)(14.8 gal/min) = 44.4 gal/min
-
-
-
-
-
-
■ 11EP.3. Assessment of N removal in a soil treatment unit
-
• Given information
-
○ Wastewater source is from an apartment complex with a design QD = 1500 gal/day
-
○ Treatment before the STU is a septic tank with effluent screen anticipated to yield STE with NH4 + = 60 mg-N/L and NO3 − = 1 mg-N/L
-
○ A site evaluation revealed a sandy loam soil profile with no limiting conditions observed during borings and testpits to 8 ft below ground surface and a soil temperature = 15 °C
-
○ The STU will have a design HLRD = 0.75 gal/day/ft2 applied to chamber-equipped trenches and STE application will be by timed dosing and pressure distribution
-
○ The treatment goal is to remove BOD5 and TSS consistent with expectations for a typical STU and also reduce the Total N to 20 mg-N/L by 3-ft depth below the soil infiltrative surface
-
-
• Determine
-
○ N concentration and mass flux at 3-ft depth below the soil infiltrative surface
-
-
• Solution
-
○ Assessment of N removal using STUMODe
-
* Within Excel, open and start STUMOD (Fig. 11EP.9)
Fig. 11EP.9 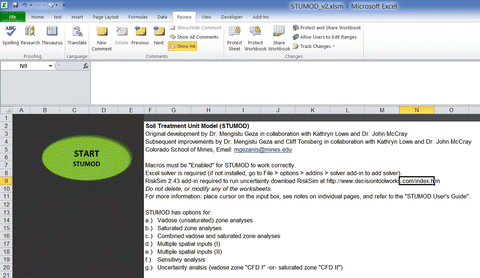
Image of the opening screen of STUMOD
-
* Input values for each parameter (Figs. 11EP.10 and 11EP.11) and run STUMOD
Fig. 11EP.10 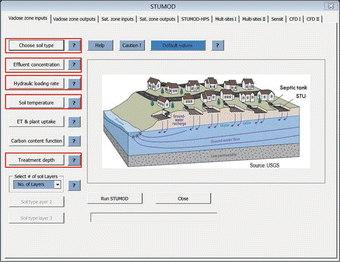
Image of the opening input screen for STUMOD
Fig. 11EP.11 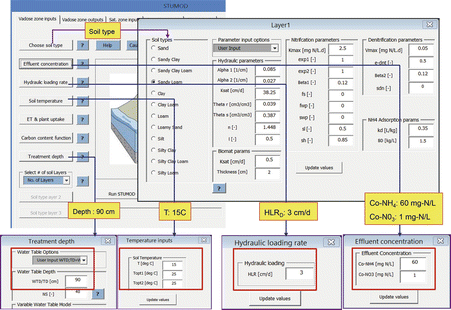
Image of the screens for inputting parameter values for STUMOD
-
* The STUMOD simulation results for concentration and mass flux are shown in Figs. 11EP.12 and 11EP.13
Fig. 11EP.12 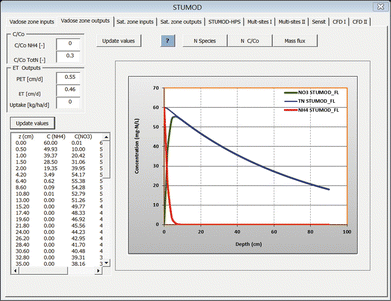
Nitrogen concentrations versus depth below the soil infiltrative surface as simulated with STUMOD
Fig. 11EP.13 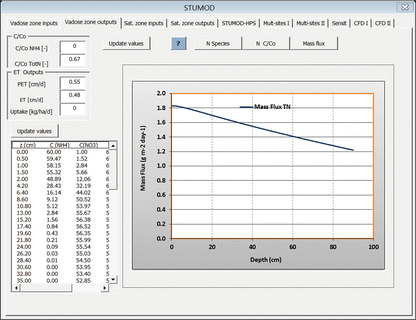
Nitrogen mass flux versus depth below the soil infiltrative surface as simulated with STUMOD
-
-
○ The Total N in soil pore water at 3 ft depth is 18 mg-N/L, which meets the 20 mg-N/L goal
-
Click on the boxes shown onthe right to input soil parameters, effluent concentrations, Hydraulic loading rate, soil temperature, and treatment depth.
The input boxes for each parameter are displayed as shown in Fig. 11EP.11.
-
Required input values:
-
Soil type = Sandy loam
-
HLRD = 3 cm/d (0.75 gal/d/ft2
Co-NH4 = 60 mg-N/LCo-N03 = 1 mg-N/LT = 15C
Depth = 90 cm (3 ft.)
-
-


Rights and permissions
Copyright information
© 2017 Springer International Publishing AG
About this chapter
Cite this chapter
Siegrist, R.L. (2017). Treatment Using Subsurface Soil Infiltration. In: Decentralized Water Reclamation Engineering. Springer, Cham. https://doi.org/10.1007/978-3-319-40472-1_11
Download citation
DOI: https://doi.org/10.1007/978-3-319-40472-1_11
Published:
Publisher Name: Springer, Cham
Print ISBN: 978-3-319-40471-4
Online ISBN: 978-3-319-40472-1
eBook Packages: Earth and Environmental ScienceEarth and Environmental Science (R0)