
Abstract
High accuracy and real-time implementation are important requirements for scene matching in visual navigation applications. A multi-scale coarse-to-fine SAR scene matching algorithm based on compressed contour feature is proposed in this paper. Firstly, the compressed contour features of the real-time image and the reference image are extracted through adjacent sub-region differencing, and multi-scale feature images are constructed by changing sub-region size. Then, coarse matching is carried out on the feature images, and scale factor and coarse matching position are obtained through cluster analysis of several matching results. Finally, some sub-regions with rich edge information are chosen from the original real-time image, and used to carry out fine matching around the coarse matching region in the original reference image, in this way the final accurate matching position is obtained. Experimental results demonstrate the excellent matching performance of the proposed algorithm.
You have full access to this open access chapter, Download conference paper PDF
Keywords
1 Introduction
In recent years, with the rapid development of SAR technology, the imaging advantages such as all-day, all-weather, wide range and long distance make SAR become ideal data for aircraft visual navigation. The aircraft position can be computed through matching the real-time SAR image obtained by on-board sensor and the prestored reference SAR image, in this way one can judge whether the aircraft deviate from its usual flight path. Therefore, the accuracy and speed are main indexes used to evaluate the performance of matching algorithms.
You [1] proposed coarse-to-fine image matching by means of wavelet and multi-resolution analysis, which greatly reduces the computational burden. Multi-resolution image matching through constructing image pyramid [2] becomes main method of improving SAR image matching speed [3]. The main drawback to the method is that, whatever Gaussian pyramid or wavelet pyramid, in the coarse matching phase, the low-frequency of the original image is used, while most of the high-frequency is discarded. Since the inherent speckle noise will usually result in low image quality, in order to guarantee high matching accuracy, high-frequency features, such as edge, gradient, contour, are often used to match the real-time image and the reference image. Li [4] proposed an image matching algorithm based on spatial sub-region congruency feature, which can be robust to multi-sensor images with inferior quality. However, the matching position error is closely related to the size of sub-region, and distributed in the corresponding sub-region. Moreover, the algorithm couldn’t resolve the problem in case that there exists scale difference between the real-time image and the reference image. Although the majority of scale difference between two images can be eliminated by means of prior knowledge in visual navigation, it is possible that there still exists some small scale difference between two images. SIFT feature [5] and SURF feature [6] can realize the matching between two image with great scale difference, but they couldn’t meet the real-time requirement. Moreover, since SIFT feature and SURF feature are based on the gray value information, while the real-time image and the reference image are imaged by different SAR sensors, the great gray value difference between two images usually leads to the poor matching performance of SIFT feature matching and SURF feature matching.
In this paper, aiming at improving matching accuracy and matching speed, a multi-scale SAR scene matching algorithm based on compressed contour feature is proposed to realize the coarse-to-fine rapid matching of the real-time image and the reference image. The paper is organized as follows. Section 2 introduces the proposed method, and describes the generation of compressed contour feature images, the coarse matching of the generated feature images, and the fine matching of the original real-time sub-region image and the corresponding region of reference image. Experimental results and corresponding analysis are given in Sect. 3. Finally, Sect. 4 draws some conclusions.
2 Proposed Method
As shown in Fig. 1, the proposed method mainly consists of three parts. Firstly, the compressed contour feature images of the real-time image and the reference image are generated by adjacent sub-region differencing. Secondly, the coarse matching is carried out on the generated feature images. Thirdly, the fine matching is carried out on the real-time sub-region image and the reference image around the coarse matching region.

Flowchart of proposed method
2.1 Compressed Contour Feature Image
Edge is one of the most frequently used features in image matching, since it can describe targets and scenes robustly in SAR images. However, the gray value difference between the real-time image and the reference image will accordingly result in the difference of extracted edge features, which makes the matching more difficult. In this paper, the underlying idea of edge detection is utilized. As shown in Fig. 2, the image is divided into many square sub-regions with same sizes which are regarded as a unit of contour detection, and the difference of adjacent sub-regions is computed as a new kind of contour feature. The sum of absolute values of corresponding pixels in two sub-regions is defined as the difference of sub-region, namely,
Where \( N \) is the total pixel number in a sub-region with a certain size. As shown in Fig. 2, the sub-region difference is computed in four directions, i.e. 0°, 90°, 45° and 135°, and four compressed contour feature images can be generated accordingly.

Sub-region differencing and contour compression
Adjacent sub-region differencing is carried out on the real-time image and the reference image, and their corresponding compressed contour feature images can be generated. In some cases, there still exists some small scale difference between the real-time image and the reference image. In order to realize robust scene matching, the compressed contour feature is extracted on three different scales for the real-time image. Suppose the size of sub-region for the reference image is s, the sizes of sub-region for the real-time image are 0.9 s, s and 1.1 s respectively. Therefore, for the real-time image, 12 compressed contour feature images can be generated in four directions and three scales, while for the reference image, 4 compressed contour feature images can be generated in four directions and one scale. Taken s = 8 × 8 as example, the size of generated feature image can be compressed about 64 times, which means that the computation burden and searching space in matching can be reduced greatly.
Figures 3 and 4 give two illustrations of compressed contour feature image generated by the aforementioned method. Both in Figs. 3 and 4, for display convenience, the original image is shown in a smaller size, while the feature images are shown in a larger size. Figure 3(b) and (c) represent the image generated by Gaussian pyramid and Wavelet pyramid at level \( N = 3 \), while Fig. 3(d), (e) and (f) represent the feature image in direction 0°, 90° and 45° respectively. Since the original image is 512 × 512 in size, all these five images are 64 × 64 in size. A conclusion can be drawn from the comparison that, the compressed contour feature image has better contour preserving ability, while the pyramid image discards much high-frequency information, such as edge, detail, and so on. After sub-region differencing, the dominant contour features of those man-made objects such as roads are preserved and enhanced, while the unobvious contour features of those untypical objects are suppressed greatly.

Original SAR image and generated feature images

Generated 45° feature images at 3 scales
Figure 4 gives an illustration of compressed contour feature image generated at three different scales. For each real-time image, we generate such a set of feature images in each direction, among which there will be a scale approaching the true small scale information between the real-time image and the reference image, since the majority of scale difference can be compensated by prior knowledge.
2.2 Coarse Matching of Compressed Contour Feature Images
After the compressed contour feature images of real-time image and the reference image have been generated, coarse matching is carried out on those feature images according to corresponding directions. Suppose \( T_{i}^{A} \) represents the compressed contour feature image of the reference image in the \( i{\text{th}} \) direction, and \( T_{i,s}^{B} \) represents the compressed contour feature image of the real-time image in the \( i{\text{th}} \) direction and at the \( s{\text{th}} \) scale. Let image \( T_{i,s}^{B} \) be the template and slide in image \( T_{i}^{A} \) pixel-by-pixel, the corresponding correlation matrix \( NCC_{i,s} \) can be computed by
As was mentioned earlier, when we generate the compressed contour feature image, there are three scales (0.9 s, s, 1.1 s) and four directions (0°, 90°, 45°, 135°) for the real-time image, and one scale (s) and four directions for the reference image. Therefore, the reference feature image in each direction should be used to carry out matching with the real-time feature images at three scales in the same direction, which will produce 12 correlation matrixes. Theoretically speaking, the primary peak position of the correlation matrix corresponds to the true matching position, where the maximal similarity of two images occurs. Therefore, 12 correlation matrixes can generate 12 theoretical matching positions.
Generally speaking, if the matching results are correct, these matching positions should distribute in a small neighborhood of the true matching position, while there is no relativity and consistency between those wrong matching positions which distribute arbitrarily and randomly.
Therefore, we adopt ISODATA cluster method to carry out cluster analysis for generated 12 matching positions. After clustering, we can obtain a class with maximal sample number, and then the average value of the class is taken as the coarse matching position, and the scale of the majority of samples in this class is taken as the scale factor of the real-time image relative to the reference image.
2.3 Fine Matching of the Real-Time Sub-region Image and the Reference Image
Since the coarse matching position obtained by matching the compressed contour feature images corresponds to a sub-region of the original reference image, its accuracy couldn’t meet the requirement of the visual navigation, therefore, fine searching and matching around the coarse matching position in the original reference image is necessary.
The scale information between the real-time image and the reference image can be obtained by the coarse matching, so before the fine matching, the real-time image should be transformed according to the scale factor. Moreover, each part of the real-time image contains different information, which means the role of each part in matching is different accordingly. Those regions with richer edge, contour and gradient information can produce higher matching accuracy. Therefore, the edge density is chosen as the measure to determine automatically four sub-regions with richer information.
Edge density is used to measure the dense degree of edge distribution in an image. The greater the density, the richer the edge feature, which means more features can be used in matching to produce higher matching accuracy. The edge density of a local window with center \( (u,v) \) can be represented by the ratio of the edge point number of the window and that of the whole image, namely
The value of edge density is closely related to the choice of edge detection operator. Only those edge segments with certain length and stable curvature can reflect the contour information of objects in the scenes, while those cluttered discrete edge points are meaningless when describing the contour information. Therefore, before calculating the edge density according to formula (3), the edge points should be filtered and purified to choose those significant ones.
The fine matching method can be stated as follows:
-
1.
Transform the original real-time image according to the scale factor determined by the aforementioned coarse matching algorithm, while the reference image remains unchanged.
-
2.
Carry out edge detection by mean of ROEWA (Ratio of Exponentially Weighted Average) algorithm [7] and [8]. ROEWA is ones of the most frequently used SAR edge detection algorithms, which has advantages such as accurate edge positioning, less false edge points and robustness to speckle noise.
-
3.
Connect edge points into edge segments by searching connected region, calculate curvature of each edge segment, extract those stable segments with constant curvature and enough length [9], and remove a great number of cluttered edge points. After that, compute edge density of each sliding window pixel by pixel according to formula (3), and then obtain an edge density map.
-
4.
Choose four non-overlapping sub-regions with greater edge density. We segment the edge density map by the preset threshold, sort the local maximum of each segmented binary region in descending order, and then the sub-regions corresponding to the first four values are the obtained regions.
-
5.
Carry out fine matching of four sub-regions around the coarse matching position in the original reference image by means of gradient vector correlation algorithm [10], and four pairs of matching coordinates can be obtained and transformed as matching positions of the real-time image with original size and the reference image, as shown in Fig. 5.
Fig. 5. 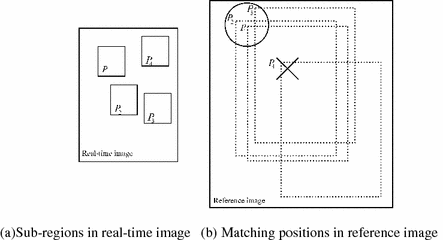
Determination of final matching result
-
6.
Compute the ratios of primary and secondary peak of four correlation matrixes obtained by four sub-regions. If the matching positions of sub-regions are close to each other, the matching position of the sub-region with the greatest ratio is taken as the final matching position, since the greater the ratio, the more reliable the matching result. As shown in Fig. 5, the final matching position is determined by the sub-region with the greatest ratio among P 1, P 2, P 3, while the matching position of sub-region P 4 is discarded since it differs from that of other sub-regions greatly.

3 Experimental Results and Analysis
The proposed algorithm has been tested on two SAR image sequences to evaluate the effectiveness and performance. The reference images are two TerraSAR images with size of 512 × 512, while the real-time images are airborne SAR images at two different flight paths. There are 26 frames and 35 frames included in sequence 1 and 2 respectively. The size of the real-time image is 150 × 300, and the resolution of sequence 1 is identical to that of the reference image, while there is small scale difference between some images of sequence 2 and the corresponding reference image.
The proposed algorithm is used to match the real-time image sequences and the reference images, and compared with the traditional normalized production algorithm (Nprod algorithm). The matching results are shown in Table 1, in which the matching time is the average matching time for the whole sequence, and the matching accuracy is denoted by the error between the final matching position and the ground truth labeled manually, and given by the average error of all the images matched correctly for the whole sequence. Here correct matching is defined as the matching with error limited in 10 pixels.
It can be seen from Table 1 that, the proposed algorithm demonstrates the excellent performance, and outperforms the traditional Nprod algorithm. Especially in case that there is some small scale difference between the real-time image and the reference image for sequence 2, Nprod algorithm couldn’t realize correct matching, while the proposed algorithm can obtain the scale transform information by constructing the compressed contour feature image at three scales, which guarantees the correct matching.
Due to space limitation, two matching experiments are given here to demonstrate the matching performance of the proposed algorithm for scale difference. As shown in Fig. 6, white rectangular represents the matching results of the proposed algorithm, while the black rectangular represents that of Nprod algorithm. The red asterisk, white asterisk and black asterisk represent the ground truth and the matching position of two aforementioned algorithms. In Fig. 6(a), there is no any scale difference between the real-time image and the reference image, therefore two algorithms obtain the similar matching results, which is close to the ground truth. In Fig. 6(b) and (c), there are some small scale difference between two images, and it can be seen that, the proposed algorithm can produce more accurate matching position. The scale factors can be obtained as 0.9 s and 1.1 s respectively for these two experiments according to the proposed multi-scale sub-region differencing and cluster analysis.

Matching experiments
In the visual navigation applications, the compressed contour feature image of the reference image can be generated offline and loaded on the aircraft beforehand, which can improve the real-time implementation performance of the proposed algorithm. The experiments were conducted on a PC with 2.66 GHz processor and 2 GB memory, by means of MATLAB 7.1, and the average matching time is 2.9 s and 3.2 s respectively for two sequences. It can be seen that, compared with the traditional Nprod algorithm, the matching speed is greatly improved.
4 Conclusions
In the aircraft visual navigation, the matching accuracy and speed are two important indexes to evaluate the performance of scene matching algorithm. However, they are often influenced by gray value difference and scale difference between the real-time SAR image and the reference SAR image. In this paper, a multi-scale SAR scene matching algorithm based on compressed contour feature is proposed to realize the coarse-to-fine rapid matching of the real-time SAR image and the reference SAR image.
In the coarse matching phase, since sub-region differencing is different from the traditional pixel differencing and it is robust to the inherent speckle noise, the compressed contour feature image can preserve the dominant contour feature of two images and remove their inconsistent direct current component, which means that the feature images can demonstrate the common information included in two images better and be more suitable for matching. In order to reduce the influence of scale difference, sub-regions with different size are used to construct multi-scale feature image, and cluster analysis is implemented on several matching results to determine the scale transform information. In the fine matching phase, sub-regions with richer edge information are chosen in the real-time image to carry out searching and matching around the coarse matching position in the reference image, which can improve the efficiency and accuracy of scene matching.
Experimental results demonstrate that, the proposed algorithm outperforms the traditional Nprod algorithm in the matching accuracy and speed. Its low computational complexity and high practicability makes it suitable for aircraft visual navigation. Moreover, the proposed algorithm can be used in multi-sensor image matching, such as SAR and optical image matching. One limitation is that the proposed algorithm does not show any improvement when there are no typical and obvious contour features in the matching scene, e.g., the scene is vegetation or hill, etc.
References
You, J., Bhattacharya, P.A.: Wavelet-based coarse-to-fine image matching scheme in a parallel virtual machine environment. J. IEEE Trans. Image Process. 9(9), 1547–1559 (2000)
Gonzalez, R.C.: Digital Image Processing. Prentice Hall, New Jersey (2002)
Zhaohui, Y., Ying, C.: SAR scene matching algorithm based on ROA gradient’s increment sign correlation. J. Geomat. Sci. Technol. 28(6), 421–428 (2011)
Zhuang, L.I.: Research on key technologies of multi-sensor images matching. J. Natl. Univ. Def. Technol. (2011)
Lowe, D.G.: Distinctive image features from scale-invariant key points. Int. J. Comp. Vis. 60, 91–110 (2004)
Bay, H., Ess, A., Tuytelaars, T., Gool, L.V.: Speeded-up robust features (SURF). J. Comput. Vis. Image Underst. 110, 346–359 (2008)
Bovik, A.C.: On detecting edges in speckle imagery. J. IEEE Trans. Acoust. Speech Signal Process. 36(10), 1618–1627 (1988)
Fjϕrtoft, R., Lopes, A., Marthon, P.: An optimal multiedge detector for SAR image segmentation. J. IEEE Trans. Geosci. Remote Sens. 36(3), 793–802 (1998)
Juan, S., Xinggang, L., Daizhi, L.: A multi-sensor image registration algorithm based on structure feature edges. J. Acta Automatica Sinica 35(3), 251–257 (2009)
Delie, M., Jinwen, T.: Automatic infrared condensing tower target recognition using gradient vector features. J. Astronaut. 31(4), 1190–1194 (2010)
Author information
Authors and Affiliations
Corresponding author
Editor information
Editors and Affiliations
Rights and permissions
Copyright information
© 2015 Springer International Publishing Switzerland
About this paper
Cite this paper
Juan, S., Wei, C., Yang-yang, Z. (2015). A Multi-scale SAR Scene Matching Algorithm Based on Compressed Contour Feature. In: Zhang, YJ. (eds) Image and Graphics. ICIG 2015. Lecture Notes in Computer Science(), vol 9217. Springer, Cham. https://doi.org/10.1007/978-3-319-21978-3_17
Download citation
DOI: https://doi.org/10.1007/978-3-319-21978-3_17
Published:
Publisher Name: Springer, Cham
Print ISBN: 978-3-319-21977-6
Online ISBN: 978-3-319-21978-3
eBook Packages: Computer ScienceComputer Science (R0)
