
Abstract
Environmental issues change from place to place and time to time. The issues include local as well as global issues. The understanding of issues is necessary to find solution. Air pollution issues have changed over a period of time. Issues like atmospheric brown cloud, climate change, hazardous air pollutants, black/muddy snow which are hardly discussed few decades back have now gaining importance. This chapter elaborates major issues due to air pollution.
You have full access to this open access chapter, Download chapter PDF
Keywords
- Gross Domestic Product
- Suspended Particulate Matter
- Severe Acute Respiratory Syndrome
- Ekman Layer
- Montreal Protocol
These keywords were added by machine and not by the authors. This process is experimental and the keywords may be updated as the learning algorithm improves.
‘Pollution ’ is originated from Latin word ‘Pollutus’ which means ‘foul or unclear’. Air pollution can be defined as ‘Atmospheric condition in which substances is present at concentrations higher than their normal ambient levels to produce significant effects on humans, animals, vegetation or materials’ (Seinfeld 1986).
The air we breathe is most important natural resource which allows us to survive. The composition of air around us keeps changing continuously due to both natural as well as man made emissions into the atmosphere . Earth’s atmosphere is a layer of gases retained by the gravity. On an average, as shown in Fig. 1.1 dry air consists of 78.09 % of nitrogen, 20.95 % of oxygen, 0.93 % of argon and 0.039 % of carbon dioxide by volume. Minor constituents such as methane (CH4), Ozone (O3), Sulphur Dioxide (SO2), Nitrogen Dioxide (NO2), Nitrous Oxide (N2O), Carbon Monoxide (CO), Ammonia (NH3) etc. are also present having very low mixing ratios. These constituents do vary place to place due to change in atmospheric conditions. The air constituents over the sea will not be same as at the shore; sea shore air may not have same concentrations of the constituents as desert air. Sea shore air will be dominated by water vapour where as desert air will have more suspended dust. Similarly, the thick Amazon forest will have more water vapour and volatile organic compounds whereas he air above solid waste dumping site is likely to have more methane and ammonia.

Constuents of air
Low concentration of air pollutants does not mean that it can be neglected. Considering example of lead which is present in the atmosphere in traces, the total quantity in 1983 and in the mid-1990s, were estimated to be about 330,000 tonnes (Nriagu and Pacyna 1988) and 120,000 tonnes (Pacyna and Pacyna 2001), As per the study by Richardson et al. (2001), the whole emissions from natural sources were around 220,000–4,900,000 tonnes/year.
FormalPara Atmosphere and its layersWhen the solar system condensed out of “primordial solar nebula” which is nothing but interstellar cloud of gas and dust, the situation was not as complex as today and air pollution was not an issue. The early atmosphere of this planet was believed to be blend of carbon dioxide, nitrogen, water vapour and hydrogen. The early atmosphere of this planet was slightly reducing chemical mixture as compared to present atmosphere which is strongly oxidizing. With lapse of time, distinct layers of the atmosphere were formed with distinct characteristics. These are described below.
-
Troposphere : It is the lower most layer of atmosphere extending from the earth’s surface to 10–15 km altitude depending on time and latitude (Fig. 1.2). This layer is characterised by declining temperature with height and rapid vertical mixing. Temperature at the ground is about 20 °C and it decreases gradually till the tropopause is reached. The tropopause is the boundary having constant temperature which separates the troposphere and stratosphere.
Fig. 1.2 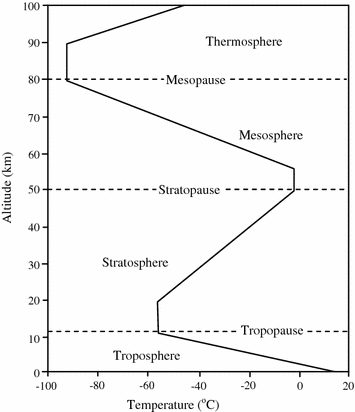
Temperature profile with changing altitude across different layers of the atmosphere

The decrease of atmospheric temperature (T) with height (z) is called as lapse rate (α) which is expressed as follows
The change in temperature of a mass of air as it moves upwards is called as adiabatic lapse rate. The dry adiabatic lapse rate (DALR) and the moist adiabatic lapse rate (MALR) are 9.8 and 4.9 °C/km respectively. Actual change of temperature with altitude for the stationary atmosphere or temperature gradient is known as Environmental Lapse Rate (ELR). Generally, decrease of 6.49 °C/km is considered as Environmental lapse rate. In the troposphere, atmospheric pressure also decreases rapidly with the altitude. One can understand that climbing to an altitude of 5.5 km, would put you above 50 % of the atmosphere’s molecules where atmospheric pressure is 500 mb only. Actually, the heating of the surface creates warm air at surface. The warm air rises, but air expands as it rises and cools as it expands (Adiabatic cooling). Typically, the troposphere is characterized by warm air at surface and cooler air above. If the cooler air exists at surface and the warmer air above, this is called as Buoyancy. If a rising air parcel becomes saturated condensation occurs. The condensation warms the air parcel due to the release of latent heat. So, a rising parcel cools less if it is saturated
The atmosphere near earth’s surface is divided into different layers based on wind behaviour:
-
The laminar sublayer also called the viscous sublayer, is the region in which the flow is laminar. With respect atmosphere it is usually less a centimetre.
-
The surface layer extends from ≤30–50 m. The heat and vertical turbulent fluxes in this layer are constant.
-
The Ekman layer is the layer in a fluid where force balance between pressure gradient force, turbulent drag and coriolis force are balanced. It was named after scientist Vagn Walfrid Ekman who explained the phenomena for the first time. Ekman layer extends to height of 300–500 m. In this layer wind direction is affected by earth’s rotation. Wind speed his layer generally increases with height.
-
Free atmosphere is the layer above Ekman layer in which the effect of the surface friction on the air motion is negligible.
-
Stratosphere : It is positioned just above the troposphere extending from 11–50 km. In the stratosphere, temperature increases with altitude, from −60 °C at base to 0 °C at the top of the stratosphere. The increase in temperature is basically due to the absorption of solar energy by the ozone layer. Ozone (O3) is effective absorbing species for solar UV radiation (200–310 nm with a maximal absorption at about 250 nm) in the stratosphere. Generally, UV-C (280–100 nm) which is highly harmful is entirely screened out by dioxygen (<200 nm) and ozone (>about 200 nm) before 35 km height. UV-B (315–280 nm) radiation is mostly screened by ozone layer. UV-A (400–315 nm) reaches earth surface having small damage e.g. premature ageing of skin etc.
-
Mesosphere : Just above the stratosphere, the mesosphere exists extending from 50–80 km altitude, The space shuttles orbit in this layer of the atmosphere . Due to decrease in solar heating, temperature decreases with altitude in the mesosphere, 0 °C at base, −95 °C at the top of the mesosphere. The top of the mesosphere is the coldest region of atmosphere. Polar mesospheric clouds of water ice are seen in this layer which are known as Noctilucent clouds. These are highest clouds in earth atmosphere and are seen mostly during summer months between 50 and 70 degree N and S. The D layer of ionosphere also exists in mesosphere which is seen during the day time. Meteors burn up in the mesosphere while entering the earth atmosphere.
-
Thermosphere : Thermosphere is the last layer of the atmosphere which exists at 80 km and above up to exosphere. In the thermosphere, the temperature increases with altitude as atoms of this layer are accelerated by solar radiation. Temperature at the base of the thermosphere is −95 °C but it is 100 °C at 120 km and 1500 °C at upper part. Though the temperature of this layer is very high but the heat content negligible. Auroras exist in thermosphere. The Auroras are seen due to the effect of energetic particles (electrons and photons) coming in the solar wind. Charged particle entering the atmosphere ionize atmospheric constituents. The aurora can be seen best in the dark sky or ‘magnetic midnight’ time. In northern latitudes, the effect is known as the Aurora borealis (or the northern lights), named after the Roman goddess of dawn, Aurora, and the Greek name for the north wind, Boreas, by Galileo in 1619. International Space Station orbits in upper part of thermosphere (320–380 km). In the thermosphere, ionization occurs due to UV rays. E and F regions of ionosphere exist in this layer. At the Exosphere (beginning 500–1000 km), the atmosphere turns into space.
-
Ionosphere: In fact, the Ionosphere extends from 50–1000 km covering partly mesosphere and thermosphere. It has diurnal and seasonal variation as the ionization depends upon Sun and its activity. As mentioned earlier, the D region of the ionosphere exists in the mesosphere while E and F regions of the ionosphere exist in the thermosphere. Ionosphere is a shell of electrons and electrically charged atoms and molecules. E and F regions are present at nights. D region is formed during day time when the E and F regions become much stronger. Often during the day, the F region is further differentiated into F1 and F2 regions. In the D region, UV rays ionize NO and X-rays ionize O2 and N2. In the E region, X-rays and far UV ionize \( {{\text{O}}_{ 2}}^{ - } \). E region can reflect radio waves lower than 10 MHz. Extreme UV rays ionize O2 in the F- region during nights. F layer is responsible for short wave (HF) radio communication for long distances.
Ever since the discovery of fire, air pollution has been a problem. “heavy air of Rome” in 61 A.D., has been recorded by Roman philosopher Seneca. In 1273, King Edward I prohibited burning of coal in London (William and Lou 2003). By the 1280s, people were using coal as fuel in processes like limekilns and metalworking leading to air pollution which had black smoke as well as oxides of sulphur. Late 18th and early 19th centuries saw dramatic changes in manufacturing, agriculture, mining, production as well as transportation. Invention of electric power in the nineteenth century resulted in coal fired electric generation in 1880s. Very famous example of air pollution is the smog formation around Los Angeles during the 1940s which led to the passing of first state environmental legislation in USA. In 1955, the Air Pollution Control Act was enacted in USA which was the first federal environmental legislation in the country. Later on in 1960s, oil overtook coal as the source of primary energy. Extensive use of oil led to the emissions wherever vehicles moved.
With the industrial revolution in the post eighteenth century economy changed to machine-based manufacturing in many of the present developed countries. Mechanization of the textile industries and iron-making techniques increased demand for fuel and their by air pollution in those areas of such activities. The developments in 19th century led to second industrial revolution.
The construction activity also saw shift in construction material as well as technology. The invention of cement replaced mud walls (Fig. 1.3) and increase in cement demand lead to emissions from this sector.

Remnants of historic building with mud masonry in an Asian City
As the European and American markets were saturated, Asian markets opened up for vehicles which are currently unbalanced where in poor people ride on bus top or trucks while rich people ride in individual cars (Fig. 1.4). While the economic crisis in Greece resulted in reduction of air pollution (Vrekoussis et al. 2013) China witnessed dramatic air quality detonation last decade. Analysis of data from monitoring network created by WHO and UNEP in 50 cities in 35 developed as well as developing countries shows that over the past 15–20 year indicate that the lessons of earlier experiences in the now developed countries have yet to be learned. Air pollution in 20 of the 24 megacities shows that ambient air pollution at levels where serious health effects (David et al. 1996). The rise of population in the developing countries in future with a lack for air pollution control will worsen in many more cities.

Traffic from a developing Asian country
In the beginning of 1970s when the rapid growth in Europe lead to environmental pollution and air pollution of London which resulted in death of more than 5000 people was fresh in memory the United National Conference of the Human environment in Stockholm in 1972 lead to foundation of international cooperation in this regard. This is followed by series of development that aimed to bring down air pollution. Convention on Long-range Transboundary Air Pollution in 1979 was signed UNECE countries. Governments of UNECE member states signed the convention on Long-range Transboundary Air Pollution on 13 November 1979. The 1985 lphur Protocol or 30 % protocol aimed to bring down 30 % SO2 at national level by countries of UNECE region.
All business decisions affect the air and atmosphere . Hence, like water which is purified, packaged and priced, soon pure air will also be priced. There are oxygen bars opened up in many parts of the world to supply oxygen to customers. However, inspite of urgent need of stringent air pollution policies and regulations in several parts of the world, air pollution control is still not a political priority as compared to the business and economy in many parts of the world. As a result the pollution is continued in one form of other, many forms are not even monitored and controlled. Over the years only few conventional air pollutants such SO2, NO2, particulate matter, O3 etc. are monitored by the researchers and the pollution control authorities. Pollutants such as Persistent Organic Pollutants (POPs) were neglected in the past but have been considered recently for continuous monitoring due to their severe health effects. Both organic as well as inorganic air pollutants cause deadly deceases and hence, their monitoring is very important for humans and environment.
While many developing countries took the matter seriously others were only keen to satisfy international community. Even though environmental legislations were enacted all over the world, the capacity of enforcing agencies was limited mainly due to insufficient knowledge and research capacity with enforcing agency. Many organisations had very few staff to start with limited budget to monitor and travel. The absence of expertise had either lead to improper monitoring by selecting improper sampling site/methodology and poor analysis. Many organisations till date are dogged with insufficient manpower to the extent of one to ten technical/scientific staff for a million of citizens.
What makes air pollution most challenging compared to other pollution is its complexity. As mentioned above, unlike water which can be contained in a container for easy study it is difficult to simulate the atmospheric setup in a laboratory. Further, aerodynamics at earth’s surface cannot be easily explained by mathematics as it occurs in nature. A variety of factors like radiation, friction, flow pattern, chemical reaction, influence by biological setup, changing climate, changing weather, changing living style, new inventions, social changes, law of the land, attitude of the people, physiology of people, economic changes of the region together is responsible for the scenario at a given time at a given reason.
Due to complexity of problem, air pollution has not been thoroughly understood by many developing countries and is not a priority. Issues like the poor governance, low research capability, illiteracy, corruption, national/international conflicts and political instability has often cause of low attention to air pollution in spite that millions die due to air pollution all over the world. In spite of magnitude of the problem, the loss of life and wealth due to air pollution is invisible to many government servants. This could be attributed to low emotional intelligence of people responsible to serve the people who act as trustees of the country to protect interest of people and property of the country. Illiteracy among the citizens was also cause for not complaining about the pollution. The use of staff for other duties like election/census/sports has also one of the many reason for poor implementation of environmental laws. Many of the enforcing agency are worried about financial expenditure rather pollution control as misappropriation of financial resource could end up officer responsible for appreciation in jail. On the other hand, the unaccounted pollution is not at all fault as serious as financial misappropriation. The environmental laws can also be misused to raise funds or cause inconvenience to rivals by people in power.
As shown in Fig. 1.5, issues, causes, influencing factors and impacts of air pollution can be attributed to many aspects which are not quantifiable. The corruption among governance, low ethics among industries, non availability of technology, incapability to adopt new technology and low research capability plague many countries. In spite of enthusiasm shown by many international agencies to support the cause it is often denied or poorly adopted by beneficiary countries.

Mosaic of issues, causes, influencing factors and impacts of air pollution
The major sources of pollution are combustion process, industry, transportation, waste disposal, use of agro chemicals, and respiration of living organisms (Famhy et al. 2007). None of these sources can be avoided as they are meant for survival of the humans. Apart from these sources other sources like accidental fire; wind storms; natural disasters; education/research; decomposition of dead and decaying matter; wars; bursting of crackers; use of explosives; sports/events; testing/practicing of use of war weapons; launching satellites; volcanic eruption; construction; methane generation in rice fields due to biodegradation; demolition of buildings; methane generated by ruminant animals during digestion of food; painting; processing of grains; soil erosion and weathering of rock/minerals add to pollution. Service sectors like healthcare, software, Business Process out Sourcing (BPO) also contribute air pollutants while using equipments/air conditioners/transportation. Release of pathogens from health care establishment, animal rearing, slaughtering, and research can be far more detrimental compared to conventional pollutants.
Unlike war and crime effect of air pollution usually happen in slow manner taking years before actual impact is visible. Some of the acute impact in recent past like episode in Chernobyl and Bhopal has been faded away from memory of people due to other burning issues at individual regions. Common air pollution issues are discussed below.
1.1 Acid Rain
The term “Acid rain ” is commonly used to refer the wet (fog, rain, cloud water, snow, sleet, and dew) and dry (acidifying gases and particles) deposition of acidic components. In this regard, it is important to know that “Clean” or natural rain is also slightly acidic (but usually will not be lower than 5.6) due to carbonic acid carbonic acid formation in atmosphere according to the following reaction (Charlson and Rodhe 1982):
Due to this fact, pH value of 5.6 is considered as the pH of natural precipitation, below this value, the precipitation is called as acid rain. Sometimes, natural rain can also contain nitric acid formed due to electric discharge such as lightning. It can also have acidity due to organic acids contributed by vegetation (Galloway et al.).
Basically, acid-base reactions in the atmosphere determine the pH of precipitation. As we know that the atmosphere is highly oxidizing medium, gases such as SO2 and NOx are oxidised to sulphuric and nitric acids respectively. Such oxidation occur through homogeneous or heterogeneous pathways as described below
Oxidation of SO 2
Gas phase homogeneous oxidation reaction
Aqueous phase oxidation reaction
Homogeneous aqueous-phase oxidation of SO2 takes place by its dissolution and dissociation in water
At pH 2–7, most of the dissolved SO2 is dissociated into \( {{\text{HSO}}_{ 3}}^{ - } + {\text{H}}^{ + } \)
The \( {\text{HSO}}_{ 3}^{ - } \) is oxidized by H2O2 or O3 to H2SO4 depending on the acidity of the droplet. At pH < 5, H2O2 oxidation dominates while at pH > 5 oxidation by O3 and other catalytic reactions dominates.
Heterogeneous oxidation
However, SO2 is also oxidized through heterogeneous reactions involving calcareous soil dust and carbon soot
Infact, pathway of the reaction (1.8) is the major route of SO2 oxidation which controls occurrence of acid rain in dusty regions. The soil-dust which is generally dominated by CaCO3 effectively scavenge atmospheric SO2 forming calcium sulphate in the atmosphere (Kulshrestha et al. 2003). Due to this reason, in the regions where ambient levels of suspended particulate matter are very high violating the limits of National Ambient Air Quality Standards (NAAQS), the pH of rain water has also been reported very high (Kulshrestha 2013). In these regions, the levels of ambient SO2 are recorded very low due to same reason. Figure 1.6a Shows that even at higher sulphate levels, the pH of rain water is higher in Indian region but in the acidified regions such as United States, the pH of rain water is highly acidic decreasing with the increase in sulphate concentrations (Fig. 1.6b). This suggests that in the acidified regions, sulphate is present as sulphuric acid whereas in dusty regions, sulphate is present as calcium sulphate in rain water.

a Variation of rainwater pH with sulphate in India. b Variation of rainwater pH with sulphate in United States
Rain water dominated by crustal components or mineral dust such as calcite or dolomite or dolomite has lower acidity. Most of Indian soils have very high pH. The pH of rain water in India (Table 1.1) has been termed as the mirror image of the pH of soil of that area (Kulshrestha 2001). Long-term measurement in Lhasa, of Tibetan revealed that pH values, such as 8.36 were observed during 1987–1988 period due to alkaline as well as soil-borne continental dusts (Zhang et al. 2002). The pH of precipitation during 1979–1982, in Israel is mostly alkaline with pH 6.5 ± 0.8 (Mamane et al. 1987).
Oxidation of NO 2
NO2 is oxidized by OH
Such NO2 oxidation process is faster than SO2 oxidation by OH.
Further, through ozone and NO3 radical reactions, nitric acid is formed.
During daytime, NO3 radical is formed
During nighttime, NO3 radical so formed reacts with NO2 resulting in the formation of HNO3
HNO3 further reacts with dust and sea salt particles
Acid rain can damage monuments and buildings. Figure 1.7 shows the corrosion impact of acid rain on a statue and the roofing of a building. The damaged walls of the buildings and monuments leave a rough surface along with the moisture, which is a favorable place for the growth of microorganisms. Acid rain can corrode sculpture and architecture, railway tracks, paints of cars, and joints of bridges and flyovers.

Visible impact on statue and roofing due to acid rain
Global budgets of air pollutants
Over the past few decades, huge amount of coal and petroleum are consumed for meeting energy demand of mankind. Burning of such fuels has ended with the accumulation of excess concentrations of gaseous and particulate pollutants in the atmosphere disproportionately. As seen in Figs. 1.8 and 1.9, the sulphur and nitrogen global emissions from anthropogenic sources dominate over natural sources. Total 73–80 TgS per year is emitted by the anthropogenic sources against 25–40 TgS per year from the natural sources (excluding sea salt) (Berresheim et al. Berresheim et al. 1995). Around 11 Tg of NOx are emitted by the lightening, stratosphere and the soils representing the natural input of NOx. Fossil fule and biomass burning are the major sources of NOx which contribute around 40 Tg NOx per year (IPCC 2001). In addition, anthropogenic activities such as industries and automobiles also inject an array of metals and other chemicals in the atmosphere which ultimately have adverse effects on human health and the environment.

Global Sulfur emissions Tg/yr (based on data from Berresheim et al. 1995)

Global NOx emissions [based on data published in (IPCC 2001)]
Since 1751 industrial emissions have contributed 1450 gigatonnes of green hosue gases (GHGs). According to latest report published in Climate Change journal, 2/3 of these emissions (914 gigatonnes) are contributed by 90 companies across the globe (ref) out which 56 belong to oil and natural gas sector, 37 coal producers and 7 cement producers. Former USSR entities, Chinese government run entities, Chebron USA, Exxonmobil USA and Saudi Aramco Saudi Arabi have been the top emitters since 1751. List of top five companies include Chevron USA, ExxonMobil USA, BP United Kingdom, Royal Dutch Shell Netherlands and ConocoPhillips USA. Three Indian companies Coal India, ONGC and Singareni Collieries ranked at 15th, 41st and 58th places respectively.
The change in land use has also changed the generation and migration of natural air pollutants like volcanic ash, dust, pollen grains, spores, virus and bacteria. The changing climate has changed wind patterns leading to migration of pollutants in a pattern which was totally different as compared to past.
Global competition for creation of wealth and infrastructure has engulfed hills, river sand, minerals and rocks beneath the earth. The waste this activity created has contributed to methane, chemical pollutants yet to be identified and named. The new multistoried building has changed path air traversed before it was setup. The population explosion followed by urban migration has left agricultural fields barren and increased urban foot print within a span of few decades.
1.2 Global Warming and Climate Change
The “greenhouse effect ” is the rise in temperature of the Earth’s atmosphere due to the existence of Greenhouse Gases (GHGs) in atmosphere. Generally, the solar radiation received by earth drives the climate system. About 70 % of the incoming ‘short wave’ solar radiation is absorbed by the earth while around 30 % of it is reflected back to the space. When earth cools down, it releases the heat as long wave radiation. GHGs present in the atmosphere absorb this outgoing ‘long wave radiation’ from earth which enhances atmospheric temperature. Greenhouse is a phenomenon used in greenhouses to increase temperature capturing long wave radiation to facilitate optimum growth condition for plants. The term “Greenhouse” is borrowed to explain increase in temperature due to trapping of long wave radiation in the atmosphere. Swedish scientist Svante Arrhenius first time demonstrated global warming. Arrhenius (1896) who was awarded Nobel prize in chemistry in 1903 showed that a doubling of the atmospheric CO2 concentration would lead to 4–5 K warming of the earth surface due to greenhouse effect. GHG increase has resulted in an increase of 0.6 °C in global mean surface temperature since the 19th century. It is expected that this will further increase up to 1.4–5.8 °C by 2100. According to IPCC, GHGs have altered the climate in past few decades resulting in impact on food, water, economy, raw materials, plant/animal health, energy, and biodiversity. It is worth mentioning that the existence of most of biosphere is due to greenhouse effect. Fig. shows that without greenhouse effect Earth’s temperature would have been −17 °C (Fig. 1.10). A rise of >30 °C in the atmospheric temperature made human life possible on the earth. What worries is the sharp rise as seen during past few decades which has adverse direct and indirect effects such as global warming, sea level rise, monsoon disturbance, floods, cyclones etc.

Greenhouse effect showing its importance for sustainable temperature for biosphere
Net radiative forcing is affected by the presence of aerosols in the atmosphere . Aerosols can absorb or reflect radiation depending on the properties of aerosols. Dark aerosols such as soot absorb radiation and light colored aerosols such as sulphate reflect radiation. It is to be noted that the combined effect of present increase in CO2, N2O and CH4 would lead to an increase of atmospheric heating by 2.3 W m-2 which is 40 % lesser that of expected from observed increase in concentrations of major GHGs due to aerosol effect. However, aerosol radiative forcing calculations have huge uncertainties which need to be corrected. The higher uncertainties are primarily due to lack of measurements from the sites of different characteristics such as rural, background, urban, desert, forest, high altitude especially from tropical regions. Considerable uncertainties also exist in quantifying the role of dust aerosols in climate variability due to the difficulty in assessing direct and indirect effects of aerosols on clouds. Aerosols alter radiative balance as well as the cloud density of the atmosphere resulting in changes in atmospheric stability and cloud microphysics, which can either foster or suppress the development of clouds and precipitation (Li et al. 2011). Increase in particulate matter in the atmosphere can affect cloud development resulting in reduce precipitation in dry regions/seasons and increasing precipitation in wet regions/seasons.
Figure 1.11 shows Impact of climate change . Global warming is expected bring changes in weather patterns which may lead to disasters like storms, flood and droughts. GHG sources can be tracked to—Energy generation, Industry, Transport, Residential and commercial building, Land use change, Agriculture, Waste disposal. These activities have resulted in rise in GHGs over past decade. Combustion of fuel, degradation of organic matter in rice cultivation and waste disposal has contributed to GHG in addition to escape of GHGs manufacture in industries.

Impact of climate change
The naturally occurring GHGs are water vapor, carbon dioxide, methane, nitrous oxide and ozone . Table 1.2 gives major GHGs and their abundance and characteristics. Anthropogenic activity has increased the concentration of these GHGs and contributed gases like Perfluorocarbons and Hydroflurocabons (HCFs) (Ramesha et al. 2011). Some selected GHGs were phased out during execution of Montreal protocol.
Per capita CO2 emissions of different countries are shown in Fig. 1.12. Australia, USA Canada are the three top nations which have highest GHG emissions while China, Egypt and India contribute the least GHGs.

Per capita CO2 emissions of different countries based on 2010 emissions (Source based on information on www.economicshelp.org)
Overall, the consequences of global warming (especially indirect) would be region specific and can not be generalized. This will mainly depend upon overall tolerance of that geographical area against the change in atmospheric composition and circulations due to increase of GHGs and other pollutants. The increase in atmospheric temperature due to presence of GHGs in higher concentrations will not be uniform throughout the earth. The uneven temperature which is also cause for wind patterns across the globe will change both in direction and speed bringing shift in normal pattern of rain which means rains could come during harvest time and destroy crop and rain may not come at sowing season. Further the shortage of rain could cause drought in one region while excess rain could cause flood in other reason.
The excess temperature could favor reproduction of pests where as it could alter reproduction patter in plants and animals. Flowering date can be shifted and so as migration patterns of birds. Many endangered species would face hardship to survive due to a climate which may not be suitable for their living and breeding.
Rise in sea level due to excess water inflow due to melting ice caps in mountains as well as polar ice can submerge coastal area and bring in loss of economy. Due to climate change global land precipitation has increased by nearly 2 % since the beginning of the twentieth century (Jones and Hulme 1996; Hulme et al. 1998) and change is not uniform neither spatially nor temporally (Karl and Knight 1998; Doherty et al. 1999). As a result of climate change annual snow-cover extent (SCE) has decreased by nearly 10 % in Northern Hemisphere since 1966 mainly due to decline in spring and summer from the mid-1980s over Eurasian as well as American continents (Robinson 1997). The flood, storm, tornadoes, extreme temperate, cyclone formed due to climate change can trigger mass movement (land slide and avalanche) in hills and mountains leading to further disaster. The climate change has resulted in drought in north China and summer floods in south China. Change in precipitation pattern since 950 A.D. is mainly due to human-made absorbing aerosols.
Long range transport (LRT) and trans-boundary driven air pollution
Long range transport (LRT) and trans-boundary air pollution affect distance sites. Convention on Long-range Transboundary Air Pollution signed on 1979 is considered as pioneering international instrument which has paved the way for fruitful cooperation among 49 parties in Europe (Harald et al. 2004). Since, air has no boundaries, pollutants are transported globally from one geographic area. Several times remote and background sites are affected by LRT. There are examples where states having no air pollution sources are affected by LRT of pollution from distance or nearby countries or states. Rodhe (1972) demonstrated air pollution transport through air mass trajectory calculations and established that acid rain occurrence in Northern Europe was mainly due to industrial sources located in the south and west. Dust from The Thar Desert has been the primary potential source of particulate pollution in the Indian subcontinent. Also, the suspended particulate matter from the dust storms originated in Oman and other middle eastern regions has been reported to have influence on air quality in south Asia (Begum et al. 2011). Long-range transport of dust aerosols over the Arabian sea and Indian region has been reported by Badarinath et al. (2010). Kulshrestha and Kumar (2014) have reported LRT of pollution and its influence on rain water chemistry at Himalayan sites. According to the study, most of the acidic components such as sulphate and nitrate are transported from western airmasses and are deposited through precipitation having long term adverse impact on Himalayan ecosystem. Similarly, air pollution is the issue of transboundary transport of air pollution is an important issue between and within the countries. For example recent air pollution problem in New Delhi can be termed as transboundary pollution problem (Kulshrestha 2015). In 1990s, exhaust of diesel driven buses was mainly responsible for air pollution in Delhi city but after the Supreme Court decision, all the busses were replaced by CNG driven buses. This gave a big relief to the citizens of Delhi. But surprisingly, SO2 and NO2 levels were recorded extremely high during winter season of 2015 crossing 400 micrograms per cubic meter violating the NAAQS limit of 80 micrograms per cubic meter. Such observations were never reported in recent past winters. Such sudden increase can be explained on the basis of transboundary air pollution contributed by a number of new established brick kilns being operated in nearby states such as Uttar Pradesh, Haryana and Punjab (Kulshrestha 2015). In addition, diesel driven heavy duty trucks entering from outside of Delhi also contribute significant amount of carbon and sulphur oxides making Delhi air polluted (Gupta et al. 2015).
Global competition for creation of wealth and infrastructure has engulfed hills, river sand, minerals and rocks beneath the earth. The waste this activity created has contributed to methane, chemical pollutants yet to be identified and named. The new multistoried building has changed path air traversed before it was setup. The population explosion followed by urban migration has left agricultural fields barren and increased urban foot print within a span of few decades.
1.3 Ozone Layer Depletion
The abundance of ozone at a point in the stratosphere is controlled by production, destruction, and transport of ozone as well as other substance. The key mechanism for the generation of stratosphere ozone is the breaking of molecular oxygen by solar UV with wavelengths of less than 242 nm by photolysis to make nascent oxygen atoms which in turn combines with molecular oxygen to make ozone. Ozone destruction occurs by reactions of oxygen atoms with ozone and reactions involving certain naturally occurring species like nitrogen oxide radicals (NOx: mostly NO and NO2), odd-hydrogen radicals (HOx: OH and HO2), and/or halogen radicals. The natural Ozone concentration vary daily (due to changing weather); seasonally; and multiannually and interannually. The concentration of stratospheric ozone can be changed by anthropogenic activity. Chemicals in emissions from anthropogenic activities responsible for deletion of stratospheric ozone are called The ozone-depleting substances (ODSs). Since the 1970s it has been recognized that a numerous chemicals emitted by anthropogenic activities deplete stratospheric ozone.
In order to understand the impact on layer Ozone , National Oceanic and Atmospheric Administration (NOAA) has developed the Ozone Depleting Gas Index (ODGI) derived from NOAA’s measurements of chemicals containing chlorine and bromine at various remote surface sites around Earth’s surface. Index is defined as 100 at the crest in ozone depleting halogen profusion and zero for the 1980 level. Two different indices are derived one relevant for the ozone hole over Antarctica (the ODGI-A), and other relevant to ozone layer at mid-latitudes (the ODGI-ML).
ODGI-A in 2013 was 85.7 and ODGI-ML in the beginning of 2013 was 63.3. 1980 benchmark halogen level over Antarctica will be reached sometime around 2070 considering and that over mid latitude will be reached sometime in 2045(Daniel et al. 2011). ODS restricted by the Montreal Protocol, were declining in the atmosphere by 2013 with notable exceptions being halon-1301 (a bromine-containing chemical used mostly in fire extinguishers) and HCFCs, that are used as substitution for CFCs in various applications. Decline in reactive halogen concentrations are mainly due to the rapid phase-out as well as atmospheric decline of short-lived ODGs such as methyl bromide and methyl chloroform (Montzka et al. 1999, 2003). The reduction related to CFC-11 as well as CFC-12, has been less because of continuing emissions as well as their lifetimes are long (50–100 years). Though concentrations of HCFC’s continue to rise in the background atmosphere production is not scheduled for a total phase-out until 2030.
Main pathways of ozone destruction are
-
Hydroxy radical (OH)
$$ ^{ \cdot } {\text{OH}} + {\text{O}}_{3} \to {{\text{ HO}}_{2}}^{ \cdot } + {\text{ O}}_{2} $$$$ {{\text{HO}}_{2}}^{ \cdot } + {\text{O}} \to {^{ \cdot } {\text{OH}}} + {\text{O}}_{2} $$$$ {\text{Net : O + O}}_{3} \to \, 2{\text{ O}}_{2} $$ -
Chlorine and bromine radical (Cl and Br)
$$ {\text{Cl}}^{ \cdot } + {\text{O}}_{3} \to {\text{ClO}}^{ \cdot } + {\text{ O}}_{2} $$$$ {\text{ClO}}^{ \cdot } + {\text{ O }} \to {\text{ Cl}}^{ \cdot } + {\text{ O}}_{2} $$$$ {\text{Net}}:{\text{ O}} + {\text{O}}_{3} \to 2{\text{O}}_{2} $$ -
Nitric Oxide (NO)
$$ {\text{NO}} + {\text{O}}_{3} \to {\text{NO}}_{2} + {\text{O}}_{2} $$$$ {\text{NO}}_{2} + {\text{O}} \to {\text{NO}} + {\text{O}}_{2} $$$$ {\text{Net}}:{\text{O}} + {\text{O}}_{3} \to 2{\text{O}}_{2} $$
The Montreal protocol adopted in Montreal in 1987, [and subsequently amended in London (1990), Copenhagen (1992), Vienna (1995), Montreal (1997) and Beijing (1999)] control of production and consumption of ODS.
Nitrogen oxides from natural and anthropogenic activity catalytically destroy ozone through following reaction (Crutzen 1970; Jonston 1971).
The relative contributions of ODSs to depletion of ozone layer are quantified by ozone depletion potential (ODP). In spite of many similarities between N2O and ODSs it is not considered to be an ODS in Montreal Protocol (Ravishankara et al. 2009).
1.4 Atmospheric Brown Cloud
Air pollution transported across the continents as well as ocean basins has resulted in trans-continental and trans-oceanic plumes of atmospheric brown clouds (ABCs) made up of sub micron size aerosols. ABCs interrupt sunlight by reflecting and absorbing reflecting resulting in large surface dimming. On the other hand, black carbon as well as some organics augments atmospheric heating increasing global warming. Black carbon is mainly emitted due to Wildfires; and combustion of Biofuel , Coal , Diesel and Gasoline . As per Ramanathan and Feng (2009) ABC warms atmosphere at elevated levels from 2 to 6 km, resulting in retreating of glaciers as well as snow packs in the Hindu Kush-Himalaya-Tibetan glaciers. Aerosols may nucleate additional cloud droplets enhancing dimming effect (Fig. 1.13). The dimming decreases evaporation of water from the earth’s surface, slowing down the hydrological cycle. According to some studies, in South Asia due to ABC dimming north-south gradients in sea surface temperatures as well as land–ocean difference in surface temperatures, have slowed down the monsoon circulation and reduced rainfall over the continents. The following figure shows global estimates of dimming.

Global dimming estimates (Ramanathan and Carmichael 2008)
1.5 Impact on Flora and Fauna
Impact of air pollution on flora can be observed in the form of discolourations of the leaf due to internal cellular damage thereby reducing the market value of agricultural crops such as tobacco and spinach where visibility is important. The air pollution can also result in reduction of the leaf surface and can provide points of entry for pathogens. Air pollutant can affect plant physiological or biochemical processes resulting in significant loss of growth/yield as well as changes in nutritional quality (Ashmore and Marshall 1999).
SO2 entering leaves through stomata are absorbed by mesophyll (cells between the lower and upper epidermis layers of a leaf) of leaves causing toxicity due to reducing property of gas. When the limiting concentration exceeds the cells are inactivated by plasmolysis and then killed.
Many industries that emit fluorides like aluminium reduction; smelting of iron and non-ferrous ores; ceramics and phosphate reduction as well as phosphate fertilizers. The fluorides are emitted due to volatilization of molten cryolite in aluminium industry and volatilization fluoride which may present as impurity in raw material in other industry. Fluorides are of great concerns with respect to air pollution as all fluorides tend to accumulare in forage and build up concentration which causes fluorosis when consumed by cattle or sheep. Further hydrogen fluoride and silicon tetrafluoride are toxic to some plants even at the concentration as low as 0.1 ppb (Thomas 1961).
Air pollution has been recognized as reason for injury to vegetation in Europe and North America in the past few centuries. Entire forest communities were lost up to 15 km downwind of the smelter complex located at Sudbury, Canada in 1900s due to SO2 and metal emissions with other ecological effects observed at a greater distance (Winterhalder 1996). The areas where cells are killed collapse and dry up. If only few cells in an area are injured the area will become chlorotic (yellowing or whitening of usually green plant tissue due to decreased amount of chlorophyll) or brownish red in color.
The lesions (abnormality in the tissue) due to ozone are usually confined to upper surface and are uniformly distributed as brown or white flecks or stipples or blotches. Ozone flecking was observed on grape, avocado, citrus, and other broad leaf plants in outlying regions of Los Angels Valley as well as surrounding hills(Thomas 1961).
Among the many mechanisms by which Foot and Mouth disease can be spread by transport of virus through the wind. Even though this is uncommon infection can be carried across borders and seaways (Donaldson and Alexandersen 2002).
Air pollutants affect photosynthesis and respiration of plants. The effect differs from species to species and each species will have threshold limits after which it is vulnerable for adverse effect. The pock mark type injury on the upper side of leaf has been attributed to acid aerosols associated with fog as it contains acid and other toxicants.
The NOx concentration in atmosphere is too low to cause plant damage. Chlorine is around three times phytotoxic as SO2. Hydrogen chloride at a concentration of 10 ppm for few hours can cause pant damage. Ammonia has around same phytotoxicity as HCl. H2S is slightly phytotoxic (Thomas 1961).
Land use change triggers air pollution
The change in land use has also affected the production and transport of natural air pollutants like dust, pollen grains, spores, virus and bacteria. Vegetation cover is drastically reduced in the urban areas due to sudden increase in built area. Developing countries are facing significant air pollution impact of land use change due to rapid urbanization. More significant effect is seen due to expansion of the cities for housing purpose which emits a huge amount of dust during the construction of buildings. The emissions of air pollutants from these residential colonies become a continuous source of polluted air. According to the data, about 60 % of agricultural land in Delhi has been transformed into nonagricultural area resulting in decrease in net sown area from 85,000 to 46,000 ha (Mohan et al. 2011). Same is the case for most of the cities. The urban dust has been reported highly rich in carbon and sulphate (Kulshrestha et al. 2005; Kumar et al. 2014; Gupta 2015). Dust sulphate significantly affect various biochemical constituents and the morphology of the plants (Gupta 2015). Figure 1.14 shows an increase in Ascorbic acid and Proline content of foliar with the increase in sulphate levels correlating with the increase in stress level. More severe effect is reported for the industrial area as compared to the residential areas due to more stress of pollutants at industrial site which affects plant physiology and morphology. Soil dust coming out from the digging of land and the construction activities could be the sources of microbes. The relationship between different types of house dust and the concentration of fungi has reported by Kaarakainen et al. (2009).

Increasing concentrations of AsA with increasing dust flux of \( {\text{SO}}_{4}^{ - } \) at JNU and SB sites (Source Gupta 2015)
Investigation of animals following the air pollution at Donora, Pennsylvania in 1948 disclosed that many animals were ill and died during the week of smog. Dogs were most susceptible species during the episode with 15.5 % reported to be sick and 10 canine deaths. Investigators attributed canine sickness to three syndromes—Signs of respiratory syndrome, digestive syndrome, and anorexia (poor apatite). 40 % of the birds affected by episode died. During the London fog in 1952 a number of prise cattle were severely affected. Five of the cattle died where as 11 were subjected to emergency slaughter. Post mortem examination revealed emphysema, bronchiolitis and right heart failure. Hydrogen sulphide released during pollution disaster in 1950 at Poza Rica, Mexico was responsible for death of 100 % canneries and about 50 % of the other exposed animals in the area. The important long-term effect due to air pollution of radioactive substance are cancer; shortening of life span, and genetic or mutation effect (Catcott 1961).
Health forests across the world is being affected by Air pollutants due to increasing tropospheric ozone concentrations, raise atmospheric carbon dioxide concentrations, as well as acidic precipitation. Emissions of sulphur dioxide, oxides of nitrogen, and other pollutants like ammonia affect forests in rapidly industrializing areas. Increasing levels of UV-B radiation from stratospheric Ozone depletion are possibly a threat to health of forest (Percy and Ferretti 2004).
Bioaccumulation and Biomagnification of chemicals in food web would further worsen the ecological balance. Bioaccumulation is an increase in the pollutants concentration over time in a biological organism. Compounds accumulate in living organisms as they are stored faster than they are disintegration or excretion. Biomagnification is raising accumulation of a pollutant in living beings as it moves from one level to other in a food chain.
Lead which is now drastically reduced in ambient air in many parts of the world is toxic to flora, fauna and micro-organisms and bioaccumulates in most organisms. Generally, 0.5 ppm of lead in the blood of water birds is considered toxic although toxic symptoms may appear at 0.2 ppm lead. Lead in at 5.0 ppm or more in liver of water birds is considered to be lethal. Reduced survival has been reported for some sensitive species of birds, at of 75–150 ppm body weight. Further, dietary levels of 50 ppm affect reproduction. Mortality during experimental studies in water birds normally occurs at dose concentrations of 20–40 ppm lead in with lethal levels varying from doses of 5–80 ppm (UNEP 2010). Lead concentrations of 100–1000 mg/kg soil cause visible effects on, growth, photosynthesis or other parameters (IPCS 1989).
1.6 Impact on Crop Yield
Crop failure can occur due to—(a) impact of air pollutants on crop’s health, (2) climate change , (3) UV ray penetration due to damage to ozone layer. Figure 1.15 shows dust deposition on the three. Such deposition is likely to cause impact on health of tree depending on the constituents of dust. Ozone is the most destructive air pollutant to crops as well as ecosystems (Heagle 1989) as it is a strong oxidant. Surface level Ozone is a secondary air pollutant created in the atmosphere from the oxidation of NOx under bright sunlight as well as volatile organic. Ozone as well as its secondary byproducts damage plants by reducing photosynthesis as well as other physiological functions, resulting in weaker, undersized plants with inferior crop quality and decreased yields (Fiscus et al. 2005; Booker et al. 2009; Avnery et al. 2011).

Dust deposition on the three
Crops next to thermal power plants in India suffered most in past decades due to inefficient air pollution control equipments which emitted fly ash that deposited on the crop. The pollution during mining, construction roads and operation of hot mixing plats in developing countries have resulted damage to crop to great extent.
1.7 Impact on Material
Air pollution damages materials and involved three components—expenditures to repair, preventive measures, and loss of amenity. Impact of materials fall into four categories: soiling, material loss, discoloration, and structural failure.
The atmospheric corrosion of materials depends on acidification of the air, due to gases such as SO2 and HNO3. As per the reviews damage to siliceous stones is not significant, and therefore attention is restricted to calcareous stones (Harter 1986; Lipfert 1987; Lipfert 1989; NAPAP 1990;).
Impact on Material Sulphuric acid aerosols attack building material mainly those containing carbonates like marble (Fig. 1.16, 1.17 and 1.18), limestone, slate and mortar which can be explained by following equation.

Marble within siliceous stones damaged due to air pollutants

Intricate carvings being washed away due to air pollution

Build up salts after attack of acidic air pollutants on marble used for flooring
The Calcium Sulphate formed is washed away.
The deterioration of calcareous stone can be explained in three stages: Simple dissolution of calcium carbonate; dissolution of calcium carbonate followed by the fall-out of less soluble particles; and steady build-up of salts if the calcium carbonate is not washed away.
Statues and other ornamental material may get discolored due to deposition of air pollutants. Figure 1.19 shows statues covered with plastic covers in Bangalore, India to avoid dust deposition and soiling of statues. Mortar contains sand, calcium hydroxide as well as other carbonate phases. Cement in concrete is susceptible to acid attack leading to discoloration/soiling (Fig. 1.20), surface erosion, spalling and corrosion of embedded steel. Damage to reinforced cement concrete structure will be insignificant if the steel is provided with sufficient cover of good quality concrete.

Statues covered with plastic covers in Bangalore, India to avoid dust deposition and soiling of statues

Soiled walls and roofs in coastal area
Paint and polymeric materials can be affected due to acidic deposition as well as photochemical oxidants, particularly ozone . Impacts on this material include erosion of polymer surfaces, loss of gloss and soiling, interaction with sensitive pigments and fillers loss of paint adhesion from and substrates. Contamination of substrate before to painting can lead to premature failure due to embrittlement and cracking.
Atmospheric corrosion of metals (Fig. 1.21) is an electrochemical process occurring when the surface is wet. Corrosion rate mainly depends on humidity, precipitation, temperature as well as levels of atmospheric pollutants. SO2 causes most damage, on metals even though chloride plays play a significant role in coastal area.

Corroded steel structure
As per the studies conducted by Tzanis et al. (2011) in Athens, Greece metal and alloy specimens exposed the highest weight change is observed for unalloyed carbon steel at the level of 18 m, and lowest weight change was observed at 6 m. Values of weight change for zinc and copper specimens were about four times lower than steel and almost constant with the height. The weight loss of unalloyed carbon steel was found to be more than 15 times higher than other materials. Copper and bronze suffered less by atmospheric corrosion with almost equal mass loss. Zinc mass loss was nearly 70 % greater than that of copper and bronze.
Sulfuric acid mist can damage, nylon, cotton, linen and rayon. Excess exposure to SO2 accelerates corrosion of metals. Hydrogen fluoride will corrode many substances except polyethylene, lead, wax, and platinum.
1.8 Impact on Human Health
Human health can be adversely affected by air pollution depending on the pollutant, quantity of pollutant and path of entry into body. Human receptors include the eyes, nose, skin, or respiratory system. Eye is more susceptible to damage as well as irritation compared to the skin.
Figure 1.22 shows common forms of exposure response relationship. Relationship between the level of exposure (or dose) as well as the degree of effect (or response) usually occur in four ways: (1) effect/response increases with exposure without threshold, (2) effect/response increases with exposure with threshold, (3) effect/response versus exposure takes curvilinear shape, or (4) effect/response versus exposure takes S-shape (David 2003)

Common forms of exposure response relationship
The clinical course of a disease is shown in Fig. 1.23. The living organism after exposing to disease casing factor like air pollutant can either recover or recover with disability or die. Before end results human beings usually starts therapy as soon as symptoms of disease appear. The disease need not have to occur only to organs exposed to air pollutants. The toxins easily get absorbed by blood and varied to all parts of the body. For example chronic inhalation of cyanide compounds affects central nervous system, cardiovascular system, thyroid gland, respiratory system, eyes as well as skin.

The clinical course of a disease
Some gases like SO2 cause irritation and some gases like acetylene and Carbon Monoxide cause asphyxiation (cause death without significant physiological effect). Carbon monoxide causes a chemical asphyxiation since it impairs the oxygen transport in blood vessels as affinity of CO for haemoglobin is three hundred-fold more than oxygen.
Lead in air can cause severe health damage as it is toxic at very low exposure levels. Organo-lead compounds, like tetra-alkyl-lead and tri-alkyl-lead compounds, are more toxic compared to inorganic forms of lead. Lead has acute as well as chronic effects on health of humans as it is a multi-organ system toxicant. It can cause neurological, gastrointestinal, haematological, cardiovascular, renal, and reproductive effects. The severity and type of effects depend on the duration, level, and timing of exposure. Accumulated Lead in bone may become source of exposure later in life (UNEP 2010).
The evidence indicates humans who are responsible for air pollution are adversely affected. Children’s health is adversely affected due to air pollution due to incomplete metabolic systems, ongoing process of lung development and growth, high rates of infection by pathogens immature host defenses, and activity specific to children can result in higher exposure to air pollution (WHO 2005).
Figure 1.24 shows impact of air pollution on human health. Figures 1.25, 1.26, 1.27, 1.28 and 1.29 shows lungs affected by air pollution. Figure 1.30 shows food items exposed to atmosphere are often contaminated with air pollutants leading to food spoiling. The lung of developing fetal and the infant is more vulnerable to injury by lung toxicants. Air pollutants interact with environmental exposures, like allergens, viruses as well as diet that influence the effect of air pollutants on health. Four million deaths between 1997 and 1999 all over world were due to respiratory infections (WHO 2000). Particulate and gaseous pollutants can act on upper and lower airways to initiate as well aggravate cellular inflammation.

Impact of air pollution on human health

Complex network of tubes in lungs traps most of the pollutants entering into lungs

Section of lung showing deposit of black particles in tubes of lungs

Un-sectioned lung with particles trapped in alveoli

Section of lung uncoated with pollutants

Section of lungs affected by cancer (cancer tumours are visible as light colored patches)

Food items exposed to atmosphere are often contaminated with air pollutants leading to food spoiling
Nasal allergy to pollen is termed as pollinosis, and allergy particularly to grass pollen is termed hay fever. Plants whose pollens are dispersed by air currents are called Anemophilous and such plants generate large quantities of lightweight pollen which are carried for great distances bringing it into contact with nasal passages.
Air pollutants can get into the body through food contamination through food or water exposed to polluted air. Pollutant entering into body can remain on skin or in the respiratory/digestive system or move into the blood. Pollutants entering the bloodstream can be transported to all body parts. As pollutants moves through the body it can undergo many chemical changes, becoming more or less toxic (Figs. 1.26 and 1.27).
The contamination of Meuse River Valley of Belgium resulted in death of 63 people in the first week of December 1930. The findings of investigation revealed that weather patterns had a major impact on sulfur dioxide concentrations, especially during temperature inversion (Shy 1978). Air pollution along the Monongahela River near Pittsburgh, USA in October 26, 1948, resulted in death of 20 people due to cardiac as well as respiratory diseases (Goldsmith and Friberg 1977).
As per Ostro (2004) outdoor air pollution was accounted for approximately 1.4 % of total mortality and it is the cause for 0.4 % of all disability-adjusted life years (DALYs) as well as 2 % of all cardiopulmonary disease.
In estimates released by WHO (2015a), around 7 million people died in 2012 as a result of air pollution exposure. This confirms that air pollution is now the world’s largest single environmental health risk.
As per the WHO (2015b), 4.3 million deaths related to household air pollution in 2012. 1.69 million deaths occurred in the South East Asia and 1.62 million deaths occurred in Western Pacific regions. About 600,000 deaths occurred in Africa, 99,000 in Europe, 200,000 in the Eastern Mediterranean region, 81,000 in the Americas and 19,000 deaths occurred in high income countries.
In 2012 a total 3.7 million deaths linked to Ambient Air Pollution (WHO 2015c). 1.67 million death occurred in Western Pacific region and 936,000 deaths occurred in South East Asian. About 236,000 deaths occured in the Eastern Mediterranean region, 200,000 in Europe, 58,000 in the Americas, 176,000 in Africa, 280,000 in high-income countries of Europe 94,000 in Americas, 67,000 in Western Pacific, 14,000 in Eastern Mediterranean (14,000).
Breakdown by disease due to Ambient Air Pollution are: (1) 40 %—ischaemic heart disease; (2) 40 %—stroke; (3) 11 %—chronic obstructive pulmonary disease (COPD); (4) 6 %—lung cancer; and (5) 3 %—acute lower respiratory infections in children (WHO 2015a, c).
Breakdown by disease due to Household Air Pollution are: (1) 34 %—stroke; (2) 26 %—ischaemic heart disease; (3) 22 %—COPD; (4) 12 %—acute lower respiratory infections in children; and (5) 6 %—lung cancer (WHO 2015a, b) (Fig. 1.28).
Lung cancer is one the leading reason of cancer death in both men as well as women. Apart from smoking air pollution is one of the main reason. Cancer can originate from lung or other parts of the body. Cancer originating from lung cells is known as primary lung cancer. It can start in the bronchi) or in the alveoli. As per studies by Siegel et al. (2013) lung and bronchus cancer would cause death of 28 % of male cancer patients and 26 % of female cancer patients in USA.
Smoking key reason of lung cancer (U.S. Department of Health and Human Services 2004), other causes include radon (National Academy of Sciences 1999) secondhand smoke (U.S. Department of Health and Human Services 2006) and air pollutants like benzene, formaldehyde, as well as Asbestos. The size of lung may increase (due to increase in mucus) or collapse partially/wholly due to lung cancer.
Many people affected due to SARS (severe acute respiratory syndrome), Avian flu and Swine flu due to transmission of virus through air in last decade.
Diesel and gasoline exhaust are probably and possibly carcinogenic to humans (IARC 1989) and children living near places with high traffic density have more risk of cancer (Savitz and Feingold 1989).
More than 4,000 people lost their lives in the year 1950 due to deadly acute air pollution that occurred due to temperature inversion over London. More than 4000 people lost their lives instantly due to methyl isocyanate poisoning in 1984 and hundreds of thousands were disabled permanently.
Dioxins and furans created during manufacture of certain chemicals like herbicides; pulp and paper industry during bleaching the wood pulp; burning waste (like municipal solid waste and medical waste) or substance which has chlorine; Secondary Copper Smelting; Forest Fires; Cement Kilns; Coal Fired Power Plants; Residential Wood Burning; burring bodies in crematorium or open fire. Dioxins and furans are known carcinogens and can change hormone levels. High doses of dioxin can lead to skin disease called chloracne. Dioxins and furans can bring changes in development of the fetus, decrease ability to reproduce and suppress immune system. Mercury which is emitted from combustion of coal and waste/substance with mercury can lead to Neurological and behavioral disorders, Kidney disorder ranging from augmented protein in the urine as well as kidney failure.
Aerobiology plays an important role in the spreading of infectious diseases. Aerobiology is the study of the course of action involved in the microorganisms’ movement in the atmosphere from one location to another. Airborne particles can remain in air for many days (Wells 1934; Wells and Stones 1934; Duguid 1946). Large quantities of infectious pathogens expelled in hospitals can spread via airborne. Blockage of sunlight due to air pollution can promote spread of harmful microbe in atmosphere resulting in spread of infection.
Epidemiological studies have revealed that exposure to air pollutants during fetal development as well as early postnatal life is connected with numerous health problems including very low birth weight (VLBW); low birth weight (LBW); congenital defects; intrauterine growth restriction (IUGR); preterm birth (PTB); behavioural problems, intrauterine and infant mortality; decreased lung growth, childhood asthma, increase in rates of respiratory tract infections, and neurocognitive decrements (Wang and Pinkerton 2007).
Silicosis due to inhaling silica particles and asbestosis due to inhaling asbestoses is long known to scientific community. Studies by Kathleen and Boguang (1996) revealed that occurrence rates of silicosis increased by years of dust exposure.
PM air pollution increases risk for cardiovascular diseases (Miller et al. 2007; Pope et al. 2004) and people with diabetes are more susceptible to cardiovascular health effects connected with PM air pollution (O’Neill et al. 2005; Whitsel et al. 2009; Ursula et al. 2010).
Certain microorganisms, transforming a less toxic species into toxic derivative like produce methyl iodide, which reacts with substance like mercury, arsenic, selenium, and tellurium to form their methyl derivatives by process is known as methylation.
1.9 Black Snow and Muddy Snow
Black snow and outbreak of red-tide in lacustrine systems was observed during early 1991 in the Kashmir Himalayan valley, India. The occurrence of muddy snowfall in May 2002 at more than 4300 m above sea level in Afarwat glaciers of Kashmir, India has been attributed to changing environmental scenario of the region (Lone et al. 2010). The occurrence of “Black Snow” on the mountain peaks of Gund, Sonamarg in Kashmir, India observed in March, 1991 was due to the burning of oil-fields for the period of Gulf war (Kawosa 1991).
Occasional muddy rains were also observed in some regions of the Kashmir valley in April 2002 (Lone 2010). The occurrence of muddy snowfall in the alpine zone of Kashmir Himalaya evoked environmental concern as it has bearing on drinking water supplies as well as ecology of many natural snow-fed streams. The chemical composition shows that the particulate deposition approximately comprises 78 % of Lime stone, 20.5 % of Clay, 5 % of Gypsum and 1.5 % of Iron ore. Such a chemical composition suggests that these particulates might have origin from stone quarrying activities or cement manufacturing units.
Air pollution contributes substantial quantities of contaminants to snow. The Asian part of the Russian Federation as well as Europe contributes all but a minute percentage of the lead reaching the Arctic through air out of which 95–99 % is anthropogenic (UNEP 2010).
1.10 Water Pollution
Most of the air pollutants in atmosphere either settles down itself or get scrubbed by rain/snow/hail/dew unless otherwise it reacts with other pollutants to from secondary pollutants or absorbed/adsorbed by other living/nonliving things. The pollutants entrapped in precipitation would either stay in snow for year to come or reach surface/ground water bodies over the course of time. The material settled on the surface of solid bodies also gets washed over course of time. The acids/alkali formed in the atmosphere can dissolve chemical on the surface of the earth before reaching the water bodies. The water not only gets contaminated due to conventional pollutants, it also scrubs radioactive material released into atmosphere. Rainwater was collected in the Nijmegen area of Netherlands after Chernobyl accident, in first three weeks of May 1986 revealed presence of radioactive material (Dennis 1987). Summarises the findings of studies of rainwater from Scandinavia and Great Britain after Chernobyl accident shows that the issue is far from easily understood (Lucas and John 1987).
The organic compounds with diverse chemical structures, sources, as well as uses such as industrial compounds, pesticides, persistent degradation products, byproducts of fossil fuel combustion , and impurities during manufacture of chemicals are transported atmospherically and deposited into remote environments. Such deposition can affect plants and animals including human health.
Nitrogen controls productivity and eutrophication of estuaries. Elevated nitrogen inputs to water bodies leads to harmful algal blooms; loss of sea grasses; hypoxic and anoxic bottom waters; and reduced fish stocks (Valiela and Costa 1988; Hallengraeff 1993). These eutrophication problems are consequence of increased population growth and air pollution (Lee and Olsen 1985; Nixon 1995; Vitousek et al. 1997). A significant nitrogen inputs to estuaries in New York may be due to atmospheric deposition (Jaworski et al. 1997).
Lead is important for scientific community in environmental science as may enter surface waters due to erosion of lead-containing soil though lead is not very mobile in soil (UNEP 2010). Estimated residence times of biological particles with lead in surface waters, up to two years(UNEP 2010).
1.11 Soil Pollution
Many of the air pollutants do not remain in atmosphere for ever. Most of the air pollutants will settle on soil or water causing soil and water pollution. Airborne pollutants from anthropogenic as well as natural sources deposit on land and water bodies. Air pollutants can travel to great distances from the source. Pollutants in soil and water bodies include nitrogen compounds, heavy metal, sulfur compounds, pesticides, and other toxics.
Airborne pollutants can fall to the ground simply due to gravity. Such deposition is termed as “air deposition” or “atmospheric deposition”. Mercury extracted for centuries from sulfide ore or cinnabar has become a global pollutant. Mercury can be released into the atmosphere from many anthropogenic activities, such as municipal trash incineration, combustion of high sulfur coal which contains cinnabar, use of mercury based fungicides. Mercury has low reactivity in its elemental state and has long atmospheric residence time while the oxidized forms are removed by wet/dry deposition (Fogg and Fizgerald 1979).
Oxidized reactive gaseous mercury is very soluble in water and hence is effectively deposited on water and land by rain/snow/hail/due. Particulate forms of mercury settle as dry deposition (Keeler et al. 1995). The total quantity of mercury in the atmosphere is around 5000–6000 metric tons, and nearly 50 % of that was produced by human activities (Fitzgerals and Watras 1989).
Concentrations mercury in atmosphere peaked between 1960s and 1970s (Engstrom and Swain 1997). Anthropogenic activities contribute 70–80 % of the gross annual mercury emissions and 95 % of mercury vapor exists as elemental mercury (Fitzgerald 1995). Rest of the mercury exists as reactive gaseous mercury as complexes of divalent mercury, and/or in the organic form (Stratton and Lindberg 1995).
While deposition of \( {\text{H}}^{ + } \), \( {{\text{SO}}_{4}}^{2 - } \) and \( {\text{Ca}}^{2 + } \) in numerous Central European forests has declined in the last decade, deposition of \( {{\text{NO}}_{3}}^{ - } \) and \( {{\text{NH}}_{4}}^{ + } \) remained high or increased resulting in depletion of soil Al-pools, release of \( {{\text{SO}}_{4}}^{2 - } \) formerly stored soil, accumulation of nitrogen in soil increasing nitrogen availability to trees and reducing \( {\text{Ca}}^{2 + } \) concentration in the soil. Soil acidification as well as increased nitrogen availability will decrease the fine root and change the rooting zone to upper layers of soil. Such shift in rooting zone will decrease the root/shoot ratio causing increased drought susceptibility of trees (Matzner and Murach 1995).
Thirty-three years study of atmospheric heavy metal deposition in Denmark along with European emission inventories revealed concentrations of lead, cadmium, copper, zinc, vanadium, nickel and arsenic in soil at remote forest plantation on the island of Laesoe, Denmark. The accumulation of heavy metals was more in the top soil (Hovmand et al. 2008).
Deposition of particles from mineral processing and stone crushing can settle on soil leading to change in quality of top soil. The escape of materials which include by-product and products from chemical industry can contaminate soil to great extend.
As per data published by UNEP (2010) concentration in soil next to roadways and in towns was up to several thousand mg Pb/kg, and soils adjacent to smelters as well as battery factories were up to 60,000 mg Pb/kg.
1.12 Loss of Economy
Study of production, distribution as well as consumption of goods and services is called economics. An economic system of a region or nation is referred as economy. The economy differs widely between, and within, countries due to differing environments, cultures, and government systems.
The direct consequences of air pollution can cause millions of dollars if measured in terms of cost of treatment to heal sickness, lost productivity, missed educational/development opportunities. The economic loss due to climate change and disasters triggered by air pollution can take away good share of Gross Domestic Product (GDP) of any country.
Even though air pollution is spread across the world, it is most severe in cities of developing countries (David et al. 1996). But considering the spatial distribution, it is difficult to generalize the issue. Every country will have pockets of polluted areas as well as clean area. But developing world has disadvantage of high population growth rate in cities and poor infrastructure. It means poorly paved roads which rises dust increasing suspended particulate matter. The adulteration of fuel and old vehicles would add smoke to atmosphere . Air pollution in cities of developing countries can cost the nation after a decade due to unhealthy senior citizens. The immediate air pollution threat can come due to loss of tourism and crop. The soiled buildings, corroded structures and degraded construction material due to increase in acidic air pollutants can cost the owners a hefty amount even though it contributes to GDP of a country.
Fires to clear forest to accommodate large scale rubber and oil palm plantations in Indonesia resulted in major air pollution in Asia during April to November of 1997 due to wide spread of forest fires. The disaster was cause of thick smoky haze which covered Indonesia, Malaysia, Singapore, Brunei, Southern Thailand and Philippines. The fires destroyed a large area of rainforest that included endangered species. While the fire destroyed commercial timber, plantations and farmland, air pollution resulted in tourism. The smoke was also cause of temporary shutdown of industry and commerce as well as increase in health care costs. Much mortality occurred Malaysia in the period due to air pollution from Indonesia.
As per, Teresa and Leonardo (2013) reduced cognitive potentials due to preventable childhood lead exposure translate into economic losses of $134.7, $699.9, and $142.3 billion international dollars at Africa, Asia, and Latin America/Caribbean, respectively amounting to 1.20 % of the global GDP. Lifetime economic productivity (LEP) associated due to childhood lead exposure in Low and Middle Income Countries (LMIC) currently amounts to $977 billion annually (Teresa and Leonardo 2013).
1.13 Visibility
Visibility is the maximum distance in a given direction at which an object can be visually recognized with unaided eyesight (Wark et al. 1998). The destruction of visibility is mainly due to the absorption and scattering of visible light by suspended particles (Chan et al. 1999).
PM2.5, are believed to be mainly responsible for the scattering of visible light (Sloane et al. 1991). Fine particulate matter is the main pollutant in the majority urban areas in China (Zhang et al. 2009, 2013) and other countries. Hence it has acquired worldwide attention for its bad impacts on visibility (Ghim et al. 2005) as well as public health (Hong et al. 2002).
The visibility is affected by meteorology and concentration of pollutants. As could be seen from Figs. 1.31 and 1.32 the visibility is not affected much at 6.00 AM clock due to less traffic and low concentration of pollution. At 7.00 AM as the number of vehicles on road increased visibility decreased as concretion of suspended particles in atmosphere increased and low temperature hindered dispersion of pollutants. At 1.00 AM the pollutants dispersed mainly due to increase in temperature and therefore dispersion of pollutants.

Reduced visibility with time 6.00 AM, 7.00 AM, 1.00 AM on clear day in one of the location in Bangalore

Reduced visibility with time 6.00 AM, 7.00 AM and 1.00 AM on clear day in another location in Bangalore
References
Arrhenius, S. (1896). On the inûuence of carbonic acid in the air upon the temperature of the ground. The London, Edinburgh and Dublin Philosophical Magazine and Journal of Science, 41, 237–276.
Ashmore, M. R., & Marshall, F. M. (1999). Ozone impacts on agriculture: An issue of global concern. Advances in Botanical Research, 29, 32–52.
Avnery, S., Denise, L. M., Liu, J., & Horowitz, L. W. (2011). Global crop yield reductions due to surface ozone exposure: 2. Year 2030 potential crop production losses and economic damage under two scenarios of O3 pollution. Atmospheric Environment, 45, 2297–2309.
Badarinath, K. V. S., Kharol, S. K., Kaskaoutis, D. G., Sharma, A. R., Ramaswamy, V., & Kambezidis, H. D. (2010). Long-range transport of dust aerosols over the Arabian Sea and Indian region—A case study using satellite data and ground-based measurements. Global and Planetary Change, 72, 164.
Begum, A., Biswas, K., Pandit, G., et al. (2011). Long range transport of soil dust and smoke pollution in the South Asian region. Atmospheric Pollution Research, 2, 151–157.
Berresheim, H., Wine, P. H., & Davis, D. D. (1995). Chemical composition and climate of the atmosphere. In H. B. Singh (Ed.), Sulfur in the atmosphere (pp. 251–307). New York: Van Nostrand Reinhold Publishing Co.
Booker, F. L., Muntifering, R., McGrath, M., Burkey, K. O., Decoteau, D., Fiscus, E. L., et al. (2009). The ozone component of global change: Potential effects on agricultural and horticultural plant yield, product quality and interactions with invasive species. Journal of Integrative Plant Biology, 51, 337–351.
Catcott, E. J. (1961). Effect of air pollution on animals. Monograph Series World Health Organization, 46, 221–231.
Chan, Y. C., Simpson, R. W., Mctainsh, G. H., Vowles, P. D., Cohen, D. D., & Bailey, G. M. (1999). Source apportionment of visibility degradation problems in Brisbane (Australia) using the multiple linear regression techniques. Atmospheric Environment, 33, 3237–3250.
Charlson, R. J., & Rodhe, H. (1982). Factors controlling the acidity of natural rainwater. Nature, 295, 683–685.
Crutzen, P. J. (1970). The influence of nitrogen oxides on the atmospheric ozone content. Quarterly Journal of the Royal Meteorological Society, 96(408), 320–325.
Daniel, J. S., Velders, G. J. M., Morgenstern, O., Toohey, D. W., Wallington, T. J., Wuebbles, D. J., et al. (2011). A focus on information and options for policymakers, Chapter 5 in Scientific assessment of ozone depletion: 2010. Global Ozone Research and Monitoring Project–Report No. 52, 516 pp. Geneva: World Meteorological Organization.
David, B. (2003). Environmental pollution and the global burden of disease. British Medical Bulletin, 68, 1–24.
David, M., Guntis, O., Peter, P., Anthony, W., Rudi, O., Veerle, V. W., & Michael, G. (1996). Urban air pollution in megacities of the world. Atmospheric Environment, 30(5), 486–681.
Dennis, A. W. (1987). Radioactivity in rainwater following the Chernobyl accident. Environmentalist, 7(1), 31–34.
Doherty, R. M., Hulme, M., & Jones, C. G. (1999). A gridded reconstruction of land and ocean precipitation for the extended tropics from 1974–1994. International Journal of Climatology, 19, 119–142.
Donaldson, A. I., & Alexandersen, S. (2002). Predicting the spread of foot and mouth disease by airborne virus. Revue Scientifique et Technique-Office International des épizooties, 21(3), 569–575.
Duguid, J. P. (1946). The size and the duration of air carriage of respiratory droplets and droplet nuclei. The Journal of Hygiene, 44(6), 471–479.
Engstrom, D. R., & Swain, E. B. (1997). Recent declines in atmospheric mercury deposition in the upper Midwest. Environmental Science and Technology, 312, 960–967.
Famhy, Y. M., Fornasiero, P., Zinoviev, S., & Miertus, S. (2007). Air pollution control technologies compendium. International Centre for Sceince and High Technology and United Nations Industrial Development Organization.
Fiscus, E. L., Booker, F. L., & Burkey, K. O. (2005). Crop responses to ozone: uptake, modes of action, carbon assimilation and partitioning. Plant, Cell and Environment, 28, 997–1011.
Fitzgerald, W. F. (1995). Is mercury increasing in the atmosphere? The need for an atmospheric mercury network (AMNET). Water, Air, and Soil pollution, 80, 245–254.
Fitzgerald, W. F., & Watras, C. J. (1989). Mercury in surficial waters of rural Wisconsin lakes: Total. Environment, 87(8), 223–232.
Fogg, T. R., & Fizgerald, W. F. (1979). Mercury in southern New England rains. Journal of Geophysical Research—Oceans and Atmospheres, 84, 6987–6988.
Ghim, Y. S., Moon, K. C., Lee, S. Y., & Kim, Y. P. (2005). Visibility trends in Korea during the past two decades. Journal of the Air and Waste Management Association, 55, 73–82.
Goldsmith, J. R., & Friberg, L. T. (1977). Effects of air pollution on human health. In A. C. Stern (Ed.), Air pollution (Vol. II, pp. 470–474). New York: Academic Press.
Gupta, G. P., Singh, S., Kumar, B., & Kulshrestha, U. C. (2015). Industrial dust sulphate and its effects on biochemical and morphological characteristics of Morus (Morus alba) plant in NCR Delhi. Environmental Monitoring and Assessment. doi:10.1007/s10661-015-4301-4
Hallegraeff, G. (1993). A review of harmful algal blooms and their apparent global increase. Phycologia, 32, 79–99.
Harald, D., Richard, B., & Jan, T. (2004). In J. Sliggers & W. Kakaebeeke (Eds.), Clearing the air—25 years of the convention on long—range transboundary air pollution. Geneva: Economic Commission for Europe.
Harter, P. (1986). Acidic deposition—materials and health effects. IEA Coal Research TR36.
Heagle, A. S. (1989). Ozone and crop yield. Annual review of Phytopathology, 27, 397–423.
Hong, Y. C., Lee, J. T., Kim, H., Ha, E. H., Schwartz, J., & Christiani, D. C. (2002). Effects of air pollutants on acute stroke mortality. Environmental Health Perspectives 110, 187–191.
Hovmand, M. F., Kemp, K., Kystol, J., Johnsen, I., Riis-Nielsen, T., & Pacyna, J. M. (2008). Atmospheric heavy metal deposition accumulated in rural forest soils of southern Scandinavia. Environment Pollution, 155(3), 537–541.
Hulme, M., Osborn, T. J., & Johns, T. C. (1998). Precipitation sensitivity to global warming: Comparison of observations with HadCM2 simulations. Geophysical Reseach Letters, 25(33), 79–82.
IARC. (1989). Diesel and gasoline engine exhausts and some nitroarenes. Lyon: International Agency for Research on Cancer.
Intergovernmental Panel on Climate Change (IPCC). (2001). New York: Cambridge University Press.
IPCS. (1989). Lead—environmental aspects. Environmental health criteria 85. In International Programme on Chemical Safety (IPCS). Geneva, Switzerland: World Health Organisation.
Jaworski, N. A., Howarth, R. W., & Hetling, L. J. (1997). Atmospheric deposition of nitrogen oxides onto the landscape contributes to coastal eutrophication in the Northeast United States. Environmental Science and Technology, 31, 1995–2005.
Johnston, H. (1971). Reduction of stratospheric ozone by nitrogen oxide catalysts from supersonic transport exhaust. Science, 173(3996), 517–522.
Jones, P. D., & Hulme, M. (1996). Calculating regional climatic time series for temperature and precipitation: Methods and illustrations. International Journal of Climatology, 16, 361–377.
Kaarakainen, P., Meklin, T., Rintala, H., Vepsalainen, A., Hyvarinen, A., Nevalainen, A., & Meklin, T. (2009). Microbial content of house dust samples determined with qPCR. Science of the Total Environment, 407, 4673–4680.
Karl, T. R., & Knight, R. W. (1998). Secular trends of precipitation amount, frequency, and intensity in the USA. Bulletin of the American Meteorological society, 79, 231–241.
Kathleen, K., & Boguang, Z. (1996). Risk of silicosis in a colorado mining community. American Journal of Industrial Medicine, 30, 529–539.
Kawosa, M. A. (1991, June 2). Black snow in Kashmir. Kashmir Times (As cited in Lone, F. A., Khan, M. A., Qureshi, N., Kirmani, N. A., Sidiquee, S. H., & Shah, R. A. (2010). Environmental chemistry of a rare muddy snowfall occurrence on alpine zone glaciers of Gulmarg, Kashmir Himalaya, India. Current World Environment, 5(2), 271–278).
Keeler, G., Glinsorn, G., & Pirrone, N. (1995). Particulate mercury in the atmosphere: Its significance, transport, transformation and sources. Water, Air, and Soil Pollution, 80, 159–168.
Kulshrestha, U. (2001). In Proceedings of First Composition of Atmospheric Deposition (CAD) Workshop held at Tsukuba. Japan, December 10–16, 2000.
Kulshrestha, U. (2013). Acid rain. In S. E. Jorgensen (Ed.), Encyclopedia of environmental management (Vol. I, pp. 8–22). New York: Taylor & Francis.
Kulshrestha, U. (2015). Some facts about recent air pollution problem in delhi. Journal of Indian Geophysical Union, 19(3), 351–352.
Kulshrestha, M. J., Kulshrestha, U. C., Parashar, D. C., & Vairamani, M. (2003). Estimation of SO4 contribution by dry deposition of SO2 onto the dust particles in India. Atmospheric Environment, 37, 3057–3063.
Kulshrestha, U. C., & Kumar, B. (2014). Airmass trajectories and long range transport of pollutants: Review of wet deposition scenario in South Asia. Advances in Meteorology. doi:10.1155/2014/596041
Kulshrestha, U. C., Sreedhar, B., & Kulshrestha, M. J. (2005). Carbon as major constituent of atmospheric aerosols at urban sites in India. Presented in Asian Aerosol Conference held at Mumbai December 13–16, 2005.
Lee, V., & Olsen, S. (1985). Eutrophication and management initiatives for the control of nutrient inputs to Rhode Island coastal lagoons. Estuaries, 8, 191–202.
Li, Z., Niu, F., Fan, F., Liu, Y., Rosenfeld, D., & Ding, Y. (2011). Long-term impacts of aerosols on the vertical development of clouds and precipitation. Nature Geoscience, 4, 888–894.
Lipfert, F. W. (1987). Effects of acidic deposition on the atmospheric deterioration of materials. Materials Performance, 12, 12–19 (National Association of Corrosion Engineers).
Lipfert, F. W. (1989). Atmospheric damage to calcareous stones: Comparison and reconciliation of recent findings. Atmospheric Environment, 23, 415.
Lone, F. A., Khan, M. A., Qureshi, N., Kirmani, N. A., Sidiquee, S. H., & Shah, R. A. (2010). Environmental chemistry of a rare muddy snowfall occurrence on alpine zone glaciers of Gulmarg. Kashmir Himalaya, India Current World Environment, 5(2), 271–278.
Lucas, B. B., & John, H. D. (1987). Radioactive contamination in Nijmegen rainwater after the Chernobyl accident. Science of The Total Environment, 64(3), 253–258.
Mamane, Y., Dayan, U., & Miller, J. M. (1987). Contribution of alkaline and acidic sources to precipitation in Israel. The Science of The Total Environment, 61, 15–22.
Matzner, E., & Murach, D. (1995). Soil changes induced by air pollutant deposition and their implication for forests in central Europe. Water, Air, 85(1), 63–76.
Miller, K. A., Siscovick, D. S., Sheppard, L., Shepherd, K., Sullivan, J. H., Anderson, G. L., & Kaufman, J. D. (2007). Long-term exposure to air pollution and incidence of cardiovascular events in women. New England Journal of Medicine, 356, 447–458.
Mohan, M. S., Pathan, K., Narendrareddy, K., Kandya, A., & Pandey, S. (2011). Dynamics of urbanization and its impact on land-use/land-cover: a case study of megacity Delhi. Journal of Environmental Protection, 2, 1274–1283.
Montzka, S. A., Butler, J. H., Elkins, J. W., Thompson, T. M., Clarke, A. D., & Lock, L. T. (1999). Present and future trends in the atmospheric burden of ozone. Nature, 398, 690–694.
NAPAP. (1990). National acid precipitation assessment programme. 1990 Integrated Assessment Report. Washington D.C.: NAPA.
National Academy of Sciences. (1999). Biological effects of ionizing radiation (BEIR) VI report: The health effects of exposure to indoor radon. Washington D.C.: National Academy Press.
Nixon, S. (1995). Coastal marine eutrophication: A definition, social causes and future concerns. Ophelia, 41, 199–220.
Nriagu, J., & Pacyna, J. (1988). Quantitative assessment of worldwide contamination of air, water and soils by trace metals. Nature, 333, 134–139.
O’Neill, M. S., Veves, A., Zanobetti, A., Sarnat, J. A., Gold, D. R., Economides, P. A., et al. (2005). Diabetes enhances vulnerability to particulate air pollution-associated impairment in vascular reactivity and endothelial function. Circulation, 111, 2913–2920.
Ostro B. (2004). Outdoor air pollution: Assessing the environmental burden of disease at national abd local levels. Geneva: World Health Organisation (WHO Environmental Burden of Disease Series, No. 5).
Pacyna, J. M., & Pacyna, E. G. (2001). An assessment of global and regional emissions of trace metals to the atmosphere from anthropogenic sources worldwide. Environmental Reviews, 9, 269–298.
Percy, K. E., & Ferretti, M. (2004). Air pollution and forest health: Toward new monitoring concepts. Environmental Pollution, 130(2004), 113–126.
Pope, C. A, I. I. I., Burnett, R. T., Thurston, G. D., Thun, M. J., Calle, E. E., Krewski, D., & Godleski, J. J. (2004). Cardiovascular mortality and long-term exposure to particulate air pollution: Epidemiological evidence of general pathophysiological pathways of disease. Circulation, 109, 71–77.
Ramanathan, V., & Carmichael, G. R. (2008). Global and regional climate changes due to black carbon. Nature Geoscience, 1, 221–227.
Ramanathan, V., & Feng, Y. (2009). Air pollution, greenhouse gases and climate change: Global and regional perspectives. Atmospheric Environment, 43(2009), 37–50.
Ramesha, C., Sushil, G., & Umesh, C. K. (2011). Coping with climate change: Principles and Asian context. New York: Springer.
Ravishankara, A. R., John, S. D., & Robert, W. P. (2009). Nitrous oxide (N2O): The dominant ozone-depleting substance emitted in the 21st century. Science, 326, 123–125. doi:10.1126/science.1176985.
Richardson, G. M., Garrett, R., Mitchell, I., Mah-Poulson, M., & Hackbarth, T. (2001). Critical review on natural global and regional emissions of six trace metals to the atmosphere. (Prepared for the International Lead Zinc Research Organisation, the International Copper Association, and the Nickel Producers Environmental Research Association).
Robinson, D. A. (1997). Hemispheric snow cover and surface albedo for model validation. Annals of Glaciology, 25, 241–245.
Rodhe, H. (1972). A study of the sulfur budget for the atmosphere over Northern Europe. Tellus, 24, 128–138.
Savitz, D. A., & Feingold, L. (1989). Association of childhood cancer with residential traffic density. Scandinavian Journal of Work, Environment & Health, 15, 360–363.
Seinfeld, J. H. (1986). Atmospheric chemistry and physics of air pollution. Wiley-Interscience. ISBN-10: 0471828572.
Shy Carl, M. (1978). Health effects of air pollution. New York: American Thoracic Society, Medical Section of American Lung Association.
Siegel, R., Naishadham, D., & Jemal, A. (2013). Cancer Statistics, 2013. CANCER J CLIN 2013, 63, 11–30.
Sloane, C. S., Watson, J., Chow, J., Pritchett, L., & Willard Richards, L. (1991). Size–segregated fine particle measurements by chemical species and their impact on visibility impairment in Denver. Atmospheric Environment Part A. General Topics, 25, 1013–1024.
Stratton, W. J., & Lindberg, S. E. (1995). Measurement of gas phase ionic mercury (ii) species in ambient air. Abstracts of Papers of the American Chemical Society, 210, 60.
Teresa, M. A., & Leonardo, T. (2013). Economic costs of childhood lead exposure in low- and middle-income countries. Environmental Health Perspectives, 121(9), 1097–1102.
Thomas, M. D. (1961). Effects of air pollution on plants. Monograph Series World Health Organization, 46, 233–277.
Tzanis, C., Varotsos, C., Christodoulakis, J., Tidblad, J., Ferm, M., Ionescu, A., et al. (2011). On the corrosion and soiling effects on materials by air pollution in Athens, Greece. Atmospheric Chemistry and Physics, 11, 12039–12048.
UNEP. (2010). Final review of scientific information on lead—Version of December 2010. http://www.unep.org/hazardoussubstances/Portals/9/Lead_Cadmium. Accessed 19 January 2014.
Ursula, K., Christian, H., Dorothea, S., Klaus, S., Tamara, S., Ulrich, R., et al. (2010). Traffic-related air pollution and incident type 2 diabetes: Results from the SALIA cohort study. Environmental Health Perspectives, 118(9), 1273–1279.
U.S. Department of Health and Human Services. (2004). The health consequences of smoking. A report of the U.S. surgeon general.
U.S. Department of Health and Human Services. (2006). The health consequences of involuntary exposure to tobacco smoke: A report of the surgeon general—executive summary.
Valiela, I., & Costa, J. (1988). Eutrophication of buttermilk bay, a cape cod coastal embayrnent: Concentrations of nutrients and watershed nutrient budgets. Environmental Management, 12, 539–551.
Vitousek, P. M., Aber, J. D., Howarth, R. W., Likens, G. E., Matson, P. A., Schindler, D. W., et al. (1997). Human alterations of the global nitrogen cycle: Causes and consequence. Issues in Ecology, 1, 1–15.
Vrekoussis, M., Richter, A., Hilboll, A., Burrows, J. P., Gerasopoulos, E., Lelieveld, J., et al. (2013). Economic crisis detected from space: Air quality observations over Athens/Greece. Geophysical Research Letters, 40(2), 458–463.
Wang, L., & Pinkerton, K. E. (2007). Air pollutant effects on fetal and early postnatal development. Birth Defects Research Part C Embryo Today, 81(3), 144–154.
Wark, K., Warner, C. F., Davis, W. T. (1998). Air pollution—its origin and control (3rd ed., 573 pp). MA, United States: Addison–Wesley.
Wells, W. F. (1934). On air-borne infection: Study II. Droplets and droplet nuclei. American Journal of Epidemiology, 20(3), 611–618.
Wells, W., & Stone, W. (1934). On air-borne Infection. American Journal of Hygiene, 20, 619–627.
Whitsel, E. A., Quibrera, P. M., Christ, S. L., Liao, D., Prineas, R. J., Anderson, G., & Heiss, G. (2009). Heart rate variability, ambient particulate matter air pollution, and glucose homeostasis: The environmental epidemiology of arrhythmogenesis in the women’s health initiative. American Journal of Epidemiology, 169, 693–703.
WHO. (2000). The world health report 2000—health systems: improving performance. Geneva: World Health Organization.
WHO. (2005). Effects of air pollution on children’s health and development a review of the evidence. Geneva: WHO.
WHO. (2015a). 7 million premature deaths annually linked to air pollution. http://www.who.int/mediacentre/news/releases/2014/air-pollution/en/. Accessed 22nd February 2015.
WHO. (2015b). Burden of disease from Household Air Pollution for 2012. http://www.who.int/phe/health_topics/outdoorair/databases/FINAL_HAP_AAP_BoD_24March2014.pdf. Accessed 22nd February 2015.
WHO. (2015c). Burden of disease from ambient air pollution for 2012. Accessed 22nd February 2015.
William, F., & Lou, D. (2003). Principles and practices of air pollution control student manual, APTI course 452 (3rd ed.). Washington D.C.: Environment Protection Agency.
Winterhalder, K. (1996). Environmental degradation and rehabilitation of the landscape around Sudbury, a major mining and smelting area. Environmental Reviews, 4, 185–224.
Zhang, R., Jing, J., Tao, J., Hsu, S. C., Wang, G., Cao, J., et al. (2013). Chemical characterization and source apportionment of PM2.5 in Beijing: seasonal perspective. Atmospheric Chemistry and Physics 13, 7053–7074.
Zhang, D. D., Peart, M. R., Jim, C. Y., La, J. (2002). Alkaline rains on the Tibetan Plateau and their implication for the original pH of natural rainfall. Journal of Geophysical Research: Atmospheres, 107(D14), ACH 9-1–ACH 9-6.
Zhang, Q., Streets, D. G., Carmichael, G. R., He, K. B., Huo, H., Kannari, A., et al. (2009). Asian emissions in 2006 for the NASA INTEX–B mission. Atmospheric Chemistry and Physics, 9, 5131–5153.
Author information
Authors and Affiliations
Corresponding author
Rights and permissions
Copyright information
© 2016 Springer International Publishing Switzerland
About this chapter
Cite this chapter
Chandrappa, R., Chandra Kulshrestha, U. (2016). Major Issues of Air Pollution. In: Sustainable Air Pollution Management. Environmental Science and Engineering(). Springer, Cham. https://doi.org/10.1007/978-3-319-21596-9_1
Download citation
DOI: https://doi.org/10.1007/978-3-319-21596-9_1
Published:
Publisher Name: Springer, Cham
Print ISBN: 978-3-319-21595-2
Online ISBN: 978-3-319-21596-9
eBook Packages: Earth and Environmental ScienceEarth and Environmental Science (R0)