
Abstract
Gamification means using video game elements to improve user experience and user engagement in non-game services and applications. This article describes the effects when gamification is used in work contexts. Here we focus on industrial production. We describe how facial recognition can be employed to measure and quantify the effect of gamification on the users’ emotions.
The quantitative results show that gamification significantly reduces both task completion time and error rate. However, the results concerning the effect on emotions are surprising. Without gamification there are not only more unhappy expressions (as to expect) but surprisingly also more happy expressions. Both findings are statistically highly significant.
We think that in redundant production work there are generally more (negative) emotions involved. When there is no gamification happy and unhappy balance each other. In contrast gamification seems to shift the spectrum of moods towards “relaxed”. Especially for work environments such a calm attitude is a desirable effect on the users. Thus our findings support the use of gamification.
You have full access to this open access chapter, Download conference paper PDF
Keywords
- Gamification
- Assistive technology
- Facial recognition
- Affective computing
- Computer-assisted instruction
- Augmented reality
- Human machine interaction
1 Introduction
Gamification is a delightful concept: it is a creditable idea to use “video game elements to improve user experience and user engagement in non-game services and applications” [3]. The link between emotions and motivation is important, especially in context of employee motivation: after all, increased engagement should have numerous benefits like improved performance and greater user satisfaction [10].
This article describes how gamification can be used in work contexts like industrial production. Since industrial production already involves processes with measurable physical outcomes (e.g. the number of parts produced per hour), gaming elements like scores and leaderboards could be implemented with comparatively little effort. Ideally the system should also be able to measure the effect that gamified work processes have on speed and quality.
However, if gamification is to succeed in such environments, a system employing it will need a back channel to determine if a specific intervention has increased or decreased a user’s mood. A preferred approach to measuring the user’s emotional state in work environments are facial expressions since they can be measured without physical contact to the worker.
2 State of the Art
The integration of gamification into business contexts has first been described by Reeves & Read [11]. However, they have been focusing on office contexts. A concept for the integration of gamification into production environments has first been described by Korn [6]. While this concept already included real-time feedback based on motion tracking, it lacked a feedback channel which allows monitoring the effects of gamification.
A more detailed model (Fig. 1) for implementing gamification in work environments was described in the context of context aware assistive systems (CAAS) two years later by Korn et al. [7].

CAAS-model by Korn et al.
This model also establishes the notion of a flow state as a desirable outcome of gamification. This is an emotional state in-between arousal and control where high skills and high demands converge – as described by Csíkszentmihályi in the late seventies [2].
However, in the context of this work the more important aspect is the integration of emotion recognition in the environmental interface. Within the CAAS-model emotion recognition is considered a pre-requisite for determining a user’s current flow state and thus adapting the interventions generated by the system. A good example is the need to determine if a worker reduces work speed because of boredom or because of exhaustion. While boredom would require an energizing stimulus (or even an increase in production speed if the system allows for such adaptations), exhaustion would require just the opposite.
Some assistive systems in production environments already feature cameras for motion recognition [8]. Thus the preferred approach for measuring the user’s emotional state is using these cameras to analyze the facial expressions. By using these cameras no additional system is required and also no physical contact to the worker – in contrast to sensors for galvanic skin response or most heart rate sensors.
In various studies Ekman showed that human emotions can be categorized into six basic categories: anger, sadness, happiness, surprise, disgust and fear [4, 5]. Each of these basic emotions is characterized by a typical facial expression caused by stretched or released facial muscles (Fig. 2).

Basic emotions: surprise, sadness, happiness, contempt and anger.
A result of this research was the facial coding system (FACS). It focuses on special muscle groups around the mouth and the eyes. These are crucial in the activity of expressing emotions and thus are called “Action Units”.
3 Implementation
For the purpose of the pioneering study, determining the states “happy” versus “not happy” was considered a sufficient granularity to measure the effects of gamification – other emotions like anger and fear or even disgust were considered as unlikely to appear (or at least to be shown) in a production work setting.
The emotion recognition system has to ensure a high performance because real-time evaluation is required. A feedback given a few seconds after the event is already considered a disturbance. To achieve performance in real-time, the image size of the captured faces has to be reduced. Also it is required to use simple methods of pattern recognition which can be computed fast.
3.1 Face Detection
At first the image region is reduced, since for analyzing facial expressions only the face is of interest. This minimizes the memory significantly. We implemented the Viola-Jones-Algorithm which uses three simple methods that can be computed fast.
The algorithm converts a grayscale input image into an integral image. Then it uses Haar-like features to detect faces. Haar-like features are rectangular patterns based on characteristic regions within a face like the region around the eyes or around the mouth. These characteristics are caused by variations of bright and dark parts as shown in Fig. 3.

Haar-like features.
3.2 Feature Extraction and Bag of Features
As mentioned before every emotion has characteristic features, i.e. characteristic feature points (key points). These key points were extracted from detected faces using the Speeded Up Robust Features algorithm (SURF) which is invariant towards scale and rotation [1]. Therefore it was considered to be well-suited for working processes where rotations and various illumination conditions are to be expected.
Similar to face detection it is based on the Haar-like features. The Fast-Hessian-Method is used to smooth the input image by convolution with Gaussian. Afterwards the algorithm detects key points. For every detected key point a feature vector with 64 entries is computed. Since every facial expression consists of various key points there are several 64D feature vectors for every emotion. Although every emotion causes numerous feature vectors based on unique key points, some of these points are “useless” as they do not describe an important point within the emotion. By using k-means clustering we created a “Bag of Features” for all important feature vectors of the emotions, i.e. their remarkable features. Thus similar key points were clustered and an emotion was recognized by its typical key points only.
3.3 Limitations of Facial Recognition
After the system was implemented we tested it both in the lab and in the wild. The emotional recognition (in our work-oriented scenario mainly the discrimination between happy and unhappy) was stable in the lab.
However, we found that in work environments the method is not reliable. The illumination changes quickly because of suboptimal lighting conditions in combination with the worker’s movements. Although the SURF algorithm is supposedly invariant towards scale and rotation this caused problems: shadows on the face distort the expression and emotions were not recognized correctly. The changing illumination also increased latency. To counterbalance such effects and still avoid body-attached sensors, additional cameras and lighting would be required in work environments.
To evaluate the effects of gamification in spite of the deficits of the facial detection system, the emotional states were identified in a “semi-automated” detection process:
-
1.
The emotions were pre-classified by SHORE (Sophisticated High-speed Object Recognition Engine [9], Fig. 4).
Fig. 4. 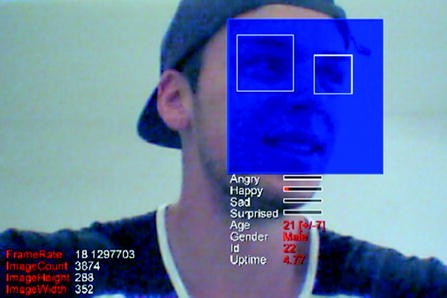
Emotion detection based on SHORE.
-
2.
The recognized emotions were re-assessed and fed into the system by human observers.

Technically this results in a Wizard-of-Oz study.
3.4 Gamification
While the focus of this work lies on the facial detection aspect, gamification is the underlying method which is being analyzed. When implementing gamification, we deliberately chose a simple and established approach:
-
providing real-time multimodal feedback (audio and visual)
-
displaying performance (required time and committed errors)
-
using scores to increase motivation and establish flow
The gamification system allocates 10 points per step. Each mistake or slow step results in a score reduction of 10 points. Thus in the 15-step scenario the score was gradually reduced from a maximum of 150 points down to zero.
Reaching zero could either be a result of 15 mistakes or of 15 slow steps or a mixture of both. Although theoretically 15 slow and wrong steps would result in a negative score (here: −150) the score was capped at zero.
The probands received real-time feedback on both the time and the error rate. However, negative feedback was phrased positively to avoid demotivation, e.g. “you can do better”.
4 Study
4.1 Setup
The study was conducted with ten probands age 19 to 38. We used a repeated measures approach with 10 task repetitions without gamification and 10 task repetitions with gamification. The sequence of tasks with and without gamification was randomized.
The task was assembling a model consisting of LEGO bricks (Fig. 5). The model’s completion required 15 steps. As common in manual assembly environments, the steps were shown in an on-screen instruction.

Lego model used in the study.
Each test subject completed a two-part questionnaire with an emotional self-evaluation. The first part was used before the assembly and the second part after the assembly. The questionnaire evaluated the effects recognized by the test persons.
During the assembly phase (Fig. 6) we measured the task completion time, the error rate and the emotions. The screen in front of the proband showed the instructions and (in the gamification part) the gamification elements.

Setup in the assembly phase of the study.
The camera was placed in the center in front of the monitor and was re-adjusted for each proband to maximize the quality of the facial recognition.
4.2 Results
Several test persons were generally not comfortable with having to build the model several times. However, this was an intended effect which shows that repetitive work is not appreciated.
When comparing the development of the error rate (Fig. 7), which is the most important business ratio in production environments, it is obvious that gamification decreases and equalizes the error rate. With p < 0.05 this difference is statistically significant.

Average number of errors in 10 repetitions with gamification (blue) and without gamification (red) (Color figure online).
The mean task completion time (Fig. 8) was 50 s lower with gamification than without (2:50 min. versus 3:40 min). Again with p < 0.05 this difference is statistically significant.

Average task completion time in 10 repetitions with gamification (blue) and without gamification (red) (Color figure online).
When comparing the number of happy expressions (Fig. 9) the difference is striking: on average there are 138.5 expressions with gamification and 211.6 without. This finding contradicts intuition: we would expect more happy expressions with gamification. However, this counterintuitive finding is statistically highly significant (p < 0.01).

Happy expressions with gamification (blue) and without gamification (red) (Color figure online).
The surprising result with regard to the happy expressions is counter-balanced when analyzing the unhappy expressions: on average there are 105.4 unhappy expressions with gamification and 199.9 unhappy expressions without gamification. This is what intuition would predict. Again, this finding is statistically highly significant (p < 0.01) (Fig. 10).

Unhappy expressions with gamification (blue) and without gamification (red) (Color figure online).
5 Discussion and Conclusion
Generally the test subjects stated that they felt the gamification elements very motivating. These assertions are confirmed by the quantitative results with respect to task completion time and error rate: gamification reduces both significantly.
The results regarding emotions are surprising. Without gamification there are not only more unhappy expressions (as to expect) but surprisingly also more happy expressions. Both findings are statistically highly significant. In our understanding, there are three potential explanations for this phenomenon:
-
1.
the emotion detection method is not reliable: this is unlikely due to the additional human control
-
2.
the participants deliberately or subconsciously conceal expressions of happiness in the gamification setup: this is possible but unlikely
-
3.
when there is no gamification there are generally more emotions involved and happy and unhappy balance each other
We favor the third explanation. This hypothesis is supported by the fact that obviously (Fig. 11) there are more emotions without gamification (highly significant p < 0.01). As several probands have expressed their dislike for the repetitive task, a psychological explanation of this phenomenon is the following: once there are stronger emotions (here: disliking the task) they escalate and are displayed on both sides of the spectrum.

Expressions of positive or negative emotions with gamification (blue) and without gamification (red) (Color figure online).
In contrast gamification seems to shift the spectrum of moods towards “relaxed” (i.e. no measurable expression). Especially for work environments such a calm attitude is a desirable effect on the users. Thus our findings support the use of gamification.
6 Future Work
With only 10 probands this work can only be a first step into measuring the impact of gamification on emotions in work environments. Still the findings are unexpected and have to be validated by extensive studies with more test subjects. Also a more reliable facial recognition is needed which (for this purpose) could be supported by body-attached sensors.
References
Bay, H., Tuytelaars, T., Van Gool, L.: SURF: speeded up robust features. In: Leonardis, A., Bischof, H., Pinz, A. (eds.) ECCV 2006, Part I. LNCS, vol. 3951, pp. 404–417. Springer, Heidelberg (2006)
Csíkszentmihályi, M., Nakamura, J.: The concept of flow. In: Snyder, C.R., Lopez, S.J. (eds.) The Handbook of Positive Psychology, pp. 89–92. Oxford University Press, Oxford (2002)
Deterding, S., Sicart, M., Nacke, L., O’Hara, K., Dixon, D.: Gamification. using game-design elements in non-gaming contexts. In: Proceedings of the 2011 Annual Conference Extended Abstracts on Human Factors in Computing Systems, pp. 2425–2428. ACM (2011)
Donato, G., Bartlett, M.S., Hager, J.C., Ekman, P., Sejnowski, T.J.: Classifying facial actions. IEEE Trans. Pattern Anal. Mach. Intell. 21(10), 974–989 (1999)
Ekman, P.: Facial expression and emotion. Am. Psychol. 48(4), 384 (1993)
Korn, O.: Industrial playgrounds: how gamification helps to enrich work for elderly or impaired persons in production. In: Proceedings of the 4th ACM SIGCHI Symposium on Engineering Interactive Computing Systems, EICS 2012, pp. 313–316. ACM (2012)
Korn, O., Funk, M., Abele, S., Hörz, T., Schmidt, A.: Context-aware assistive systems at the workplace: analyzing the effects of projection and gamification. In: Proceedings of the 7th International Conference on Pervasive Technologies Related to Assistive Environments, PETRA 2014, pp. 38:1–38:8. ACM (2014)
Korn, O., Schmidt, A., Hörz, T.: Assistive systems in production environments: exploring motion recognition and gamification. In: Proceedings of the 5th International Conference on PErvasive Technologies Related to Assistive Environments, PETRA 2012, pp. 9:1–9:5. ACM (2012)
Küblbeck, C., Ernst, A.: Face detection and tracking in video sequences using the modifiedcensus transformation. Image Vis. Comput. 24(6), 564–572 (2006)
McGonigal, J.: Reality is Broken: Why Games Make us Better and How they can Change the World. Penguin Books, New York (2011)
Reeves, B., Read, J.L.: Total Engagement: Using Games and Virtual Worlds to Change the Way People Work and Businesses Compete. Harvard Business Press, Boston (2009)
Author information
Authors and Affiliations
Corresponding author
Editor information
Editors and Affiliations
Rights and permissions
Copyright information
© 2015 Springer International Publishing Switzerland
About this paper
Cite this paper
Korn, O., Boffo, S., Schmidt, A. (2015). The Effect of Gamification on Emotions - The Potential of Facial Recognition in Work Environments. In: Kurosu, M. (eds) Human-Computer Interaction: Design and Evaluation. HCI 2015. Lecture Notes in Computer Science(), vol 9169. Springer, Cham. https://doi.org/10.1007/978-3-319-20901-2_46
Download citation
DOI: https://doi.org/10.1007/978-3-319-20901-2_46
Published:
Publisher Name: Springer, Cham
Print ISBN: 978-3-319-20900-5
Online ISBN: 978-3-319-20901-2
eBook Packages: Computer ScienceComputer Science (R0)