
Abstract
With the recent explosive increase in the amount of web-based scientific data in big data environments, various researcher support systems have been developed to help discover desired scientific data and search insights. Scientific and researcher-related data are also applied to social networking services, thus promoting inter-researcher networking. However, much time and effort is put into big data mining to extract information customized to researchers’ specific needs. Moreover, systems that facilitate information extraction by schematizing various inter-data relationships are absent. In this paper, we propose a system that facilitates relevant information extraction from scientific data and provides intuitive data visualization. Such data visualization allows efficient relationship expression between scientific data (relationships between researchers, acronyms and technical terms, and synonyms of a technology name), and provides an author disambiguation interface for authors with the same name. As a result, researchers can extract relevant information from big data with scientific data, and obtain significant information based on cleansed and disambiguated data.
You have full access to this open access chapter, Download conference paper PDF
Keywords
1 Introduction
Recent years have seen an explosive increase in the number of web-based scientific data. Open Access (OA) is the representative platform of scientific data, in which they are distributed in the Open Archives Initiative (OAI) protocol format provided by OA repositories [1]. The number of OA scientific data marked a ten-fold increase in ten years from 19,500 in 2000 to 191,850 in 2009, and this rapid upward trend of online distribution of scientific data is expected to continue in coming years [2]. Against this background, a wide range of search engines for scientific data, such as Microsoft Academic Search, Google Scholar, and SciVal Experts have been developed for the purpose of collecting scientific data and providing them for users who seek scientific papers and insights. Of them, Google Scholar operates a freely accessible service by searching and collecting scientific data, indexing them according to data patterns, and expanding them [3]. Microsoft Academic Search service runs a pilot operation of a system for providing users with visualized display of inter linkages among scientific data. Yet, to the best of our knowledge, there is a lack of systems for visually displaying multifaceted inter-data relationships. Retrieval efficiency and system usability can be improved compared with currently available general search engines by revealing such variegated inter linkages among scientific data and analyzing them based on the attributes of respective extracted data [4, 5]. This paper presents a visualization system based on the Solr system for the purpose of expanding the usability of scientific data. First, we collected scientific data from the Digital Bibliography & Library Project (DBLP) website that publicizes computer science bibliographic lists. These basic data were enriched by an expanded search of related institutional data and researcher databases. Based on the researcher profiles thus collected, we constructed visualized presentations of not only researcher network status, but also data of the affiliated institutions and email addresses, and provided them in user interfaces such as Forced-Directed Graph, Timeline, and Facet Navigator, along with a system that retrieves such data.
This paper is organized as follows. In Sect. 2, we introduce previous researches into solutions to the visualization about scientific data. In Sect. 3, we explain the implementation system. Finally, we conclude this paper and discuss future work in Sect. 4.
2 Related Work
2.1 Analysis of Scientific Data
Along with the online distribution of scientific data, analytical research into the relationship of scientific data has been underway. Scientific papers distributed online provide information on key information related to the respective papers, such as year of publication and authors’ names and affiliations, but no disambiguation data in the case of researchers with the same name. To address this problem, many studies have been conducted to establish and analyze methods for author name disambiguation [6–8]. One such method was investigated by a study using co-citation data. The co-citation data considered in this study were used by two other studies, which analyzed the co-citation patterns and disambiguated individual authors with the same name. In addition to mechanical analysis, a method of unique author identification was also presented, in which a unique identifier called Researcher ID is assigned to each scientific author. Researcher ID solves the problem of identifying authors with the same name by assigning an identifier to be linked to the academic papers produced by the corresponding author. Along with studies on author disambiguation, studies have been conducted on the relationships of researcher-related data that consider issues such as “similar researcher search” and “researcher recommendation” through similar entity search by extracting expertise profiles from the collected researcher-related data [9].
2.2 Data Visualization
The rapid increase in the amount of data caused by the rapid increase of Internet users has led to the intensification of research on new methods of data retrieval using multifaceted information in addition to simple text search [10]. One such method is data visualization. As a result, a number of search engines have already presented visualized data service, and in turn, this has given rise to studies that evaluate the usability of such visualized data [11].
Researcher expertise profile retrieval systems, such as Google Scholar, Citeseer, Libra, and SciVal Experts, are useful tools for harvesting web-based academic papers. Users consult these search engines to find the materials relevant to their research. These systems provide data related to the objects queried by entering paper titles, author names, or technological domains [12]. Users can use them for launching queries and retrieving relevant papers, but cannot easily grasp what is contained in the papers and how retrieved papers relate to one another.
In order to overcome such limitations, search engines put much effort into the visualization of search results. Microsoft Academic Search, for example, shows re-searchers linked to a queried researcher in a graph (Fig. 1). This system can show co-authors, but output is limited to the identified researchers, so that the unidentified researchers cannot be reflected in the co-author graph. The identified data are then treated as uncertainty data, thus resulting in an analysis error in the data analysis process. In addition to graphic representation, the visualization of search results can provide users with more convenient intuitive views of search results with interactive features; for example, a facet navigation system offers a responsive interface that reflects the search terms entered by the user. In other words, users are provided with interactive data retrieval via faceted navigation. As a result, fact navigation-based search is more useful for users to retrieve relevant data than the best-first search method. Facet search is preferred not only for researcher database search, which is the object of this study, but also in other types of websites with high user accessibility, such as electronic commerce sites [13].

Microsoft academic search - coauthor graph (http://academic.research.microsoft.com/VisualExplorer#3317582)
This paper presents a data visualization system that allows the relationship analysis of scientific data and researcher disambiguation. The proposed system can be used efficiently to analyze research trends and harvest researcher disambiguation data by visualizing the inter-data relationships of search results capable of deriving the relationships among retrieved scientific data, irrespective of the results of researcher disambiguation, thus unaffected by data related to unidentified researchers.
3 Implementation System
3.1 Visualization Process
Figure 2 shows the system configuration proposed in this system, for which the process of visualizing researcher profile data comprises the three stages of data col-lection, data cleansing, and data visualization.

System architecture
-
Data collection. The first stage is the collection of researcher profile databases publicized on the Internet in the domain of computer science. To this end, the names of authors and co-authors, paper titles, and DOIs were extracted from the DBLP data published in the XML format. In order to solve the problem of author ambiguity with the same name, we used the DOI information of the concerned papers in order to collect additional author attributes leading to disambiguation, such as affiliated institutions and email addresses, from their respective websites. The DOI for a paper leads to the website on which the paper is published, and the corresponding page provides paper details, including the abstract, institution name, and email ad-dress. Acronyms, expansion names, and synonyms used in the paper can be obtained from the abstract. When collecting web-based researcher profile data, a customized crawler is required for each webpage, considering its structural pattern, because webpage structures are different from one website to another. Using such customized crawlers, acronyms and expansions are obtained from the papers collected. For this process, we applied an acronym and expansion extraction tool [14]. The extraction tool used contains a cleansing module for removing stopword, unnecessary punctuations, and typographical errors. In the data collection stage, a total of 30,672 acronyms and 512,587 expansions were collected from the data of the papers published online.
-
Data Cleansing and Processing. Data retrieved by automated data collection should be subjected to data cleansing for the removal of unnecessary words and signs. In the case of the data provided by the DBLP, the sequential numbers added to author names or paper titles to avoid data double entries should be removed. For example, from the author name “Tomas Keller 0001,” “0001” should be removed in order to enhance author disambiguation and retrieval accuracy. In addition, unnecessary abbreviations or academic degrees added to authors’ names should be removed. Pages containing HTML tags retrieved by web crawlers often contain mixed upper and lower-case letters and signs, which should be cleansed.
-
Data Visualization. We applied the Solr tool developed in the Apache Project to the visualization system in order to allow customized scientific data retrieval and facilitate detailed data retrieval. Solr, built on Apache Lucene, has the advantages of easily implementing facet navigation features used as an interactive user interface, and allowing high-speed and high-accuracy retrieval by indexing data. Therefore, we applied Solr for the implementation of an interactive user interface based on scientific data. We employed the Ajax technology to construct the interactive user interface, and applied vis.js library to visualize the graphic presentations based on data formatted using JavaScript Object Notation (JSON) [15].
3.2 Proposed System
The main search categories for the proposed system are author, acronym, and synonym to be selected according to the types of scientific data. The system is composed of Facet Navigator, Forced-Directed Graph, and Timeline.
-
Facet Navigator. This feature is shown on the left side of the Fig. 3. Further search can be performed by clicking the links presented in the search results. Such a selected search within the presented search results induces simultaneous filtering of the data represented in the network graph and timeline, which is the main feature of the sys-tem. Facet Navigator allows users to pursue the search for data related to the search results and view only necessary data by targeted extraction, thus reducing the complicity of search results.
Fig. 3. 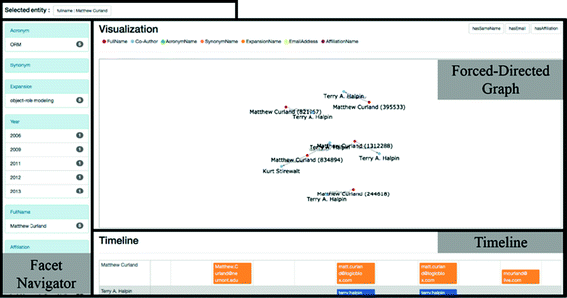
Main interface to shows diverse scientific data
-
Forced-Directed Graph. The Forced-Directed Graph represents each of the author’s name, co-author, acronym, synonym, expansion, email, and affiliation by positioning it as a node on the graph. Nodes have different colors to facilitate visual differentiation. By the nature of a forced-directed graph, the higher the number of nodes, the harder the graph reading and the slower the visualization. To forestall this problem, we depicted only the core nodes that match the search terms for the graph visualization. Users can choose additional nodes whenever additional information is required and renew the graph.
-
Timeline. The Timeline shows the email addresses of the author and co-author(s) by year. The top line contains the email information of the author by year, and each line underneath contains that of a co-author. The lines have different colors, and ID values, with the exception of email addresses, were compared using the algorithm “Gestalt Pattern Matching” [16]; those showing similarities in excess of 60 % were marked with the same color.

3.3 Searching Scientific Data
-
Searching Authors. This feature helps users disambiguate authors by providing affiliations and co-authors’ email addresses. Result values related to authors are outputted as ID values, and users can disambiguate authors by reading graphs and timelines. Figure 4 show detail results about relationships among emails using Forced-Directed Graph. If the value yielded by the pattern-matching algorithm exceeds 60 %, the node is linked to the degree of similarity with a dotted line. The graph drawn within the quadrilateral marked in Fig. 4 displays three email addresses that match three authors, each with similarities that exceed 60 %, and thus connected with dotted lines. In this case, the probability of the three authors being the same person is considered high. The timeline can also help users disambiguate authors because it indicates the email addresses used in the papers by year. We decided the threshold of email similarity is 60 %, therefore if similarity value between ID of emails higher than the threshold then we can consider the authors who have the similar email ID can be the same author. In Fig. 5, four different emails are outputted from a paper authored by “Terry A. Halpin,” of which those used in 2009 and 2011 are identical, and those used in 2013 are different, but with a high degree of similarity, and thus are depicted in the same color. The part grouped as “co-author” indicates that three authors prepared the paper together in the corresponding year. In the same fashion, it can be verified that “Matthew Curland” and “Terry A. Halpin” co-authored papers in other years as well. This information, in conjunction with the colors that express email similarities, leads to the assumption that the authors who appear in 2006, 2009, 2011, and 2013 can be considered to be identical.
Fig. 4. 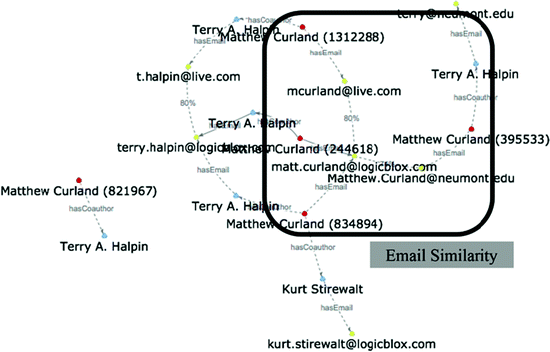
Finding the same authors by email similarity
Fig. 5. 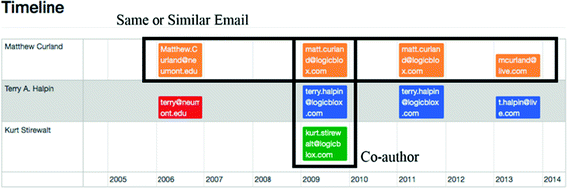
Author identification interface with email timeline derived from scientific data (Color figure online)
-
Searching Acronyms. In the proposed system, if an acronym has different expansions, the representative expansion is taken as the technology name. An acronym search can lead to obtaining detailed information regarding the concerned technology by launching queries based on the terms in the expanded form of the acronym. Figure 6 shows a graph derived from the trend observation regarding the corresponding technology by performing a detailed search with a further query on “Service-Oriented Architecture” from the search results yielded by the search term “SOA.” The axis on the left side shows the number of papers by year yielded by the search results, and the axis on the right side shows the values of the “Service-Oriented Architecture” search results of the Google Trend Search, restructured by year. The graph derived via Facet Navigator reveals that the “Service-Oriented Architecture” technology began to be studied seriously in 2004, peaked in 2006, and has decreased since then. By comparing the corresponding data with the Google Trend Search results, we verified that the estimated (derived) trend was similar to the real trend. The corresponding graph is not outputted in UI, but users can derive it from the results outputted in the year item of the Facet Navigator.
Fig. 6. 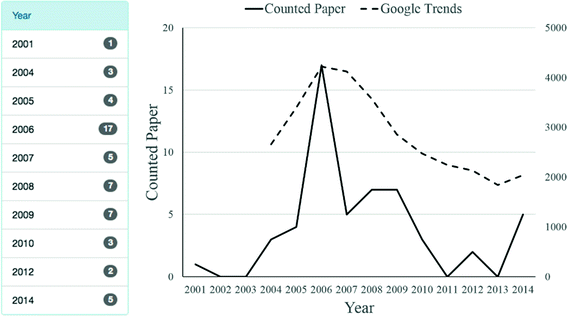
Deriving a trend history of the acronym based on the search results
-
Searching Synonyms. Synonym search provides users with information by retrieving the words similar to, or translated from, the search terms by linking synonym data with expansion and acronym data. The examination of the part marked as “Synonym Group” in Fig. 7 reveals that the query of the term “cross-linguistic retrieval” leads to the information about the author who conducted research on its expansion and acronym data, namely, cross-lingual information retrieval, cross-language information retrieval, and CLIR.
Fig. 7. 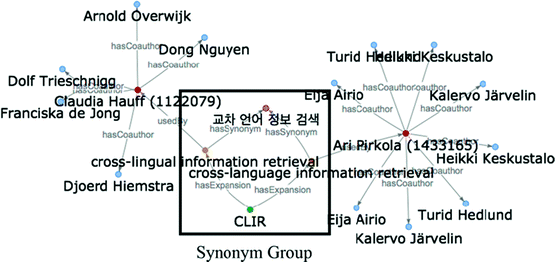
Showing relationships between synonyms and their expansions


4 Conclusion
In line with the recent progress of the Internet and the trend of publicizing open access academic papers, a wide variety and large amount of related research results have been produced. Services that support the research of those looking for collaboration partners, or probing the latest research trends, have been developed based on researcher profile databases. More recently, services based on predictive and prescriptive analytic methodologies have been developed to enhance researchers’ competences. Amidst this trend, the need for accurate researcher profile data has become urgent to allow the accurate diagnosis and analysis of technological trends or researcher expertise. However, given that the currently available data have an unsolved problem of authors with the same name, constructing such services based on such data poses the issue of accuracy and reliability. This problem can be solved only by developing methods and systems for extracting data on the relationships of relevant researcher profile data from scientific data that can lead to author disambiguation. Therefore, this study presented a system that provides screens customized for users, helps them disambiguate researcher profiles by deriving inter-data relationships from researcher-related data, and visualizes them.
Researcher-related data could be disambiguated using the proposed system by comparing researchers’ email addresses and research keywords. In addition, a time-line interface was developed that demonstrated the possibility of author disambiguation by tracking back individual attributes.
References
Choi, J.-H., Cho, H.-Y.: The recent trends of open access movements and the ways to help the cause by academic stakeholders. J. Korea Soc. Inf. Manage. 22(3), 307–326 (2005)
Laakso, M., Welling, P., Bukvova, H., Nyman, L., Björk, B.-C., Hedlund, T.: The development of open access journal publishing from 1993 to 2009.PLoS ONE, 6(6), 1–10 (2011)
Shim, W.: Big deal, open access, google scholar and the subscription of electronic scholarly contents at university libraries. J. Korea Soc. Inf. Manage. 29(4), 143–163 (2012)
Lee, S.-H., Kwak, S.-J.: Development and evaluation of authority data based academic paper retrieval system. J. Korean Soc. Libr. Inf. Sci. 46(2), 133–156 (2012)
Park, D.-J., Lee, S.-T., Choi, K.-S.: Conceptual design of metadata based research results information retrieval system. J. Korea Soc. Inf. Manage. 37(2), 1–20 (2006)
Seglen, P.O.: Why the impact factor of journals should not be used for evaluating research. Br. Med. J. (BMJ) 314(7079), 498–502 (1997)
Kang, I.-S.: Disambiguation of author names using co-citation. J. Korea Soc. Inf. Manage. 42(3), 167–186 (2011)
Calsa, J.W.: Daniel kotza: researcher identification: the right needle in the haystack. Lancet 371(9631), 2152–2153 (2008)
Gollapalli, S.D., Mitra, P., Giles, C.L.: Similar Researcher Search in Academic Environments. In: 12th ACM/IEEE-CS joint conference on Digital Libraries(JCDL 2012), pp. 167–170 (2012)
Jee, T.-C., Lee, H., Lee, Y.: Visualization method of document retrieval result based on centers of clusters. J. Korea Contents Soc. 7(5), 16–26 (2007)
Kim, S.-H., Kim, M.-J.: A usability evaluation on the visualization techniques of web retrieval results. J. Korean Soc. Libr. Inf. Sci. 41(3), 181–199 (2007)
Hwang, W.-S., Chae, S.-M., Kim, S.-W., Choi, H.J.: A ranking method for article search engines. J. Korean Inst. Inf. Sci. Eng. 40(5), 345–357 (2013)
Tunkelang, D.: Faceted Search. In: Lectures on Information Concepts, Retrieval, and Services. Morgan & Claypool Publishers (2009)
Jeong, D.-H., Hwang, M.-G., Sung, W.-K.: Generating knowledge map for acronym-expansion recognition. U- E-Serv. Sci. Technol. 264, 287–293 (2011)
VISJS. http://visjs.org/
Ratcliff, J.W., Metzener, D.: Pattern Matching: The Gestalt Approach. Dr. Dobb’s Journal 13, 46–72 (1988)
Author information
Authors and Affiliations
Corresponding author
Editor information
Editors and Affiliations
Rights and permissions
Copyright information
© 2015 Springer International Publishing Switzerland
About this paper
Cite this paper
Gim, J., Jang, Y., Chae, Y., Jung, H., Jeong, DH. (2015). A Data Visualization System for Considering Relationships Among Scientific Data. In: Fui-Hoon Nah, F., Tan, CH. (eds) HCI in Business. HCIB 2015. Lecture Notes in Computer Science(), vol 9191. Springer, Cham. https://doi.org/10.1007/978-3-319-20895-4_53
Download citation
DOI: https://doi.org/10.1007/978-3-319-20895-4_53
Published:
Publisher Name: Springer, Cham
Print ISBN: 978-3-319-20894-7
Online ISBN: 978-3-319-20895-4
eBook Packages: Computer ScienceComputer Science (R0)