
Abstract
We examine the foundation for hazard/risk assessment and its application to coastal problems. Historically, emphasis was on specifying expected values of wind waves and storm surges; however, as shown by the recent tsunamis in Southeast Asia in 2004 and in Japan in 2011, there are critical parts of the world where tsunamis represent the dominant threat to coastal communities. Recently, there has been an increased awareness of the combined effects of heavy rainfall and/or river discharge with surge levels and strong winds. This forcing combination played an important role in the flooding in southern Louisiana during Hurricane Isaac in 2012, where water levels exceeded the 500-year return interval levels. Such forcing combinations complicate both the modeling systems required for their simulation and the treatment of the multivariate probabilities that define the relative importance of their impacts.
We begin with a set of consistent hazards and risk definitions, along with comparative definitions from other fields. This should help readers who have focused primarily on traditional coastal hazards and risks understand the broader context of risk assessment and also allow readers with a broader perspective gain insight into the specific nature of coastal hazards and risk. Following this, we introduce the basic concepts used in estimating coastal hazards and risks. We then examine the historical perspective for the evolution of coastal risk assessment, beginning with early deterministic methods and culminating in a recent transition to probabilistic methods. The steady increase in the ability of probabilistic methods to deal with persistent problems such as the lack of data and uncertainty is documented as a part of this transition.
Access this chapter
Tax calculation will be finalised at checkout
Purchases are for personal use only
Abbreviations
- CDF:
-
cumulative distribution function
- EST:
-
empirical simulation technique
- ETM:
-
empirical track method
- GPD:
-
generalized Pareto distribution
- HWM:
-
high water mark
- JPM:
-
joint probability method
- MPI:
-
maximum possible intensity
- OS:
-
optimal sampling
- PBL:
-
planetary boundary layer
- PDF:
-
probability density function
- PMH:
-
probable maximum hurricane
- RMS:
-
root mean square
- SPH:
-
Standard Project Hurricane
References
P.L. Bernstein: Against the Gods: The Remarkable Story of Risk, 3rd edn. (Wiley, New York 1996)
P.S. Laplace: A Philosophical Essay on Probabilities (Wiley, London 1902), translated by F.W. Truscott, F.L. Emory
S. Bišanović: The length of cigarette smoking is the principal risk factor for developing COPD, Int. J. Collab. Res. Intern. Med, Public Health 4(1), 45–54 (2012)
H.G. Coleman, S. Bhat, B.T. Johnston, D. McManus, A.T. Gavin, L.J. Murray: Tobacco smoking increases the risk of high-grade dysplasia and cancer among patients with Barrett’s Esophagus, Gastroenterology 142(2), 233–240 (2011)
G.C. Kabat, M.Y. Kim, J. Wactawski-Wende, T.E. Rohan: Smoking and alcohol consumption in relation to risk of thyroid cancer in postmenopausal women, Cancer Epidemiol. 36(4), 335–340 (2012)
G.C. Kabat, N. Shivappa, J.R. Hébert: Mentholated cigarettes and smoking-related cancers revisited: An ecologic examination, Regul. Toxicol. Pharmacol. 63(1), 132–139 (2012)
O. Johansson-Stenman: Mad cows, terrorism and junk food: Should public policy reflect perceived or objective risks?, J. Health Econ. 27(2), 234–248 (2007)
A. Besaratinia, G.P. Pfeifer: Second-hand smoke and human lung cancer, Lancet Oncol. 9(7), 657–666 (2008)
L. Lazuras, A. Rodafinos, J.R. Eiser: Adolescents’ support for smoke-free public settings: The roles of social norms and beliefs about exposure to secondhand smoke, J. Adolesc. Health 49(1), 70–75 (2010)
J. Meadowcroft: Economic and political solutions to social problems: The case of second-hand smoke in enclosed public places, Rev. Political Econ. 23(2), 233–248 (2011)
S. Parsad: Planning for Human Settlements in Disaster Prone Areas (Manglam Publ., Delhi 2004)
E.J. Gumbel: Statistics of Extremes (Columbia Univ. Press, New York 1958)
M.R. Leadbetter, S. Lindgren, H. Rootzen: Extremes and related properties of random sequences and processes, Z. Wahrsch. Geb. 65, 291–306 (1983)
S. Resnick: Extreme Values, Point Processes and Regular Variation (Springer, New York 1987)
N. Cressie: Statistics for Spatial Data (Wiley, New York 1993)
S. Coles: An Introduction to Statistical Modeling of Extreme Values, Springer Series in Statistics (Springer, London 2001)
T. Aven: Foundations of Risk Analysis: A Knowledge and Decision-Oriented Perspective (Wiley, Chichester 2003)
M. Rausand: Risk Assessment: Theory, Methods, and Applications (Wiley, Hoboken 2011)
W.E. Fuller: Flood flows, Trans. Am. Soc. Civ. Eng. 77, 564–617 (1914)
R.E. Horton: Frequency of recurrence of Hudson River Floods, US Weather Bur. Bull. 2, 109–112 (1913)
A. Hazen: Discussion on flood Flows, Trans. Am. Soc. Civil Eng. 77, 626–632 (1914)
V.T. Chow: Handbook of Applied Hydrology (McGraw-Hill, New York 1964)
Y. Goda: Random Waves and Spectra. In: Handbook of Coastal and Ocean Engineering, Vol. 1, ed. by J.B. Herbich (Gulf Publ. Company, Houston 1990) pp. 175–212
Y. Goda: Distribution of Sea State Parameters and Data Fitting. In: Handbook of Coastal and Ocean Engineering, Vol. 1, ed. by J.B. Herbich (Gulf Publ. Company, Houston 1990) pp. 371–404
N. Hogben, F.E. Lumb: Ocean Wave Statistics (HMSO, London 1967)
J.A. Battjes: Long-term wave height distribution at seven stations around the British Isles, Dtsch. Hydr. Z. 25(4), 179–189 (1972)
M. Isaacson, N.G. Mackenzie: Long-term distributions of ocean waves, J. Waterw. Port Coast. Ocean Div. 107(2), 93–109 (1981)
C. Graham: The parameterization and prediction of wave height and wind speed persistence statistics for oil industry operational planning purposes, Coast. Eng. 6(4), 303–329 (1982)
S. Kuwashima, N. Hogben: The estimation of wave height and wind speed persistence statistics from cumulative probability distributions, Coast. Eng. 9(6), 563–590 (1986)
B. Efron: Bootstrap methods: Another look at the jackknife, Ann. Stat. 7(1), 1–26 (1979)
B. Efron: Nonparametric estimates of standard error: The jackknife, the bootstrap and other methods, Biometrika 68(3), 589–599 (1981)
B. Efron: The Jackknife, the Bootstrap, and Other Resampling Plans, CBMS-NSF Monographs, Vol. 38 (Society of Industrial and Applied Mathematics, Philadelphia 1982)
B. Efron: Better bootstrap confidence intervals, J. Am. Stat. Assoc. 82(397), 171–185 (1987)
C.F.J. Wu: Jackknife, bootstrap and other resampling methods in regression analysis (with discussions). Ann, Stat. 14, 1261–1350 (1986)
N. Scheffner, L. Borgman, D. Mark: Empirical simulation technique applications to a tropical storm surge frequency analysis of the coast of Delaware, Proc. 3rd Int. Conf. Estuar. Coast. Model. (1993)
V. Harcourt: Harbours and Docks, Vol. 1 (Clarendon Press, Oxford 1895)
H.E. Graham, D.E. Nunn: Meteorological considerations pertinent to the Standard Project Hurricane, Atlantic and Gulf Coasts of the United States, National Hurricane Res. Proj. Rep. No. 33 (Weather Bureau, Washington 1959)
R.W. Schwerdt, F.P. Ho, R.R. Watkins: Meteorological criteria for Standard Project Hurricane and Probable Maximum Hurricane Windfields, Gulf and East Coasts of the United States, Tech. Rep. NOAA-TR-NWS-23 (National Oceanic and Atmospheric Administration, Washington 1979)
J.L. Irish, D.T. Resio, J.J. Ratcliff: The influence of storm size on hurricane surge, J. Phys. Oceanogr. 38(9), 2003–2013 (2008)
J.L. Irish, D.T. Resio: A Hydrodynamics-based surge scale for hurricanes, Ocean Eng. 37(1), 69–81 (2010)
D.T. Resio, J.J. Westerink: Modeling the physics of hurricane storm surges, Phys. Today 61, 33–38 (2008)
S. Bunya, J.C. Dietrich, J.J. Westerink, B.A. Ebersole, J.M. Smith, J.H. Atkinson, R. Jensen, D.T. Resio, R.A. Luettich, C. Dawson, V.J. Cardone, A.T. Cox, M.D. Powell, H.J. Westerink, H.J. Roberts: A high-resolution coupled riverine flow, tide, wind, wind wave, and storm surge model for Southern Louisiana and Mississippi. Part I: Model Development and Validation, Mon. Weather Rev. 138, 345–377 (2010)
J.C. Dietrich, M. Zijlema, J.J. Westerink, L.H. Holthuijsen, C. Dawson, R.A. Luettich Jr., R.E. Jensen, J.M. Smith, G.S. Stelling, G.W. Stone: Modeling hurricane waves and storm surge using integrally-coupled, scalable computations, Coast. Eng. 58(1), 45–65 (2010)
D.T. Resio, J.L. Irish, J.J. Westerink, N. Powell: The effect of uncertainty on estimates of hurricane surge hazards, Nat. Hazards 66(3), 1443–1459 (2013)
R.A. Fisher, L.H.C. Tippett: Limiting forms of the frequency distribution of the largest or smallest member of a sample, Math. Proc. Camb. Philos. Soc. 24(02), 180–190 (1928)
B.V. Gnedenko: Sur la distribution limite du terme maximum d’une série aléatoire, Ann. Math. 44, 423–453 (1943)
L.E. Borgman, D.T. Resio: Extremal statistics in wave climatology. In: Topics in Ocean Physics, ed. by A. Osborne, P.M. Rizzoli (North-Holland, Amsterdam 1982) pp. 387–417
P. Embrechts, C. Klüppelberg, T. Mikosch: Modelling Extremal Events for Insurance and Finance (Springer, Berlin, Heidelberg 1997)
A.F. Jenkinson: The frequency distribution of the annual maximum (or minimum) values of meteorological elements, Quart. J. R. Meteorol. Soc. 81, 158–171 (1955)
J. Pickands: Statistical inference using extreme order statistics, Ann. Stat. 3(1), 119–131 (1975)
A.C. Davison, R.L. Smith: Models for exceedances over high thresholds (with discussion), J. R. Stat. Soc. B 52(3), 393–442 (1990)
E. Castillo, A.S. Hadi: Fitting the generalized Pareto distribution to data, J. Am. Stat. Assoc. 92, 1609–1620 (1997)
D.T. Resio: Some aspects of extreme wave prediction related to climatic variations, Proc. 10th Annu. Offshore Technol. Conf. (1978), OTC-3278-MS
N.R. Mann, R.E. Schafer, N.D. Singpurwalla: Methods for Statistical Analysis of Reliability and Life Data (Wiley, New York 1974)
M. Engelhardt, L.J. Bain: On prediction limits for samples from a Weibull or extreme-value distribution, Technometrics 24, 147–150 (1982)
J.K. Patel: Prediction intervals – A Review, Commun. Stat. Theory Methods 18(7), 2393–2465 (1989)
I.I. Gringorten: A simplified method of estimating extreme values from data samples, J. Appl. Meteorol. 2, 82–89 (1962)
I.I. Gringorten: Extreme Value Statistics in Meteorology – A Method of Application, Air Force Surveys in Geophys. N. 125 (Air Force Cambridge Research Center, Bedford 1963)
G.R. Toro, D.T. Resio, D. Divoky, A.W. Niedoroda, C. Reed: Efficient joint probability methods for hurricane surge frequency analysis, Ocean Eng. 37(1), 125–134 (2010)
V.J. Cardone, W.J. Pierson, E.G. Ward: Hindcasting the directional spectra of hurricane generated waves, J. Petrol. Technol. 28, 385–394 (1976)
S.G. Coles, J.A. Tawn: Statistics of coastal flood prevention, Philos. Trans. R. Soc. Lond. A 332, 457–476 (1990)
N.W. Scheffner, L.E. Borgman, D.J. Mark: Empirical simulation technique based storm surge frequency analysis, J. Waterw. Port Coast. 122, 93–101 (1996)
E.F. Thompson, N.W. Scheffner: Typhoon-Induced Stage-Frequency and Overtopping Relationships for the Commercial Port Road, Territory of Guam (Coastal and Hydraulics Laboratory, US Army Corps of Engineers Engineer Research and Development Center, Vicksburg 2002), ERD/CHL TR-02-1
H.W. van den Brink, G.O. Konnen, J.D. Opsteegh, G.J. van Oldenborgh, G. Burgers: Improving 104-year surge level estimates using data of the ECMWF seasonal prediction system, Geophys, Res. Lett. 31, L17210 (2004)
US Army Corps of Engineers: Performance Evaluation of the New Orleans and Southeast Louisiana Hurricane Protection System, Final Report of the Interagency Performance Evaluation Task Force. Vol. VII – The consequences (US Army Corps of Engineers, Washington 2006)
US Army Corps of Engineers: Performance Evaluation of the New Orleans and Southeast Louisiana Hurricane Protection System, Final Report of the Interagency Performance Evaluation Task Force. Vol. VIII – Engineering and Operational Risk and Reliability Analysis (National Oceanic and Atmospheric Administration, Washington 2009)
V.A. Myers: Storm Tide Frequencies on the South Carolina Coast, NOAA Tech. Rep. NWS-16 (National Oceanic and Atmospheric Administration, Washington 1975)
F.P. Ho, V.A. Myers: Joint Probability Method of Tide Frequency Analysis applied to Apalachicola Bay and St. George Sound, Florida, NOAA Tech. Rep. NWS, Vol. 18 (National Oceanic and Atmospheric Administration, Washington 1975)
F.P. Ho, J.C. Su, K.L. Hanevich, R.J. Smith, F.P. Richards: Hurricane Climatology for the Atlantic and Gulf Coasts of the United States, NOAA Tech. Rep. NWS, Vol. 38 (National Oceanic and Atmospheric Administration, Washington 1987), completed under agreement EMW-84-E-1589 for FEMA
D.T. Resio, J.L. Irish, M.C. Cialone: A surge response function approach to coastal hazard assessment: Part 1: Basic Concepts, Nat. Hazards 51(1), 163–182 (2009)
D.H. Levinson, P.J. Vickery, D.T. Resio: A review of the climatological characteristics of landfalling Gulf hurricanes for wind, wave, and surge hazard estimation, Ocean Eng. 37(1), 13–25 (2010)
S.K. Kimball: A modeling study of hurricane landfalls in a dry environment, Mon. Weather Rev. 134, 1901–1918 (2006)
A.W. Niedoroda, D.T. Resio, G.R. Toro, D. Divoky, H.S. Das, C.W. Reed: Analysis of the coastal Mississippi storm surge hazard, Ocean Eng. 37, 82–90 (2010)
J.L. Irish, D.T. Resio, M.C. Cialone: A surge response function approach to coastal hazard assessment: Part 2: Quantification of spatial attributes of response functions, J. Nat. Hazards 51(1), 183–205 (2009)
J.L. Irish, D.T. Resio, D. Divoky: Statistical properties of hurricane surge along a coast, J. Geophys. Res. 116, C10007 (2011)
G.J. Holland: An analytic model of the wind and pressure profiles in hurricanes, Mon. Weather Rev. 108, 1212–1218 (1980)
E.F. Thompson, V.J. Cardone: Practical modeling of hurricane surface wind fields, J. Waterw. Port Coast. Ocean Eng. 122(4), 195–205 (1996)
P.J. Vickery, P.F. Skerjl, L.A. Twisdale: Simulation of hurricane risk in the U.S. using empirical track model, J. Struct. Eng. 126(10), 1222–1237 (2000)
M.D. Powell, P.J. Vickery, T.A. Reinhold: Reduced drag coefficient for high wind speeds in tropical cyclones, Nature 422, 279–283 (2003)
V.J. Cardone, A.T. Cox: Tropical cyclone wind field forcing for surge models: Critical issues and sensitivities, Nat. Hazards 51, 29–47 (2009)
J.J. Westerink, Personal communication with Dr. D.T. Resio. (2007)
Minimum Design Loads for Buildings and Other Structures, ANSI A58.1 (American National Standards Institute, New York 1982)
Standard Minimum Design Loads for Buildings and Other Structures, Report No. ANSI/ASCE 7-95 (American Society of Civil Engineers, New York 1996)
K.A. Emanuel: An air-sea interaction theory for tropical cyclones. Part I: Steady-state maintenance, J. Atmos. Sci. 43, 585–604 (1986)
G.J. Holland: The maximum potential intensity of of tropical cyclones, J. Atmos. Sci. 54, 2519–2541 (1997)
H. Tonkin, G.J. Holland, N. Holbrook, A. Henderson-Sellers: An evaluation of thermodynamic estimates of climatological maximum potential tropical cyclone intensity, Mon. Weather Rev. 128, 746–762 (2000)
M.C. Ortiz, L.A. Sarabia, M.S. Sánchez: Tutorial on evaluation of type I and type II errors in chemical analyses: From the analytical detection to authentication of products and process control, Anal. Chim. Acta 674, 123–142 (2010)
OSHA: Guidance For Hazard Determination For Compliance With The OSHA Hazard Communication Standard. (29 CFR 1910.1200) http://www.osha.gov/dsg/hazcom/ghd053107.html (2014)
USEPA: Community-based air pollution projects glossary, http://www.epa.gov/airquality/communitybase/glossary.html (2015)
USEPA: Waste and Cleanup Risk Assessment Glossary, http://www.epa.gov/oswer/riskassessment/glossary.htm (2015)
USEPA: Exposure Factors Handbook: 2011 Edition, EPA/600/R-09/052F (National Center for Environmental Assessment, USEPA Office of Research and Development, Washington 2011)
USEPA: Environmental Management System Glossary, http://www.epa.gov/region4/ems/glossary.htm (2015)
USEPA: Terms of Environment: Glossary, Abbreviations and Acronyms, EPA 175-8-92-001. (Office of Communications, Education, and Public Affairs, Washington 1992)
USEPA: Regional vulnerability assessment (ReVA) program glossary, http://www.epa.gov/glossary.html (2015)
USEPA: Integrated risk information system (IRIS) glossary, http://www.epa.gov/iris/help_gloss.htm (2015)
USEPA: Radiation protection radiation glossary, http://www.epa.gov/radiation/glossary/index.html (2015)
USEPA: RadNet Glossary (last updated on February 13, 2012), http://www.epa.gov/radnet/radnet-glossary.html
A. Barker, J. Kamar, M. Graco, V. Lawlor, K. Hill: Adding value to the stratify falls risk assessment in acute hospitals, J. Adv. Nursing 67(2), 450–457 (2011)
J.C. Fowler: Suicide risk assessment in clinical practice: Pragmatic guidelines for imperfect assessments, Psychotherapy 49(1), 81–90 (2012)
A.S. Prentiss: Early recognition of pediatric venous thromboembolism: A risk-assessment tool, Am. J. Crit. Care 21(3), 178–184 (2012)
N. Scurich, R.S. John: Prescriptive approaches to communicating the risk of violence in actuarial risk assessment, Psychol. Public Policy Law 18(1), 50–78 (2012)
G. Côté, A.G. Crocker, T.L. Nicholls, M.C. Seto: Risk assessment instruments in clinical practice, Can. J. Psychiatry 57(4), 238–244 (2012)
US Department of Health and Human Services: Guidance for Industry Development and Use of Risk Minimization Action Plans (FDA Center for Drug Evaluation and Research (CDER), FDA Center for Biologics Evaluation and Research (CBER), Washington 2005), online at http://www.fda.gov/downloads/RegulatoryInformation/Guidances/UCM126830.pdf
Nuclear Regulatory Commission: Glossary, http://www.nrc.gov/reading-rm/basic-ref/glossary.html#R (2015)
Nuclear Regulatory Commission: Glossary, http://www.nrc.gov/readng-rm/basic-ref/glossary/html
USEPA: Environmental insurance and risk management tools glossary of terms, http://www.epa.gov/brownfields/insurance/ei_glossary_06.pdf (2004)
Farlex, Inc: The Farlex financial dictionary, http://financial-dictionary.thefreedictionary.com/ (2012)
J. Guinan: Investopedia: The (I)Investopedia Guide To Wall Speak (McGraw-Hill, New York 2009)
A. Chernobai, P. Jorion, F. Yu: The determinants of operational risk in US financial institutions, J. Financ. Quant. Anal. 46(6), 1683–1725 (2011)
G. van de Venter, D. Michayluk, G. Davey: A longitudinal study of financial risk tolerance, J. Econ. Psychol. 33(4), 794–800 (2012)
K. Watson Hankins: How do financial firms manage risk? Unraveling the interaction of financial and operational hedging, Manag. Sci. 57(12), 2197–2212 (2012)
M. Drehmann, K. Nikolaou: Funding liquidity risk: Definition and measurement, J. Bank. Finance 37(7), 2173–2183 (2013)
E. Vasile, I. Croitoru, D. Mitran: Risk management in the financial and accounting activity, Anul VII 3(27), 13–24 (2012)
United Nations: Risk management, Office of Internal Oversight Services http://www.un.org/Depts/oios/pages/risk_management.html (2010)
ISO 31000: Risk Management Principles and Guidelines (International Organization for Standardization, Geneva 2009)
W.M. Organization: Scientific assessment of ozone depletion. In: WMO Global Ozone Research and Monitoring Project, Report No. 44, ed. by D.L. Albritton, P.J. Aucamp, G. Megie, R.T. Watson (World Meteorological Organization, Geneva 1998)
Skin Cancer Foundation: Facts about sunburn and cancer, http://www.skincancer.org/prevention/sunburn/factsabout-sunburn-and-skin-cancer (2013)
Author information
Authors and Affiliations
Corresponding author
Editor information
Editors and Affiliations
Appendix: Glossary of Probability and Risk Terms
Appendix: Glossary of Probability and Risk Terms
-
Confidence intervals: A confidence interval is a statistical representation of how certain one is that a given variable will lie within a given range. A confidence interval includes two components – the interval (the value will be between x and y) and the level of certainty (a 90 % confidence interval indicates one can say that there is a 90 % probability the value will fall between the cited interval. As the interval gets smaller, the certainty that the values will fall within the interval goes down. Confidence intervals are related to uncertainty in that they are a statistical method of measuring uncertainty of a predicted value based on past data that provides the probability distribution and variance of the specific parameter of interest.
-
Error: Error itself has multiple meanings. In the modeling/predictive sense, the concept of error requires that there be a correct answer against which to compare a predicted answer (modeling context) or sample result (statistical context). Error is then defined as the difference between the actual and predicted answer or measured sample. Therefore, in the sense of predictive risk assessment (looking forward in time), error is not a useful concept, as there is not yet any actual or true value against which to measure or compare. Error should not be confused with mistake, which is the result of an incorrect assumption, calculation or model formulation. The hallmark of a mistake is that it is avoidable.
-
Error (Types I and II): Type I error and Type II error are technical terms used in statistics to describe particular types of erroneous results in a testing process. The terms relate to the acceptance or rejection of the hypothesis being tested (the null hypothesis). If the null hypothesis was rejected (found to be false) when it actually is true, then a Type I error occurred. Conversely, if the null hypothesis is not rejected (found to be true) when it actually is not true, a Type II error has occurred. These definitions correlate to the concepts of false positives (Type 1 error) and false negatives (Type II error) in testing. For a good technical tutorial on Type I and Type II errors [26.87].
-
Exposure: The process of the receptor coming into contact with the hazard.
-
Exposure pathway: The route by which the receptor is exposed. For animals, this is either by ingestion, inhalation, or dermal absorption.
-
Exposure assessment: Quantitative analysis of how much (concentration, duration) of the hazard reaches the receptor.
-
Hazard/stressor: An event (storm, accident), agent (chemical, radiation), situation or action with a potential for an undesirable consequence, such as harm to property, the environment, and human health or life. This term is often used synonymously with threat.
-
Probability: In its most basic sense, probability is the chance or likelihood that something will happen. Qualitatively, the more likely an event is to happen, the more probable the event is. Quantitatively, probability is a value between 0 and 1, with 1 representing absolute certainty of the event occurring. The probability of an event is typically measured as the ratio of the number of times an event occurred over the total number of times the event could have occurred. For example, if we consider the event to be the occurrence of precipitation on any given day, we would collect information on whether it rained on a given day for a period of time (say 1 year). The probability of rain would then be
-
Probability distribution: The basic definition of probability works for discrete events, but when the event or parameter being evaluated is continuous in nature (the maximum temperature on any given day, the stage of a river on any given day), then a single probability is not sufficient. Instead, possible values are grouped into discrete ranges, and the number of occurrences in that range are counted then divided by the total number of measurements.
-
Receptor: A receptor is the specific thing or entity being affected by the hazard/stressor. In a human health risk assessment – the receptor is a person.
-
Risk: The potential for realization of unwanted, adverse consequences to human life, health, property, or the environment. The estimation of risk is usually quantified using the expected value of the conditional probability of the event occurring times the consequence of the event given that it has occurred. This definition is currently used by the Society of Risk Analysis. Mathematically, this is expressed as
(26.23)where risk (a probability from 0 to 1), probability of event (A) occurring, and probability of a consequence (B) occurring given that event A occurred.
This technical definition is what will be used through this handbook. However, there are other definitions in other fields of which the knowledgeable practitioner should be aware. Table 26.2 presents a summary of other definitions used in various fields and a list of citations to which one may refer for more information. In each case, the same mathematical representation can be used, but there are assumptions made that result in the definition being slightly different. This is also presented in Table 26.2.
Table 26.2 Risk definitions in different applications Besides having multiple potential definitions, risk can also be differentiated by types. Different types of risk, even if they are of the same quantitative value, are often managed differently or even ignored. Some of the common risk types that greatly influence both how these risks are assessed, managed and communicated are defined below.
-
Actual risk: A scientifically verifiable risk. For example, it is well researched and documented that smoking places you at-risk for cancer [26.3, 26.4, 26.5, 26.6]. Actual risk is sometimes referred to as objective risk, but whether risk is subjective or objective is related more to its ability to be measured than it is to its actual verifiability.
-
Perceived risk: Risk that is thought to exist by an individual or group that is non-existent or exaggerated. This often occurs in situations where the public is misinformed or in which media reports instill unnecessary panic. Food safety concerns often top the list of such events and lead to the significant public policy debates, see, for example, [26.7].
-
Assumed risk: Risk that is taken by choice. Assumed risk can be quantifiably large or small, and actual or perceived. For example, individuals who choose to partake in risky activities (skydiving, mountain climbing) choose to assume the relatively large risks associated with these activities, but choosing to drive a car, take medicines or be involved in day-to-day activities all involve some assumed risk.
-
Comparative risk: Risk placed in context through comparison with another, perhaps better known risk. For example, stating that one is more likely to be hit by a meteor than to be injured in a plane crash compares a risk that people perceive as low (being hit by a meteor) with one they perceive as high but which actually is not. This helps place the risk in a conceptual framework.
-
Imposed risk: Risk that is forced upon an individual, either without the knowledge of the individual or if known, without consent. For example, second-hand smoke exposure is seen as an imposed risk [26.10, 26.8, 26.9]. Natural events such as earthquakes, hurricanes. and extreme weather events are, to a large extent, imposed risks, but to some extent individuals assume that risk based on where they choose to live. For an interesting approach to this, the reader is referred to the work of Parsad [26.11].
-
Relative risk: Risk of a particular outcome compared between two different groups or conditions. The relative risk is calculated as
Thus relative risk proved a value of the risk for Condition 1 as a multiple of the risk for Condition 2. For example: suppose property bordering a coastline (Condition 1) has a 30 % probability of being inundated during a storm surge, while properties over 100 m away from the coastline (Condition 2) have a 25 % probability of inundation. The relative risk of inundation is, therefore, 1.2 times higher along the coastline (Condition 1).
It is imperative that the underlying information about the actual baseline risk be given (i. e., 30 % and 25 % probability of inundation). Relative risk statistics where no baseline information is given can be very misleading. For example, if there is a 1 in 1000000 (10) chance of an event at location A, and a 1 in 10000000 chance of the same event at location B, saying that location A has a 10 times greater risk than B belies the fact that the risk is still exceedingly small at location A.
-
Percent increased risk: Risk of a particular outcome compared between two different groups or conditions measured as a relative difference of the two risks related to a base risk. Percent increases risk is calculated as
Using our example from conditional risk, the percent risk increase for inundation by living on the coast would be
Just as with relative risk, it is imperative that the underlying information about the actual baseline risk be given (i. e., 30 % and 25 % probability of inundation). Percentage increased risk can be even more misleading than relative risk, especially where small risks are involved. For example, if there is a 1 in 1000000 (10) chance of an event at location A, and a 1 in 10000000 chance of the same event at location B, the percent increased risk at location A would be 900 %, which clearly presents a very different picture than saying that location A has a one in a million chance of the event.
-
-
Risk analysis: The overall name given to the application of risk concepts to decision making. It involves detailed examinations performed to understand the nature of unwanted, negative consequences to human life, health, property, or the environment. The process includes identification of potential events (scenarios), quantitative and/or qualitative assessment of risk, analysis of risk management alternatives, and communication of that risk to the necessary stakeholders; an analytical process to provide information regarding undesirable events; and the process of quantification of the probabilities and expected consequences for identified risks. Figure 26.11 gives a graphical representation of the iterative and highly interactive relationship of the various aspects of risk analysis.
Fig. 26.11 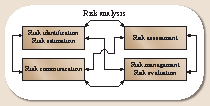
Graphical representation of relationship of the elements of risk analysis
-
Risk assessment: The use of scientifically supported relationships to evaluate the magnitude and probability of adverse impacts on selected endpoints of specific actions, events or hazards/stressors. The assessment may be either qualitative or quantitative. An example of a qualitative risk assessment is the prediction of cancer based on decreased ozone in the atmosphere conducted by the World Meteorological Organization. The risk assessment predicted that if conditions did not change, there would be 50 million additional skin cancer cases due to sunburn by the year 2000 [26.116]. An example of a qualitative risk assessment concerning the same topic (cancer from sunburn) is that a person’s risk for melanoma – the most serious form of skin cancer–doubles if he or she has had five or more sunburns [26.117].
-
Risk estimation: The scientific determination of the characteristics of hazards/threats, usually in as quantitative a way as possible. This includes the magnitude, spatial scale, duration, and intensity of adverse consequences and their associated probabilities, as well as a description of the cause and effect links.
-
Risk evaluation: A component of risk assessment in which judgments are made about the significance and acceptability of risk.
-
Risk identification: Recognizing that a hazard exists and trying to define its characteristics. Often risks exist and are even measured for some time before their adverse consequences are recognized. In other cases, risk identification is a deliberate procedure to review, and it is hoped, to anticipate possible hazards.
-
Stochastic: The property of having inherent random variation. The variation in a stochastic process, while random, is describable through probability theory (see uncertainty and variability below).
-
Threat: See hazard/stressor above.
-
Uncertainty: Uncertainty is a widely used term that is unfortunately often misused as a catchall term. In some instances, it is erroneously applied to the concept of confidence interval, which is actually a method of quantifying uncertainty. For the purpose of risk assessment, modeling, and/or prediction, uncertainty arises from three main components: error, variation, and lack of knowledge (see definitions herein and in the chapter text).
-
Variability (alleatory uncertainty): Variability is a range of potential values for a given parameter. Variability is a natural characteristic of natural processes (also called natural variation). It is describable using probability distributions. The result of natural variation is sometimes called alleatory uncertainty. Variability in natural processes (and the resulting alleatory uncertainty ) cannot be reduced, as it is an inherent property of the process itself.
-
Lack of knowledge (epistemic uncertainty): The result of a lack of knowledge in risk assessments is also sometimes called epistemic uncertainty. A lack of knowledge can arise because the knowledge is not yet scientifically available – and as such, it can be reduced (along with the resulting epistemic uncertainty) going forward through additional data, experimentation, theoretical development, and scientific inquiry. However, lack of knowledge also includes things that we do not even know we do not know. This area of lack of knowledge is more difficult, because it is not easily identifiable and as such, becomes included in variability, or is called error when comparing model results to reality.


Rights and permissions
Copyright information
© 2016 Springer-Verlag Berlin Heidelberg
About this chapter
Cite this chapter
Resio, D.T., Tumeo, M.A., Irish, J.L. (2016). Statistical Characterization of Hazards and Risk in Coastal Areas. In: Dhanak, M.R., Xiros, N.I. (eds) Springer Handbook of Ocean Engineering. Springer Handbooks. Springer, Cham. https://doi.org/10.1007/978-3-319-16649-0_26
Download citation
DOI: https://doi.org/10.1007/978-3-319-16649-0_26
Publisher Name: Springer, Cham
Print ISBN: 978-3-319-16648-3
Online ISBN: 978-3-319-16649-0
eBook Packages: EngineeringEngineering (R0)