
Abstract
The paper traces the road to the first fully performance- and displacement-based European seismic standard, namely Part 3 of Eurocode 8 on assessment and retrofitting of existing buildings and from there to the part of the fib Model Code 2010 (MC2010) on performance- and displacement-based seismic design and assessment of all types of concrete structure. Performance-based seismic design is set in the broader context of performance-based engineering and European Limit State design. The major features of Part 3 of Eurocode 8 are presented, focusing on seismic demands and ‒ mainly ‒ on cyclic deformation capacities. Emphasis is placed on the need to use in the analysis an effective elastic stiffness which realistically represents the member secant-to-yield-point stiffness, in order to predict well the seismic deformation demands. The background of the effective stiffness and the deformation and shear capacity sides in Part 3 of Eurocode 8 is presented, with a view on developments of the State-of-Art after these aspects were finalized in Eurocode 8. The focus turns then on the seismic part of MC2010, showing the differences with Part 3 of Eurocode 8 due to recent advances in the State-of-the-Art, the difference between design of new structures and assessment of existing ones (including the need to estimate the secant-to-yield-point stiffness without knowing the reinforcement), the wider scope of MC2010 beyond buildings, etc. It is emphasised that member detailing per MC2010 is not based anymore on opaque prescriptions, but on transparent, explicit verification of inelastic deformation demands against capacities.
You have full access to this open access chapter, Download chapter PDF
Keywords
These keywords were added by machine and not by the authors. This process is experimental and the keywords may be updated as the learning algorithm improves.
7.1 The European Seismic Codes Before EN-Eurocode 8
Since the early 1990s the activity of the European Earthquake Engineering community has been centred around and motivated by the drive towards a European Standard for seismic design: Eurocode 8. From early on this standard was permeated by performance-based concepts with a strong European flavour. In fact, in Europe, Performance Levels in seismic design, assessment or retrofitting have always been associated to, or identified with Limit States. The Limit State concept was introduced in the 1960s in Europe to define states of unfitness of the structure for its intended purpose (CEB 1970; Rowe 1970): Ultimate Limit States (ULS) concern safety, whilst Serviceability Limit States (SLS) the normal function and use of the structure, comfort of occupants, or damage to property; intermediate Limit States were also considered. These fundamental CEB documents and the two CEB/FIP Model Codes (CEB 1978, 1991) were the basis of Limit State design for all structural materials in the pre-Norm (CEN 1994a) and European Norm (CEN 2002) versions of the Eurocodes, and for concrete structures in particular (CEN 1991, 2004b). According to the Eurocode concerning the basis of structural design (CEN 1994a, 2002), the Limit States approach is the backbone of structural design for any type of action, including the seismic one.
Neither of the two CEB/FIP Model Codes covered seismic design. However, the CEB Model Code for seismic design of new concrete structures (CEB 1985) was meant to be a “Seismic Annex” to the CEB/FIP Model Code 1978, mainly for concrete buildings. It introduced two Limit States: (a) Structural Safety and (b) Serviceability, but design for both was for a single hazard level. The structure was to be proportioned for force resistance against elastic lateral forces derived from the 5 %-damped elastic response spectrum reduced by the “behaviour factor” q, assuming uncracked gross section stiffness. Interstorey drifts computed via the “equal displacement rule” under the same seismic action were limited to 2.5 % if only the protection of the structure is of concern, or to 1 % for Serviceability of brittle building partitions (1.5 % for non-brittle ones). Three “Ductility Levels” were included for buildings: the higher the ductility level, the larger was the q-factor and the more stringent the member detailing (albeit prescriptive). The two upper ductility levels employed “capacity design” to prevent brittle shear failure of members and soft storey plastic mechanisms in weak column-strong beam frames; the ultimate objective was global ductility.
The European Prestandard (ENV) on the seismic design of buildings of any type of material (CEN 1994b, c, d) was based on the CEB “Seismic Annex” (CEB 1985). It differed from it in that its scope covered the major structural materials, and in that distinct hazard levels were introduced for the two Limit States. The ULS against Life-threatening Collapse is checked in the same way as in the 1985 CEB seismic Model Code (except for the interstorey drift limitation) under the 475-year earthquake (10 % exceedance probability in 50 years), at least for structures of ordinary importance. For the SLS against damage and loss of use, the interstorey drift limit is 0.4 % (0.6 % for non-brittle partitions) and is checked under 50 % of the 475-year earthquake, again using uncracked gross section properties and the “equal displacement rule”. The alternative options for ductility – termed now “Ductility Classes” – remained three; capacity design against shear failure of beams was limited to the higher Class.
The European Pre-standard (ENV) on repair and seismic strengthening of existing buildings (CEN 1996) did not present any conceptual advancement over its counterpart for new buildings (CEN 1994b, c, d). Except that the interstorey drift limits were not meant to be checked under the Serviceability earthquake, and that the evaluation criteria for existing buildings were limited to full conformity to the requirements of one of the three “Ductility Classes” of the ENV for new buildings (CEN 1994b, c, d) under a reduced seismic action which depends on the remaining lifetime. Retrofitting was also meant to ensure full conformity with the rules of the ENV for new buildings for one of its three “Ductility Classes”.
As there was no seismic follow-up to the 1990 CEB-FIP Model Code (CEB 1991), the European Standard for seismic design of new buildings of any material (CEN 2004b) evolved from the ENV version (CEN 1994b, c, d), incorporating important developments in the State-of-the-Art which had matured in the meantime. Most of the completely new points were not specific to concrete: design with seismic isolation, capacity design of the foundation, composite (steel-concrete) buildings, design with nonlinear analysis and direct verification of deformation demands, etc. This last feature is of special importance, as it presaged the recent codification of displacement-based seismic design of new buildings in the Model Code 2010 of fib (2012). A very important parallel development was the European Standard for “Assessment and retrofitting of buildings” (CEN 2005a), which was the first fully and explicitly performance- and displacement-based seismic code in Europe and has formed the basis for the seismic design and assessment part of the fib Model Code 2010. As these two important documents will be a natural basis for the upcoming revision of the most important parts of Eurocode 8 (CEN 2004a, 2005a, b), they are the subject of the present paper, which attempts to provide some insight into their rationale, shed light onto their background and look for indications about where they may lead in the near future.
7.2 Performance-Based Earthquake Engineering
Traditionally, structural design codes have been the responsibility of Public Authorities, with public safety as the compelling consideration. Accordingly, traditional seismic design codes aim at protecting human life by preventing local or global collapse under a single level of earthquake. The no-(local-)collapse requirement normally refers to a rare seismic action, termed “design seismic action”. In most present-day codes the “design seismic action” for ordinary structures has a 10 % probability to be exceeded in a conventional working life of 50 years (i.e., a mean return period of 475 years).
As early as the 1960s the international earthquake engineering community was aware of the property loss and other economic consequences due to frequent seismic events. Recognizing that it is not feasible to avoid damage under very strong earthquakes, the Structural Engineers Association of California (SEAOC) adopted in its 1968 recommendations for seismic design the requirements below:
“Structures should, in general, be able to:
-
1.
Resist a minor level of earthquake ground motion without damage.
-
2.
Resist a moderate level of earthquake ground motion without structural damage, but possibly experience some nonstructural damage.
-
3.
Resist a major level of earthquake ground motion having an intensity equal to the strongest either experienced or forecast for the building site, without collapse, but possibly with some structural as well as nonstructural damage.”
Major earthquakes that hit developed countries in the second half of the 1980s and the first half of the 1990s caused relatively few casualties but very large damage to property and economic loss. “Performance-based earthquake engineering” emerged, in response, in the SEAOC Vision 2000 document and developed into the single most important idea of late for seismic design or retrofitting of buildings (SEAOC 1995).
“Performance-based engineering” in general focuses on the ends; notably on the ability of the engineered facility to fulfill its intended purpose, taking into account the consequences of failure to meet it. Present-day design codes, by contrast, are process-oriented, emphasizing the means, namely prescriptive, handy, but opaque design rules, that disguise the pursuit of satisfactory performance. Such rules have developed over time into a convenient means to provide safe-sided, yet economical solutions for common combinations of structural layout, dimensions and materials. They leave limited room to judgment and creativity in conceptual design and do not lend themselves for innovation that benefits from new advances in technology or materials.
“Performance-based earthquake engineering” in particular aims to optimize the utility from the use of a facility by minimizing its expected total cost, including the short-term cost of the work and the expected value of the loss in future earthquakes (in terms of casualties, cost of repair or replacement, loss of use, etc.). In general, it should account for all possible future seismic events and their annual probability, carry out a convolution with the corresponding consequences during the working life of the facility and minimize the expected total cost. However, this is not a practical design approach. So, present-day “performance-based seismic design” just replaces the traditional single-tier design against life-threatening collapse and its prescriptive rules with transparent multi-tier seismic design or assessment, meeting more than one discrete “performance levels”, each one under a different seismic event, identified through its annual probability of being exceeded (the “seismic hazard level”). Each “performance level” is identified with a physical condition of the facility and its possible consequences (likely casualties, injuries and property loss, continued functionality, cost and feasibility of repair, expected length of disruption of use, cost of relocation, etc., see Table 7.1 for the example of fib Model Code 2010). The “performance objective” is then a requirement to meet a set of “performance levels” under the associated “seismic hazard level”. A four-tier “performance objective” similar to the one reflected in the first three and the last column of Table 7.1 was introduced for ordinary buildings by the Vision 2000 document (SEAOC 1995); it has served ever since as the basis for “Performance-based earthquake engineering”.
7.3 Displacement-Based Seismic Design or Assessment
The earthquake is a dynamic action, introducing to the structure a certain energy input and imposing certain displacement and deformation demands, but not specific forces. The forces are generated by the structure in response to the seismic displacements and depend on its resistance. It is the deformations that make a structural member lose its lateral load resistance and it is the lateral displacements (not the lateral forces) that cause a structure to collapse in an earthquake under its own weight due to second-order (P-Δ) effects. So, deformations and displacements represent a much more rational basis than forces for the seismic design, assessment or retrofitting of structures. For this reason, displacement-based seismic design has been proposed by Moehle (1992) and Priestley (1993) as a more rational alternative to the traditional forced-based design approach.
For new structures, procedures for direct dimensioning of RC members on the basis of given deformation demands were not available early on; hence in displacement-based design, dimensioning of new members has often been reduced to familiar force-based dimensioning (Priestley et al. 2007). In seismic assessment, though, which is an analysis rather than a synthesis problem, the deformation capacities of members can be easily computed for given dimensions, material properties and reinforcement. So, seismic assessment of existing structures provides better grounds than the design of new ones for deformation- and displacement-based verification. Retrofitting interventions may also be conceived as a means to reduce the seismic deformation demands on the existing members below their current deformation capacities. For these reasons, a holistic displacement- and performance-based approach was first introduced in seismic assessment, not in design, through the pioneering “NEHRP guidelines for the seismic rehabilitation of buildings” (ATC 1997), which soon became the reference for displacement-based seismic assessment and developed fairly recently into an ASCE Standard (ASCE 2007).
7.4 Performance- and Displacement-Based Seismic Assessment of Existing Buildings in Part 3 of EN-Eurocode 8
7.4.1 The Context
Part 3 of EN-Eurocode 8 (CEN 2005a, 2009) broke completely with its force-based predecessor for existing buildings (CEN 1996) and its companion for new ones (CEN 2004a) and developed in the footsteps of (ATC 1997) into a full-fledged performance- and displacement-based seismic standard for existing buildings ‒ the first one in Europe and the only one in the suite of 58 EN-Eurocodes of the first generation which deals with existing structures.
Unlike all other EN-Eurocodes, which apply to all structures within their scope, namely to all new ones, Part 3 of EN-Eurocode 8 does not apply to all existing buildings, but only to the ones which their owner or competent Authorities decide to seismically assess and retrofit. Part 3 of EN-Eurocode 8 addresses only the structural aspects of seismic assessment and retrofitting and will apply once the requirement to assess a particular building has been established. The conditions under which seismic assessment of individual buildings – possibly leading to retrofitting – may be required are beyond its scope. The initiative for seismic assessment and retrofitting lies with the owner, unless a national or local program is undertaken for seismic risk mitigation through seismic assessment and retrofitting. The differentiation between “active” and “passive” seismic assessment and retrofitting programs should be noted in this respect. “Active” programs may require owners of certain categories of buildings to meet specific deadlines for the completion of the seismic assessment and – depending on its outcome – of the retrofitting. The categories of buildings to be targeted may depend on the seismicity and ground conditions, the importance class and occupancy and the perceived vulnerability of the building (as influenced by the type of material and construction, the number of storeys, the date of construction relative to those of older code enforcement, etc.). “Passive” programs associate seismic assessment – possibly leading to retrofitting – with other events or activities related to the use of the building and its continuity, such as a change in use that increases occupancy or importance class, remodelling above certain limits (as a percentage of the building area or of the total building value), repair of damage after an earthquake, etc. The choice of Performance levels ‒ “Limit States” in (CEN 2004a) ‒ to be checked, as well as the return periods of the seismic action ascribed to them, may depend on the adopted program for assessment and retrofitting, which is more stringent in “passive” programs than in “active” ones. For example, in “passive” programs triggered by remodelling, the requirements may escalate as the extent and cost of the remodelling increases.
7.4.2 Performance Objectives
Part 3 of Eurocode 8 introduces three “performance levels”, called “Limit States”:
-
“Damage Limitation” (DL), similar to “Immediate Occupancy” in (SEAOC 1995; ATC 1997; ASCE 2007) and the first Limit State in Table 7.1.
-
“Significant Damage” (SD), which corresponds to “Life Safety” in (SEAOC 1995; ATC 1997; ASCE 2007), to the third Limit State in Table 7.1 and to the (local-)collapse prevention requirement which applies to new buildings per Part 1 of EN-Eurocode 8 (CEN 2004a).
-
“Near Collapse” (NC), similar to “Collapse Prevention” in (SEAOC 1995), (ATC 1997) or (ASCE 2007) and the third Limit State in Table 7.1.
In line with the policy of EN-Eurocodes to allow decision at national level regarding all safety-related issues, the “Seismic Hazard” levels for which the three “Limit States” above are to be met are Nationally-Determined-Parameters (NDPs) specified by National Authorities. National Authorities may also specify whether all three “Limit States” shall be met under the corresponding “Seismic Hazard” level, or whether verification of just one or two of them at the corresponding “Seismic Hazard” levels suffices. National Authorities may choose these levels so that the number of buildings that need retrofitting is acceptable to society and the national economy and/or retrofitting is not economically prohibitive, increasing the chances that owners will retrofit deficient property at their own initiative.
7.4.3 Compliance Criteria
A distinction is made in Part 3 of Eurocode 8 between “primary” and “secondary” structural elements, depending on their role and importance in the lateral-force-resisting system. There is no restriction on the number of “secondary” elements or their collective contribution to the total lateral resistance or stiffness. More relaxed compliance criteria apply for them. So the engineer may designate elements of the existing or the retrofitted building as “secondary”, depending on the outcome of the verifications and his/her judgment on the importance of these elements. What he/she may not do is to deliberately choose the plan- or heightwise distribution of “secondary” elements to change the classification of the structural system from irregular to regular (which in turn determines the method of analysis allowed).
A distinction is also made between “ductile” and “brittle” mechanisms: for RC members and joints, flexure (with or without axial load) or shear, respectively. Verifications and compliance criteria of “ductile” mechanisms are expressed in terms of deformations; “brittle” ones are checked in terms of forces.
Local material failure (even a bar rupture) does not constitute by itself member failure under seismic loading: the member is considered to have failed if it has lost a good part of its force resistance owing to gradual accumulation of local material failures during cyclic loading. Loss of resistance takes place in flexural plastic hinges forming under seismic loading at member ends. Following proposals by Fardis (1998, 2001) and Fardis et al. (2003), compliance of RC members in flexure is checked using the chord-rotation, θ, at the two ends of the member as the relevant deformation measure (or, its plastic part, which is equivalent to the plastic hinge rotation, θ pl). Recall that the chord rotation at a member end is the angle between the normal to the member section there and the chord connecting the two member ends in the deformed configuration; in the elastic regime the chord rotations at member ends A and B, θ A and θ B, determine alone the two bending moments M A and M B through the member stiffness matrix.
For the three Limit States mentioned above, Annex A of Eurocode 8-Part 3 specifies for RC members the performance requirements in Table 7.2.
-
At the “Damage Limitation” (DL) Limit State, ductile mechanisms are required to remain elastic (below yielding).
-
At the other extreme, the “Near Collapse” (NC) Limit State, ductile elements are allowed to reach their ultimate deformation capacity (its expected value for “secondary” elements, mean-minus-standard deviation for “primary” ones).
-
At the “Significant Damage” (SD) Limit State, the deformations (chord rotations at member ends) of “ductile” elements are limited to 75 % of the deformation limit above in the “Near Collapse” (NC) level.
Force demands on “brittle” mechanisms are required to remain below their force resistance at all Limit States. The value of force resistance of “primary” elements used in this verification is computed applying appropriate partial safety factors on the characteristic material strengths; the values of these factors depend also on the level of available knowledge for the existing structure. For “secondary” elements, the force resistance is computed without partial safety factors on the characteristic material strengths.
The ultimate chord rotation, θ u, or plastic hinge rotation, θ pl u, under cyclic loading is conventionally identified with a 20 %-drop in moment resistance; in other words, increasing the imposed deformation beyond θ u or θ pl u cannot increase the moment resistance above 80 % of its maximum ever value.
Annex A to Part 3 of Eurocode 8 (CEN 2005a, 2009) gives expressions and rules for the calculation of the mean value of the chord rotation at yielding, θ y, or at ultimate, θ u,m, highlighted in Sects. 7.4.4.2 and 7.4.5, respectively. The cyclic shear resistance after flexural yielding, V R,EC8, is also given in Annex A to Part 3 of Eurocode 8, to supplement the relevant rules in Eurocode 2 that address only the shear resistance in monotonic loading, V R,EC2, and do not reflect the reduction of shear resistance with increasing cyclic ductility demands. Outside flexural plastic hinges the shear force resistance, V R, is determined per Eurocode 2 (CEN 2004b), as for monotonic loading. The special rules for V R in flexural plastic hinges under cyclic loading are highlighted in Sect. 7.4.6.
Deformation action effects, θ E or θ pl E, are determined via nonlinear analysis for the applicable seismic action combined with the quasi-permanent gravity loads, or – under certain conditions – via linear analysis (see Sect. 7.4.4.4). Shear force action effects, V E, are computed by nonlinear analysis for the combination of the applicable seismic action and the quasi-permanent gravity loads, or, if linear analysis is used, by capacity design calculations (see Sect. 7.4.4.4).
7.4.4 Analysis for the Determination of Seismic Action Effects
7.4.4.1 General Principles
The prime objective of a seismic analysis carried out for the purposes of displacement-based assessment or retrofitting is to estimate the inelastic seismic deformation demands, which are compared to the corresponding deformation capacities. To meet this goal, the structural analysis model should use realistic values of member elastic stiffness. This aspect is more important than the sophistication and refinement of the structural model. If anything, possible miss-estimations of the elastic stiffness should be on the safe-side: it is better from this point of view to underestimate the stiffness than to overestimate it.
Another important point is that, if calculated with member stiffness values representative of elastic response up to yielding, the fundamental period of a concrete structure normally comes out longer than the corner period between the acceleration- and the velocity-controlled ranges of the spectrum, T C. Therefore, the “equal displacement” rule applies well on average, at least to a Single-Degree-of-Freedom (SDoF) approximation of concrete structures: their global inelastic displacement demand may be estimated by linear elastic analysis for 5 % damping.
Any analysis, linear or nonlinear, should be based on mean values of material properties, as inferred from the documentation of the as-built structure, combined with in-situ measurements. For new materials, added for retrofitting, the mean strength is higher than the nominal values: according to Eurocode 2, for concrete f cm exceeds f ck by 8 MPa; concerning steel, f ym is in the order of 1.15f yk.
Sections 7.4.4.2 and 7.4.4.4 elaborate further the points raised in the first two paragraphs, in the context of Part 3 of Eurocode 8.
7.4.4.2 Effective Elastic Stiffness for the Analysis
In force- and strength-based seismic design of new structures according to present day codes, it is safe-sided to overestimate the effective stiffness, as the computed natural periods are reduced and the resulting spectral accelerations and design forces increase. Eurocode 8 recommends in Part 1 (CEN 2004a) to use for RC members 50 % of the uncracked gross section stiffness, (EI)c. On average, this still is about double the experimental secant stiffness at yielding. An overestimated effective stiffness and the ensuing reduction of natural periods underestimate the spectral displacements and seismic deformation demands and is unsafe in the context of displacement-based seismic design or assessment with direct verification of member deformation capacities against deformation demands. So, the model for the analysis should use realistic values of the effective cracked stiffness of concrete members at yielding, accounting for all sources of flexibility:
-
fully cracked sections should be used for members expected to yield at the Limit State considered, without tension stiffening (which is diminished by load cycling), and
-
the fixed-end-rotation of the member’s end section due to slippage of longitudinal bars from their anchorage zone outside the member (in a joint or the foundation) should be taken into account, as per Fig. 7.1 and Eq. (7.2):
where:
-
φ is the curvature at the end section and σ s the stress in the tension bars there,
-
d bL is the tension bars’ mean diameter and τ b the mean bond stress along their straight anchorage length outside the member length.

Fixed-end-rotation due to bar slippage from a joint
At yielding of the end section, φ and σ s may be taken in Eq. (7.2) equal to their yield values, φ y and f y; along ribbed bars τ b (in MPa) may be taken equal to √f c(MPa) (Biskinis and Fardis 2004, 2010a). The value of θ slip at yielding at the end section is denoted by θ slip,y.
For members which yield at the limit state of interest, the analysis should use as effective elastic stiffness, EI eff, the secant stiffness to the yield-point. According to Part 3 of Eurocode 8, in prismatic RC members (including slender walls) which may yield at one or both ends where the member frames into another component or in the foundation, the secant stiffness to yield-point of the full member between its two ends may be estimated as proposed by Fardis (1998, 2001) and Fardis et al. (2003):
where M y is the yield moment from section analysis with linear σ-ε laws until the tension bars yield (over one-third of the tension zone in circular columns), or a certain strain limit is exceeded by concrete (Biskinis and Fardis 2010a, 2013a, b); θ y is the chord rotation at yielding, calculated as highlighted below; L s = M/V is the shear span at the yielding end section under seismic loading. In a beam, L s may be taken as one-half of the clear length between columns; in a column, as one-half the clear height between beams in the plane of bending; the same for a bridge pier column fixed at the top against rotation in the plane of bending. In the strong direction of a building wall, the value of L s in a storey is about one-half the height from the wall base in the storey to the top of the wall. In members cantilevering in the plane of bending, L s is the member clear length. For asymmetric section and/or reinforcement, the mean value of EI eff for positive and negative bending should be used. For walls or cantilevering members, the EI eff-value at the base section should be used; in all other cases the average EI eff-value at the two member ends applies.
According to Biskinis and Fardis (2010a, 2013a), the value of θ y to be used in Eq. (7.2) as well as in the verification of the DL Limit State, is the sum of:
-
1.
a flexural component, equal to φ y(L s + z)/3 if ribbed bars are used and 45°-cracking of the member precedes flexural yielding of its end section (see Fig. 7.2), or to φ y L s/3 otherwise; 45°-cracking near the member end precedes flexural yielding if the shear force at flexural yielding, M y/L s, exceeds the shear resistance without shear reinforcement per Eurocode 2;
Fig. 7.2 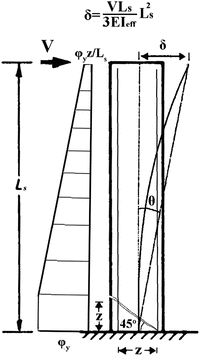
Definition of chord rotation, θ, at the base of a cantilever column; effect of “tension shift” due to diagonal cracking on distribution of flexural deformations along the column
-
2.
a shear deformation, about equal to 0.0014(1 + 1.5 h/L s) in beams or rectangular columns, 0.0027max[0; 1 − L s/(7.5D)] in circular piers or columns, or 0.0013 in rectangular, T-, H- or U-walls and hollow rectangular members – where h or D is the full section depth; and
-
3.
the fixed-end-rotation due to the slippage of longitudinal bars from the anchorage past the member length, obtained as θ slip,y from Eq. (7.1) for φ = φ y, σ s = f y.

The above have been adopted in Part 3 of Eurocode 8 for the calculation of θ y of beams, rectangular columns or walls and non-rectangular walls. Note that, in the light of more recent data, better overall agreement for rectangular or non-rectangular walls and hollow rectangular members is obtained, if the constant term 0.0013 in point 2 is replaced by 0.0007[1 + (4/3)h/L s] (cf. (a) and (b) in Fig. 7.4).
At the end sections of T- or L-beams, slab bars parallel to the beam and within an effective slab width, b eff,, count as longitudinal reinforcement of the beam end section, provided they are well-anchored past it. Part 1 of Eurocode 8 (CEN 2004a) specifies an unrealistically small size of b eff, intended for safe-sided design. A realistic estimate is 25 % of the beam span or the mid-distance to the adjacent parallel beam, whichever is smaller, on each side of the beam web.
Figures 7.3, 7.4 and 7.5 compare the predictions from this Section’s approach to the dataset used for their calibration (Biskinis and Fardis 2010a, 2013a). Their captions give also the Coefficient of Variation (CoV) of the test-to-prediction ratio of EI eff; to be compared in Fig. 7.9 with that for the empirical prediction per Eq. (7.14). Not included in this database, nor in Fig. 7.3, are columns with smooth bars (common in old buildings).


Dataset of 520 rectangular, T-, H- or U-walls or hollow rectangular members: (a), (b) experimental v predicted chord rotation at flexural yielding, θ y; (c), (d) experimental secant stiffness to yield point, EI eff , v result of Eq. (7.2); (a), (c): prediction of θ y per Sect. 7.4.4.2 (Biskinis and Fardis 2010a; CEN 2005a, 2009; fib 2012); (b), (d): prediction of θ y per Sect. 7.4.4.2 with constant term 0.0013 replaced by 0.0007[1 + 4 h/(3L s)]; CoV 43 % in (c), 41 % in (d)

Lap splices at floor levels are common. Tests of 92 such columns with ribbed (deformed) bars and another 36 with smooth bars show certain effects of lap-splicing (Biskinis and Fardis 2010a), taken into account in Eurocode 8, Part 3:
-
(a)
Both bars in a pair of lapped bars in compression count fully in the compression reinforcement ratio. This positive effect refers to M y, φ y, θ y, as well to all properties at ultimate deformation (see Sect. 7.4.5.2);
-
(b)
In the calculation of the properties (M y, φ y, θ y, etc), the yield stress, f y, of lap-spliced ribbed tension bars with mean diameter d bL, is multiplied by l o/l oy,min, where l o is the lapping and l oy,min is given by Eq. (7.3), if l o is less than l oy,min:
$$ {l}_{oy, \min }=\frac{0.3{d}_{bL}{f}_y}{\sqrt{f_c}}\kern0.6em \left({f}_{\mathrm{y}},{f}_{\mathrm{c}}\mathrm{in}\ \mathrm{MPa}\right) $$(7.3) -
(c)
The full yield stress may be used for hooked smooth tension bars lapped over at least 15d bL (there are no data for shorter lapping). If the lapped ends of the bars are straight without hooks, (b) above applies, with 50 % longer l oy,min.
7.4.4.3 Nonlinear Analysis
Nonlinear analysis is the reference analysis method in Part 3 of Eurocode 8, applicable to all cases. Although nonlinear dynamic (response-history) analysis, with solution of the equations of motion in the time-domain, is included, the emphasis is placed on nonlinear static (“pushover”) analysis.
Part 3 of Eurocode 8 requires two lateral load patterns in “pushover analysis”: one produced by uniform lateral accelerations; the other from first-mode ones, which is taken as heightwise linear as in linear static (lateral force) analysis, if such analysis is applicable, or from eigenvalue analysis, if it is not. It adopts the N2 procedure (Fajfar 2000), summarised in an Informative Annex to Part 1 of Eurocode 8 (CEN 2004a). For a fundamental period in the direction of pushover analysis, T 1, longer than the corner period T C (see Sect. 7.5.1), the target displacement is equal to the elastic spectral one for 5 % damping; for shorter periods, the elastic displacement is multiplied by μ = 1 + (q − 1)T C/T 1 (Vidic et al 1994), where the available value of the behaviour factor q may be taken equal to the ratio of the elastic base shear to the one corresponding to a plastic mechanism, i.e., the lateral force resistance of the building. As we will see in Sect. 7.5.3, apart from nonlinear dynamic analysis, this multiplication is the only departure from the “equal displacement rule” in Part 3 of Eurocode 8.
Nonlinear analysis should use the EI eff-value from Eq. (7.2) as member elastic stiffness, except possibly in members confirmed to stay uncracked under the seismic action considered. Viscous damping equal to 5 % of critical is used, to model energy dissipation until member yielding.
Linear models may be used for those structural components expected – and confirmed – to stay in the elastic domain for the seismic action of interest. Nonlinear modeling may then be limited to the rest. Nonlinear models of 1D members (including slender walls) should, as a minimum, employ a nonlinear moment-rotation relation for any flexural plastic hinge that may form at an end where the member frames into another component; if bending is mainly within a single plane, a uniaxial moment-rotation relation in that plane is sufficient.
As a minimum, nonlinear member models should use a bilinear generalised force-deformation (e.g. moment-rotation) law in primary (i.e. monotonic) loading:
-
positive post-yield stiffness (due to strain-hardening) may be neglected; elastic-perfectly plastic behaviour may be assumed instead.
-
significant post-yield softening due to strong strength degradation with cycling should be included via negative post-yield stiffness; however the normal reduction in resistance after ultimate strength may be neglected (after all, at the end of a design or a successful assessment-cum-retrofitting, brittle mechanisms are normally verified to remain elastic and ductile ones to have a margin against ultimate deformation – after which the drop in resistance is significant).
The requirement on hysteresis rules to be used in nonlinear response-history analysis is just to reflect realistically the post-yield energy dissipation in the range of displacement amplitudes expected.
Unlike linear elastic analysis described next, which may be relied upon, under certain conditions, to estimate seismic deformation but not internal force demands, nonlinear analysis may be used to determine all types of seismic action effects.
7.4.4.4 Linear Analysis for the Calculation of Seismic Deformations
Member seismic inelastic deformations may be determined from linear analysis with 5 % damping, provided that they are not concentrated at certain parts (e.g., at one side of the building in plan, in one or few storeys, etc.) but are spread fairly uniformly throughout the structure. This potential of linear analysis under such conditions is supported by several studies (e.g., Panagiotakos and Fardis 1999a, b, Kosmopoulos and Fardis 2007 for concrete buildings; Bardakis and Fardis 2011b, for concrete bridges with monolithic deck-pier connections). The nonlinear moment-deformation relations at member ends may be used then to determine the end moments from the inelastic flexural deformations estimated with linear analysis; shear forces are calculated from these moments by equilibrium.
A convenient way to check whether inelastic deformation demands are indeed uniformly distributed, without carrying out a nonlinear seismic analysis just for that purpose, is by looking at the spatial distribution of the ratio of the moment from linear analysis, M E, at member end sections to the corresponding moment resistance, M R (the M E/M R-ratio is an approximation to the chord-rotation ductility ratio). Part 3 of Eurocode 8 recommends a range of 2.5 between the maximum and the minimum values of M E/M R over all end sections in a building where plastic hinges may form (i.e., those sections where M E > M R and plastic hinging at column or beam ends around a joint is not prevented by their higher aggregate moment resistance, ∑M Rc, ∑M Rb, compared to the beam or column ends, respectively).
If linear seismic analysis is allowed and adopted for the estimation of inelastic deformations, linear response-history analysis with 5 % damping – carried out simultaneously for all seismic action components of interest, or separately for each one and superposition of the results – is an option. However, as only the maximum values of these deformations are of interest, the method of choice is modal response spectrum analysis with the 5 %-damped elastic response spectrum, according to the rules set out in Part 1 of Eurocode 8 (CEN 2004a): total effective modal mass of the included modes at least 90 % of the total mass along any seismic action component considered; combination of peak modal deformations via the Complete-Quadratic-Combination (CQC) rule (Wilson et al 1981); peak values of seismic deformations due to separate application of the concurrent seismic action components combined via the Square Root of Sum of Squares (SRSS) rule, or its linear approximation in proportion 1: 0.3: 0.3 (Smebby and Der Kiureghian 1985). The values and signs of other action effects (e.g. the column deformation in the orthogonal direction), expected to take place concurrently with the peak value of the action effect obtained via the SRSS rule, may be obtained from probability-based models (Gupta and Singh 1977; Fardis 2009).
Under conditions set out in Part 1 of Eurocode 8 (CEN 2004a) and summarised below, modal response spectrum analysis may be simplified into separate linear static analyses under “equivalent” forces in the direction of each relevant seismic action component, with the structure taken as a SDoF having the period of the dominant mode, T 1, in that direction. This simplification may not be made in only one of the two horizontal directions, but may be applied to the vertical alone. For buildings with more than two storeys and period T 1 less than 2T C, the resultant “equivalent” force along the seismic action component of interest may be reduced by 15 % over the product of the elastic response spectral acceleration at T 1 and the total mass, to account for the smaller effective modal mass of the first mode.
“Equivalent static” analysis is allowed under the conditions set out for new buildings in Part 1 of Eurocode 8:
-
(a)
No significant heightwise irregularity in geometry, mass and lateral stiffness or storey strength.
-
(b)
T 1 ≤ 2 sec, T 1 ≤ 4T C.
Linear analysis carried out to estimate the seismic deformation demands overestimates the internal forces. Nonlinear moment-deformation relations may be used in that case to compute the moments at member ends from the linearly estimated chord rotations; the shear forces in a component are computed then from equilibrium with the moments delivered to it at its connections to the rest of the structure. For simplification, these moments may be obtained from the moment capacities of the critical plastic hinges (multiplied by a “confidence factor” greater than 1.0, which depends on the amount and reliability of the information available or collected about the as-built structure), but not to exceed the moments from the linear analysis. Around beam-column joints, the plastic hinges are taken to form at the faces of the joint where the aggregately weaker elements frame (e.g., in the beams of a weak beam/strong column frame); the moments at the face of the non-hinging elements are estimated from moment equilibrium, as in “capacity design” of concrete beams or columns in shear per Part 1 of Eurocode 8 (CEN 2004a).
7.4.5 Cyclic Plastic (Chord) Rotation Capacity for Verification of Flexural Deformations
7.4.5.1 “Physical Model” Using Curvatures and Plastic Hinge Length
Annex A to Part 3 of Eurocode 8 includes a “physical” model for the expected (mean) value of the plastic part of the ultimate chord rotation at a member end, for use in the verification of flexural deformations at the “Significant Damage” and “Near Collapse” Limit States summarised in Table 7.1. It is a classical plastic hinge model, which assumes that, after yielding, the plastic part of the curvature is uniform within a finite “plastic hinge length”, L pl, from the end section:
where L s = M/V is the shear span at the member end and φ u, φ y are the ultimate and the yield curvature, respectively, of the end section, from section analysis, using:
-
for φ y: linear σ-ε laws, until yielding of the tension or the compression chord;
-
for φ u: a bilinear σ-ε diagram for the reinforcement with or without linear strain-hardening; a parabolic-rectangular one for the concrete in compression.
For the ultimate strain of reinforcing steel, ε su, the 10 %-fractile limits in Annex C to Eurocode 2 are accepted in the calculation of φ u: 2.5, 5, 6 % for steel class A, B, C. For the concrete and its confined core after spalling there are two options:
-
1.
the Eurocode 2 model, taken from the CEB/FIP Model Code 90 (CEB 1991);
-
2.
the strength model by Newman and Newman (1971), supplemented with a model for the ultimate strain, ε cu,c, specifically fitted for the purposes of Part 3 of Eurocode 8 to the then available measurements of φ u in cyclic loading (starting from a value of 0.004 for the unconfined concrete cover).
Option 1 underestimates the presently available test results by one-third in the median, whereas option 2 is almost unbiased.
Empirical expressions (different for Options 1 or 2) for the “plastic hinge length”, L pl, were fitted specifically for Part 3 of Eurocode 8 to the cyclic test results available then. They indirectly reflect the additional fixed-end rotation due to slippage of longitudinal bars from their anchorage in the joint or footing, including “yield penetration” in it. However, as shown in Fig. 7.6, they give large scatter (hence the large factors of 1.7 and 2 by which θ u,m = θ y + θ pl u,m is divided, in order to convert it to θ u,m-σ, see footnote (3) in Table 7.2) and marked overestimation of the presently available cyclic test results.

7.4.5.2 Empirical Rotation Capacity: Sections with Rectangular Parts
For well-detailed beams, rectangular columns or walls and members of T-, H-, U- or hollow rectangular section with continuous ribbed bars, (Biskinis and Fardis 2010b) proposed empirical expressions for the expected value of the ultimate chord rotation at a member end under cyclic loading (total θ u,m, or plastic part, θ pl u,m = θ u,m − θ y). This option, Eqs. (7.5), is unbiased and has less scatter ‒ hence model uncertainty ‒ than the approach in Sect. 7.4.5.1.
In Eqs. (7.5):
-
a st, a pl st are coefficients for the type of steel, with values:
-
For ductile steel: a st = 0.0158, a pl st = 0.0143;
-
For brittle steel: a st = 0.0098, a pl st = 0.007.
-
-
a w,r is a zero-one variable for rectangular walls:
-
a w,r = 1 for a rectangular wall,
-
a w,r = 0 otherwise;
-
-
a w,nr is a zero-one variable for non-rectangular sections:
-
a w,nr = 1 for a T-, H-, U- or hollow rectangular section,
-
a w,nr = 0 for a rectangular one;
-
-
ν = N/bhf c, with b the width of the rectangular compression zone and N the axial force (N > 0 for compression);
-
ω 1 = (ρ 1 f y1 + ρ v f yv)/f c is the mechanical ratio of reinforcement in the entire tension zone (with 1 indexing the tension chord and v the web longitudinal bars);
-
ω 2 = ρ 2 f y2/f c is the mechanical reinforcement ratio of the compression zone;
-
L s/h = M/Vh is the shear-span-to-depth ratio at the section of maximum moment;
-
ρ d is the steel ratio of any bars in each diagonal direction of the member;
-
ρ s = A sh/bs h is the ratio of confinement steel in the compression zone parallel to the plane of bending and the shear force;
-
α is the confinement effectiveness factor:
$$ \alpha =\left(1-\frac{s_h}{2{b}_o}\right)\left(1-\frac{s_h}{2{h}_o}\right)\left(1-\frac{{\displaystyle \sum {b_i}^2/6}}{b_o{h}_o}\right) $$(7.6a)with:
-
s h: centreline spacing of stirrups,
-
b o, h o: confined core dimensions to the centreline of the hoop;
-
b i: centreline spacing of longitudinal bars (index: i) engaged by a stirrup corner or cross-tie along the perimeter of the section.
-
Part 3 of Eurocode 8 (CEN 2005a, 2009) has adopted an earlier version of Eqs. (7.5a) and (7.5b), with coefficients a st, a pl st rounded up by about 1.3 % and a common reduction factor a w,r and a w,nr for walls, rectangular or not, equal to 0.375 in Eq. (7.5a) and 0.4 for Eq. (7.5b).
The two versions of Eq. (7.5) are equivalent, as far as bias and scatter are concerned. The comparison of experimental to predicted values in Fig. 7.7a is indicative. A further comparison with Fig. 7.6 shows that they are superior to the more fundamental approach in Sect. 7.4.5.1. They also have a wider scope and are easier to extend, in the ways suggested in (Biskinis and Fardis 2010b) and adopted in Part 3 of Eurocode 8 (CEN 2005a, 2009):

Cyclic ultimate chord rotation of members with rectangular, T-, H-, U- or hollow rectangular section vs. empirical predictions per Sect. 7.4.5.2: (a) 1125 tests of well detailed members with continuous ribbed bars vs. Eq. (7.5b); (b) 48 tests of members with poor detailing and continuous ribbed bars vs. Eq. (7.5a) modified per point 1; (c) 82 tests of members with poor detailing and lap-spliced ribbed bars vs. Eq. (7.5b) modified per point 3 and Eq. (7.7)
-
1.
In members with continuous bars but poor detailing, not conforming to modern seismic design codes (e.g., with sparse, 90°-hooked ties), the confinement effect is neglected (αρ s = 0 in the second term from the end) and θ u,m from Eq. (7.5a), or θ pl u,m from Eq. (7.5b) is divided by 1.2 (see Fig. 7.7b).
-
2.
If the bars are smooth but continuous, rule 1 above is modified to further reduce θ u,m from Eq. (7.5a) by 5 % (multiplication by 0.95/1.2 ~ 0.8) or θ pl u,m from Eq. (7.5b) by 10 % (multiplied by 0.90/1.2 = 0.75). With the increase of the number of tests from 34 ‒ on which the rule was based (Biskinis and Fardis 2010b) ‒ to 46, no further reduction of θ u,m beyond rule 1 above seems necessary, while the reduction of θ pl u,m from Eq. (7.5b) should be limited to 5 % (i.e., it should be multiplied by 0.95/1.2 ~ 0.8).
-
3.
Equation 7.5b can be extended to members with ribbed bars lap-spliced over a length l o in the plastic hinge region (see Fig. 7.7c):
-
by applying rules (a) and (b) of Sect. 7.4.4.2 (at the end) in calculating θ y;
-
by applying the same rule (a) to ω 2 (doubling it, if all compression bars are lapped);
-
by multiplying the outcome of Eq. (7.5b) for θ pl u,m by l o/l ou,min, if l o is less than l ou,min given by:
$$ {l}_{ou, \min }=\frac{d_b{f}_y}{\left(1.05+14.5{a}_{l, s}\frac{\rho_s{f}_{y w}}{f_c}\right)\sqrt{f_c}}\kern0.48em \left({f}_{\mathrm{y}},{f}_{\mathrm{y}\mathrm{w}},{f}_{\mathrm{c}}\kern0.5em \mathrm{in}\ \mathrm{MPa}\right) $$(7.7)where:
-
ρ s is the ratio of the transverse steel parallel to the plane of bending, and
$$ {a}_{\mathrm{l},\mathrm{s}}=\left(1-0.5{s}_{\mathrm{h}}/{b}_{\mathrm{o}}\right)\left(1-0.5{s}_{\mathrm{h}}/{h}_{\mathrm{o}}\right){n}_{\mathrm{restr}}/{n}_{\mathrm{tot}}, $$(7.8)with:
-
s h, b o, h o, as defined for Eq. (7.6a),
-
n tot: total number of lapped bars along perimeter of the section and
-
n restr: number of lapped bars engaged by a stirrup corner or cross-tie.
-
For smooth bars, with hooked ends lap-spliced over a length l o ≥ 15d b, (CEN 2009) reduces θ u,m from rule 2 above by multiplying it with 0.019[10 + min(40; l o/d b)] (which gives the reduction factor of 0.95 for continuous bars), or θ pl u,m from the same rule by multiplying it with 0.019[40; l o/d b)] – giving a reduction factor of 0.76 for continuous bars. The 17 tests now available ‒ v 11 on which that rule was based (Biskinis and Fardis 2010b) ‒ show smaller reduction of θ u,m and θ pl u,m than the modified rule 2 above, namely to multiply them by [60 + min(40; l o/d b)]/100.
Wrapping the plastic hinge region with Fibre Reinforced Polymers (FRP) to improve deformation capacity may be considered by including confinement by the FRP in the exponent of the second term from the end of Eqs. (7.5). If the vertical bars are lap-spliced in that region, Eqs. (7.7) and (7.8) are modified to reflect the beneficial effect of confinement by the FRP. However, in the light of newly available test results, the relevant rules in Part 3 of Eurocode 8 need improvement (see Biskinis and Fardis 2013a, b for proposals).
7.4.6 Cyclic Shear Resistance
7.4.6.1 Diagonal Tension Strength After Flexural Yielding
Shear strength decays faster than flexural strength with load cycling. So, members that first yield in flexure may, under cyclic loading, ultimately fail in shear in the plastic hinge. The shear resistance in static loading per Eurocode 2 does not apply to regions which have already yielded in flexure and have developed a certain amount of inelastic deformation in the tensile chord. After all, if loading is static and proportional, a flexural plastic hinge will not fail in shear, as its internal forces (including the shear force) do not increase much after flexural yielding.
For seismic loading shear failure of flexural plastic hinges is normally described through a shear resistance of the plastic hinge in diagonal tension, V R, which decreases with increasing plastic rotations under cyclic loading. Part 3 of Eurocode 8 has adopted a model in (Biskinis et al 2004) giving V R as the sum of:
-
the transverse component of the diagonal strut transferring the axial load N from the compression zone of the section of maximum moment to the centre of the zero-moment section, i.e., over a distance L s = M/V, as in (CEB 1991);
-
a non-zero concrete contribution term, V c; and
-
the contribution of transverse reinforcement, V w, for a 45°-truss inclination.
V c and V w are taken to decrease with increasing plastic rotation ductility ratio, μ pl θ = θ pl/θ y, where θ pl = θ -θ y is the plastic (chord) rotation demand and θ y is determined according to Sect. 7.4.4.2, points 1 to 3:
with:
-
h: depth of the cross-section (equal to the diameter D for circular sections);
-
x: compression zone depth;
-
N: compressive axial force (positive, taken as zero for tension);
-
L s /h = M/Vh: shear span ratio at the yielding member end;
-
f c: concrete strength (ΜPa);
-
ρ tot: total longitudinal reinforcement ratio;
-
A c: cross-section area, equal to b w d for cross-sections with rectangular web of width b w and effective depth d, or to πD o 2/4 for circular sections (D o: diameter of the concrete core to the centreline of the hoops);
-
V w : contribution of transverse reinforcement to shear resistance:
For cross-sections with rectangular web width b w , having transverse reinforcement with ratio ρ w and yield stress f yw , internal lever arm z equal to 0.8 h in rectangular walls or d-d 1 in columns and hollow, H-, U- or T-sections:
For circular sections with diameter of the concrete core D o, cross-sectional area of circular stirrups A sw and centreline spacing of stirrups s h:
The database of RC tests leading to failure of the type described here has considerably increased since the development of Eq. (7.9) in (Biskinis et al 2004). As depicted in Fig. 7.8a, the broader dataset agrees well with Eq. (7.9).

Cyclic shear resistance v prediction: (a) 334 cyclic tests with diagonal tension failure after flexural yielding vs. Eq. (7.9); (b) 63 cyclic tests of rectangular or non-rectangular walls or hollow rectangular members with 1.0 ≤ L s/h ≤2.5 failing in diagonal compression vs. Eq. (7.11); (c) 48 cyclic tests of columns with L s/h ≤ 2.0 failing in diagonal compression vs. Eq. (7.12).
For assessment, the value of μ pl θ = (θ − θ y)/θ y at which V R(μ pl θ) from Eq. (7.9) becomes equal to the shear at flexural yielding, M y/L s, is translated into a chord rotation θ = (μ pl θ + 1)θ y for which this type of failure is expected to take place; if this value of θ is less than the expected ultimate chord rotation in flexure from Eqs. (7.5), θ um, failure will most likely be in shear at θ = (μ pl θ + 1)θ y, rather than by flexure at θ um.
7.4.6.2 Diagonal Compression Strength of Squat Walls and Columns
Walls with L s/h ≤ 2.5 may fail under cyclic loading by diagonal compression at a shear force less than the predictions of Eq. (7.9) and a chord rotation much less than the value at flexure-controlled failure per Eqs. (7.5). It is now recognised that walls with L s/h ≤ 1.0 follow a different pattern and model (Grammatikou et al. 2014), but, as demonstrated in Fig. 7.8b, those with 1.0 < L s/h ≤2.5 do confirm a model proposed by Biskinis et al. (2004) and adopted in Part 3 of Eurocode 8 for the cyclic resistance of walls with L s/h ≤ 2.5 against web crushing:
where all symbols have been defined above for Eq. (7.9). If μ pl θ = 0 Eq. (7.11) gives the cyclic resistance in diagonal compression before flexural yielding.
Columns with L s/h ≤ 2.0 under cyclic loading often fail in compression along the diagonal in elevation after flexural yielding. Part 3 of Eurocode 8 adopted for them the empirical model by Biskinis et al. (2004):
where:
-
δ: angle of the column diagonal in elevation to the column axis: tanδ = h/2L s ;
-
all other parameters have been defined above for Eq. (7.9).
Figure 7.8c shows that the current dataset, broader than the one to which Eq. (7.12) was fitted in (Biskinis et al. 2004), still confirms this model.
The procedure in the last paragraph of Sect. 7.4.6.1 can be applied to Eq. (7.11) for walls with 1.0 < L s/h ≤ 2.0, or to Eq. (7.12) for columns with L s/h ≤ 2.0, to identify the failure mode most likely to occur among those in Sects. 7.4.5.2, 7.4.6.1, and 7.4.6.2.
7.5 Performance- and Displacement-Based Seismic Design of New Concrete Structures in the 2010 Model Code of fib
7.5.1 Introduction
Seismic design of new structures according to present day codes, including Eurocode 8 (CEN 2004a, 2005b), is force-based; members are dimensioned at the ULS against internal forces computed via elastic analysis for external (“seismic”) forces derived from a “design” response spectrum, which results from dividing the ordinates of the 5 %-damped elastic response spectrum by an empirical behaviour (or force reduction) factor. Prescriptive, opaque and, by and large, arbitrary detailing rules for members are presumed to provide ductility commensurate with the behaviour factor employed in the analysis. A single level of seismic action is normally considered (the “design seismic action”, chosen in general to have a 10 % probability of being exceeded in 50 years). The damage induced to non-structural elements (e.g., partitions) by a frequent (“serviceability”) seismic action is sometimes checked (CEN 2004a), but this is a non-structural verification, independent of the structural material. This design approach is opaque concerning the achieved seismic performance and overall sub-optimal.
The Model Code 2010 of fib (2012) – in short MC2010 – is meant to serve as a guidance document to future codes for design of concrete structures (Walraven 2013). Its predecessors (CEB 1978; CEB 1991) were the basis of the European design standard for concrete structures, as pre-Norm (CEN 1991) or Norm (CEN 2004b), respectively. Those CEB Model Codes did not cover seismic design. However (CEB 1978) was supplemented by the CEB seismic Model Code (CEB 1985) for (mainly) concrete buildings, which served as the basis for the pre-Norm version (CEN 1994b, c, d) of the European seismic design standard, especially for its parts on concrete buildings. As the 1990 Model Code (CEB 1991) did not have a seismic part or follow-up, the first European standards for earthquake resistant structures (CEN 2004a, 2005a, b) developed independently.
MC2010 includes full-fledged performance-based seismic design and assessment, targeting specific and measurable performance under several levels of seismic action (Fardis 2013). Moreover, it uses deformations as the basis for verifications, and not internal forces. In these two fundamental features, as well as in many details, it follows Part 3 of Eurocode 8 (CEN 2005a). Note that this European standard concerns existing buildings, while MC2010 covers seamlessly assessment of seismic performance of existing, as well as design of new buildings and other structures (notably bridges). The introduction of performance- and displacement-based seismic design of new structures in the footsteps of a standard for seismic assessment of existing ones is a reversal of the past tradition, where procedures and codification for existing structures followed and emulated those for new.
The rest of Sect. 7.5 has the same structure as Sect. 7.4, but only points out the differences of MC2010 from Part 3 of Eurocode 8. Wherever no difference is mentioned, whatever has been said in Sect. 7.4 applies to MC2010 too.
7.5.2 Performance Objectives
MC2010 identifies four “performance levels”, termed Limit States. They are listed in Table 7.1 alongside the corresponding structural condition and functionality of the facility, the compliance criteria and the appropriate “seismic hazard level” for ordinary facilities. The first two are Serviceability Limit States (SLS), the last two are Ultimate Limit States (ULS). According to MC2010, the “Performance Objective” should at least include one SLS and one ULS; the owner or competent authorities are meant to choose which ones and the level of the corresponding seismic action, depending on the use and importance of the facility.
As emphasised in Sects. 7.4.4.1 and 7.4.4.2, even though the seismic response may go well into the inelastic range, seismic deformation demands are about proportional to the intensity of the ground motion. So, the deformation limits in the second to last column of Table 7.1 show that normally just one of the two SLSs and one of the two ULSs control the design or assessment and need to be explicitly verified. For example, in a certain project the IU SLS will most likely control the design instead of the OP, if its seismic action exceeds that of the OP by more than a factor of 2.0; the NC ULS may govern over the LS one, if its seismic action exceeds that of the latter by more than a factor of 1.5.
7.5.3 Compliance Criteria
The compliance criteria in MC2010 do not distinguish “primary” from “secondary” members. The distinction between “ductile” mechanisms, checked in terms of deformations, and “brittle” ones, checked in terms of forces, is retained.
As shown in the second to last column in Table 7.1, at the two SLSs deformations are verified by comparing the chord rotation demand at each member end, θ Ed, to:
-
1.
the chord rotation at yielding of that end, θ y, at the OP SLS; or
-
2.
twice that value, 2θ y, if the IU SLS is being verified.
So, the verification and the compliance criteria at the OP SLS are the same as for DL in Part 3 of Eurocode 8 (cf. Table 7.2)
At each ULS, deformations are checked by comparing the plastic part of chord rotation demand at a member end (equivalently the plastic hinge rotation) θ pl E,d, to:
-
3.
the lower 5 %-fractile of the ultimate plastic hinge rotation (or, equivalently, of the plastic part of ultimate chord rotation), θ pl u,k, divided by a global safety factor γ* R = 1.35, if the Life Safety (LS) ULS is being checked; or
-
4.
just θ pl u,k, if Near-Collapse (NC) is being verified.
The lower 5 %-fractile of θ pl u is obtained from its mean value, θ pl u,m, as:
where γ Rd is a model uncertainty factor, depending on the model used to determine θ pl u,m. Sect. 7.5.5 gives its values for the models described there for θ pl u,m.
Note that the ratio of the deformation limits against which the plastic rotation demands are checked in the NC and LS Limit States, i.e., γ* R = 1.35, is essentially the same as the one specified in Annex A to Part 3 of Eurocode 8 between the chord rotation demands (the ratio of the values at the intersection of the fourth and third column and the first and second row of Table 7.2 is 1/0.75 = 1.33).
7.5.4 Analysis for the Determination of Seismic Action Effects
7.5.4.1 Effective Elastic Stiffness for the Analysis
In order to apply Eq. (7.2), the longitudinal reinforcement at member ends should be known. In new structures, it may be pre-dimensioned for the non-seismic actions and the corresponding minimum reinforcement and other detailing rules. It may be increased afterwards, if it is considered likely that it will later be necessary, in order to meet the seismic design checks. However, as EI eff depends weakly on the amount of longitudinal reinforcement, MC2010 allows the use of empirical expressions, which give the ratio of EI eff to the uncracked gross section stiffness, (EI)c, depending on the type of member, the shear span ratio, L s/h, the mean axial stress, N/A c, the ratio of longitudinal bar diameter to depth, d bL/h, etc. Such an expression has been fitted to experimental values of EI eff in (Biskinis and Fardis 2010a, 2013a) and is presented as Eq. (7.14), with the value of a modified for walls and hollow rectangular piers in the light of more recent data:
where N/A c is in MPa, and
-
a = 0.10 for beams;
-
a = 0.081 for rectangular columns;
-
a = 0.12 for circular columns and rectangular walls;
-
a = 0.092 for walls with T-, U-, H-section or hollow rectangular piers.
Figure 7.9 compares the predictions of Eq. (7.14) to the test results used in its fitting. The Coefficient of Variation (CoV) value of the test-to-prediction ratio of EI eff given in the caption is not much larger than in Figs. 7.3, 7.4 and 7.5; this small difference conceals the lack of fit with respect to the steel ratio.

Experimental secant stiffness to yield point, EI eff , vs. empirical prediction from Eq. (7.14): (a) 1637 beams and rectangular columns – CoV: 36 %; (b) 517 walls or hollow rectangular piers – CoV 45 %; (c) 273 circular columns – CoV: 31 %; (d) detail of (c)
7.5.4.2 Nonlinear Analysis
The reference method in Part 3 of Eurocode 8, namely nonlinear static (“pushover”) analysis, is not mentioned in MC2010. Reflecting the current design practice of tall buildings and long bridges in seismic regions worldwide, the reference method is nonlinear response-history analysis. The seismic action is specified as a suite of independent seismic events in terms of acceleration time-histories of the three translational ground motion components, all three applied simultaneously and together with the quasi-permanent gravity loads. The number of seismic events should be sufficient to derive robust statistics of action effects. To estimate peak response quantities, the minimum numbers are those specified in Part 1 of Eurocode: at least seven, if their results are averaged; at least three, if the most adverse peak response from the analyses is used. It is pointed out in MC2010 that more than these minimum numbers are necessary to estimate residual deformations or displacements.
The impact of significant variations in the axial force during the response (as, e.g., in exterior columns of tall frames, in the individual piers of coupled walls, or in tall bridge piers with two columns in the vertical plane of bending) on the moment-rotation behaviour should be taken into account. However, coupling between the two directions of bending of vertical elements in 3-D models may be treated in a simplified way.
The unloading-reloading (“hysteresis”) rules supplementing the force-deformation law in primary loading should realistically reflect the post-yield hysteretic energy dissipation and the reduction of unloading and reloading stiffness with increasing peak deformation of a cycle (“stiffness degradation”), a characteristic of concrete components. Ιf significant, the degradation of resistance with load cycling should be included (notably in brittle or poorly detailed components). If a significant part of the deformation is due to bond-slip (e.g., from a joint) or shear (e.g., in members with low shear-span-to-depth ratio), the hysteresis loops should be “pinched” (as an inverted-S) and the hysteretic energy dissipation reduced. The hysteresis rules are important, if we want to estimate residual deformations of members (for local damage), or of the structure as a whole (permanent tilt) after the earthquake; they affect much less the prediction of peak deformation demands during the response.
7.5.4.3 Linear Analysis for the Calculation of Seismic Deformations
MC2010 retains the relatively uniform distribution of inelastic deformations in the plastic hinges as the condition for using 5 %-damped linear analysis to estimate inelastic seismic deformations. It also keeps the ratio of the moment from linear analysis, M E, at member end sections to the corresponding moment resistance, M R, as the means through which this condition is checked. However, unlike Part 3 of Eurocode 8, it does not give quantitative limits for the M E/M R-ratio.
MC2010 promotes the application in new buildings of “capacity design” of columns, so as to be stronger in flexure than the beams and therefore to serve as a strong and stiff spine, spreading the seismic deformation demands throughout the building and preventing concentration in a (soft) storey. Application of this rule produces favourable conditions for the applicability of linear analysis to estimate inelastic seismic deformations.
The peak values of seismic deformations due to separate linear analyses for the seismic action components in X, Y, Z are always combined via the SRSS rule; the linear approximation in a 1:0.3:0.3 proportion is not mentioned. Note that the combination of modal contributions through the CQC rule and of the peak effects of the seismic action components via SRSS can be done in a single modal response spectrum analysis covering all relevant seismic action components. This renders the resulting expected value of peak seismic action effects under concurrent seismic action components along X, Y (and Z) independent of the choice of horizontal directions X and Y.
The SRSS rule is also applied to combine the peak action effects of the vertical component, Z, from “equivalent static” analysis along Z alone with the outcome of the combination of the peak action effects of horizontal components, X and Y, in a single modal response spectrum analysis for these two components.
The applicability conditions of “equivalent static” linear analysis are more general than in Eurocode 8, Parts 1 and 3, covering non-building structures too:
-
The dominant normal mode along the seismic action component in question should account for at least 75 % of the total mass, and
-
the response spectral displacements for this mode are much larger than those of any other mode with significant effective modal mass in the same direction.
MC2010 specifies a wider portfolio of rules than Eurocode 8 for the calculation of shears or other internal forces, when linear analysis is used to estimate the seismic deformations. The scope covers the cases when equilibrium does not suffice to determine the shears or other internal forces solely from the moment capacities at plastic hinges. In such cases MC2010 estimates these forces assuming that the seismic action effects at the instant the moment capacities at plastic hinges are reached are proportional to the corresponding outcomes of linear seismic analysis. This is the approach in Parts 1 and 2 of Eurocode 8 for:
-
1.
The independent foundation of a single vertical element, where the seismic action effects in the foundation element and the ground from linear analysis are multiplied by the minimum ratio between the two orthogonal transverse directions at the base of the vertical element of (a) the uniaxial moment resistance under the axial load due to gravity loads, to (b) the moment from linear analysis for the seismic action (with this ratio not taken greater than 1.0).
-
2.
Multistorey walls, including the amplification of shears in slender walls (those taller than twice their horizontal length), presuming that higher modes (i.e. with a collective participating mass of about 30 % of that of the fundamental mode and with periods in the constant-spectral-acceleration range) remain elastic and increase the wall shears after yielding at the base.
-
3.
Brittle or sensitive components of bridges forming plastic hinges in the piers, which should remain elastic after such plastic hinging (the deck, fixed bearings, abutments flexibly connected to the deck, seismic links consisting of shear keys, buffers and/or linkage bolts, etc.). The action effects from linear analysis for the seismic action component of interest are multiplied by the ratio of (a) the sum of capacity-design shears along the seismic action component to (b) the sum of seismic shear forces from linear analysis, with both sums extending over all vertical supports where plastic hinges form.
The most important extension of the approach above is to the common foundation of many vertical elements: the seismic action effects from linear analysis are multiplied by the weighted-average of the factors computed per 1 above at the base of each individual vertical element. As weight is used the moment component from linear analysis that gives the minimum ratio per 1 above between the two directions of its base section and governs plastic hinging.
7.5.5 Cyclic Plastic (Chord) Rotation Capacity
7.5.5.1 “Physical Model” Using Curvatures and Plastic Hinge Length
Equation (7.4) is modified as follows:
to explicitly include the post-yield fixed-end-rotation due to slippage of the tension bars (with mean diameter d bL) from their anchorage outside the member length, associated with penetration of yielding into the anchorage zone; until attainment of the ultimate curvature at the end section under cyclic loading, the fixed-end-rotation increases, per (Biskinis and Fardis 2010b), by:
Moreover, MC2010 states that the calculation of φ u should account for all possible failure modes:
-
(a)
rupture of tension bars in the full, unspalled section;
-
(b)
exceedance of the concrete ultimate strain ε cu2 at the extreme compression fibres of the unspalled section;
-
(c)
rupture of tension bars in the confined core after spalling of the cover;
-
(d)
exceedance of the ultimate strain ε cu2,c of the confined core after spalling.
Failure modes (c) or (d) govern over (b), if the moment resistance of the confined core exceeds 80 % of that of the full, unspalled, unconfined section; this percentage is associated with the conventional definition of ultimate deformation.
The calculation of φ u under cyclic loading uses the following σ-ε parameters:
-
The rupture strain of ribbed tension bars under cyclic loading taken per (Biskinis and Fardis 2010b):
$$ {\varepsilon}_{\mathrm{su},\mathrm{cyc}}=\left(3/8\right){\varepsilon}_{\mathrm{u},\mathrm{k}} $$(7.16) -
A new expression for the ultimate strength of confined concrete:
$$ {f}_{c c}=\left[1+3.5{\left(\frac{\alpha {\rho}_s{f}_{yw}}{f_c}\right)}^{\frac{3}{4}}\right]{f}_c $$(7.17)where:
-
ρ s is the ratio of transverse reinforcement in the direction of bending (or the minimum in the two transverse directions for biaxial bending) and f yw its yield stress;
-
α is the confinement effectiveness factor:
-
in rectangular sections, according to Eq. (7.6a):
-
in circular sections with circular hoops:
-
$$ \alpha ={\left(1-\frac{s_h}{2{D}_o}\right)}^2 $$(7.18)(without the exponent 2 in circular sections with spiral reinforcement).
-
-
The increased strain of confined concrete at ultimate strength over that of unconfined, ε c2, per (Richart et al 1928), adopted in (CEN 2005a):
$$ {\varepsilon}_{c2, c}={\varepsilon}_{c2}\left[1+5\left(\frac{f_{c c}}{f_c}-1\right)\right] $$(7.19) -
Τhe ultimate strain of the extreme compression fibres in a concrete core confined by closed ties, according to (Biskinis and Fardis 2010b):
$$ {\varepsilon}_{cu2, c}=0.0035+0.4\frac{\alpha {\rho}_s{f}_{yw}}{f_{cc}} $$(7.20)MC2010 notes that a term may be added to Eq. (7.20) to express a size-effect on the plastic rotation capacity clearly found in experiments; it is equal to (10/h)2 – with h (in mm) denoting the depth/diameter of the full section or of the confined core, wherever Eq. (7.20) is applied (Biskinis and Fardis 2010b); its effect is minor in real-size members.
Figure 7.10 compares the predictions of the procedure above to the curvature associated with a 20 % drop in the moment resistance after its peak (conventional “ultimate” curvature) in a dataset of 205 cyclic and 269 monotonic tests of rectangular members. For monotonic loading, term 3/8 in Eq. (7.16) is replaced by 1-(√lnN b,tension)/3, where N b,tension is the number of bars in the tension zone (Biskinis and Fardis 2010b); besides, factor 0.4 in the last term of Eq. (7.20) is replaced by 0.57 and the yield penetration length at ultimate curvature in Eq. (7.15) increases to 9.5d bL. Points denoted in Fig. 7.10 as “slip” are data where the fixed-end-rotation due to slippage of tension bars from their anchorage had to be subtracted from the rotation measurements.

If φ u and Δθ slip,u-y are determined as above, the plastic hinge length, L pl, under cyclic loading should be taken as follows:
-
in beams, rectangular columns or walls and members of T-, H-, U- or hollow rectangular section (Biskinis and Fardis 2010b):
$$ {L}_{pl}=0.2 h\left[1+\frac{1}{3} \min \left(9;\frac{L_s}{h}\right)\right] $$(7.21a) -
in circular columns with diameter D (Biskinis and Fardis 2013a):
$$ {L}_{pl}=0.6 D\left[1+\frac{1}{6} \min \left(9;\frac{L_s}{D}\right)\right] $$(7.21b)Predictions from the above procedure are compared in Fig. 7.11 to the ultimate chord rotation in the cyclic tests to which Eqs. (7.21) were fitted.
Fig. 7.11 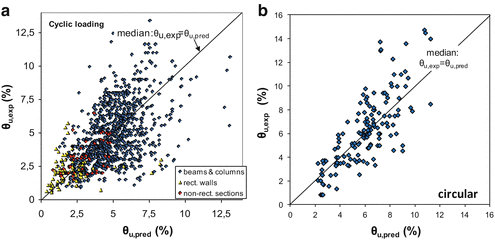
Ultimate chord rotation per Sect. 7.5.5.1 compared to the experimental in: (a) 1,125 cyclic tests on members with rectangular, T-, H-, U- or hollow rectangular section; (b) 143 cyclic tests of circular columns

For a so-computed value of θ pl u,m, the safety factor for its conversion to a lower-5 %-fractile via Eq. (7.13) is γ Rd = 2.0.
7.5.5.2 Empirical Rotation Capacity for Sections of Rectangular Parts
MC2010 adopted Eq. (7.5b) and the following from (Biskinis and Fardis 2010b):
In Eq. (7.5c):
-
b w is the minimum single width among all the webs which are parallel to the shear force (not the total width).
-
a hbw st a coefficient for the type of steel with value:
-
For ductile steel: a hbw st = 0.017;
-
For brittle steel: a hbw st = 0.0073.
-
Equation (7.5c) suggests that the systematically lower plastic rotation capacity of walls with rectangular, T-, H- or U- section and of hollow rectangular piers is due to the large slenderness, h/b w, of their webs, which makes them susceptible to lateral instability under cyclic loading. Even in columns with h/b w > 1.5, the strong direction is at a disadvantage in this respect compared to the weak one.
Equation (7.5c) and (7.5b) are equivalent in lack of bias, scatter and the role they have in all modifications in Sect. 7.4.5.2 for lap-splicing, poor details and/or smooth bars; so, they may be used interchangeably for the latter purposes. They also have much less prediction uncertainty than the Sect. 7.5.5.1 procedure. Accordingly, they can be used in Eq. (7.13) with a smaller model uncertainty factor, γ Rd = 1.75. The same factor applies if Eq. (7.5a) is used instead.
7.5.5.3 Comparison with the Deformation Limits in Part 3 of Eurocode 8
The only expression for θ pl u,m which MC2010 and Part 3 of Eurocode 8 have in common is Eq. (7.5b). The intention of Part 3 of Eurocode 8 is to base the verification of “primary” members on θ u,m-σ (see Table 7.2), while MC2010 uses the lower 5 %-fractile, θ pl u,k, without distinguishing between “primary” and “secondary” members (see Sect. 7.5.3). Eurocode 8 divides θ u,m from Eq. (7.5b) by 1.8 to convert it to θ u,m-σ (see second bullet point in footnote (3) of Table 7.2), whereas MC2010 divides it by γ Rd = 1.75 to convert it to θ pl u,k. The similarity of these factors, despite the different probabilities associated with m-σ values and 5 %-fractiles, is due to the reduction in scatter and model uncertainty of Eq. (7.5b) thanks to the increase in the experimental database in the meantime. So, given the similar margins between the NC and LS ULS of MC2010 on one hand and between the SD and NC ones in Part 3 of Eurocode 8 on the other, the two codes appear to be practically equivalent in this respect. However, the safety margin provided by Part 3 of Eurocode 8 for all members designated as “secondary” is reduced by 1.8.
The above conclusion also holds, if Eq. (7.5a) is used in Part 3 of Eurocode 8 or Eq. (7.5b) in MC2010. The safety margins offered by the application of factors 1.7 or 2 on θ u,m from Sect. 7.4.5.1 (cf. first bullet point in footnote (3) of Table 7.2) appear to be smaller than those provided by applying γ Rd = 2.0 on the outcome of Sect. 7.5.5.1 for θ pl u,m in Eq. (7.14). However, because the approach in Sect. 7.4.5.1 underestimates θ pl u,m by about 10 % (cf. Fig. 7.6), the overall margin is not so different.
7.5.6 Cyclic Shear Resistance
Under seismic loading, the problem of shear is most acute in vertical elements; so ULS design for shear under seismic actions focuses more on columns and walls than on beams. However, the shear provisions in MC2010 refer almost exclusively to elements under high shear due to gravity loads (beams or slabs), which normally have zero axial force. The axial compression, N, of a vertical element contributes to its shear resistance the transverse component of the diagonal strut transferring N from one end section to the other (cf. first term in Eq. (7.9)), as clearly acknowledged in the CEB Model Code 1990 and in Part 3 of Eurocode 8, but only indirectly in MC2010 or EN-Eurocode 2 (through the favourable effect of any inclined compression chords or prestressing tendons). At any rate, this contribution of N to shear resistance in diagonal tension should be explicitly added to the contributions of concrete, V R,c, and of shear reinforcement, V R,s, as in Eq. (7.9). Indeed, the monotonic shear resistance models in MC2010 at Level of Approximation I, II and III seriously underestimate the experimental resistance in the database of cyclic tests leading to diagonal tension failure, which was used to develop Eq. (7.9) and appears in Fig. 7.9. The underestimation and the scatter are materially reduced if the first term of Eq. (7.9) is added to the value of V R per MC2010 for diagonal tension. By contrast, the value of V R,max for static loading in MC2010 materially overestimates the experimental resistance of the wall- or hollow-rectangular-specimens in the database which fail by cyclic diagonal compression.
To alleviate the shortcomings of its shear provisions for static loading, MC2010 specifies for seismic loading a strut inclination of 45° if θ pl > 2θ y, or of arccot(2.5) = 21.8° if θ pl = 0 (i.e., for elastic response), with interpolation for 2θ y > θ pl > 0. Besides, for walls V R,max is reduced to 45 % of the value applying per MC2010 for static loading. Although not specifically stated in MC2010, this reduction should apply also to squat hollow rectangular piers (with L s/h < 2.5) and squat columns (with L s/h <2). With these modifications, the cyclic shear resistance per MC2010 does not overestimate the experimental one, but in most cases underestimates it. It is necessary, in this respect, to improve the MC2010 approach to cyclic shear resistance, in order to achieve the level of agreement with tests that the models by (Biskinis et al. 2004), adopted in Part 3 of Eurocode 8, show in Fig. 7.8. Hopefully, the upcoming revision of Eurocodes 2 and 8 will make this possible.
7.6 Concluding Remarks
The seismic design part of MC2010 follows the footsteps of Part 3 of Eurocode 8, applicable only to existing buildings. MC2010 has evolved from Part 3 of Eurocode 8 to: (a) include recent developments in the State-of-the-Art, (b) face the greater challenges in the design of new structures compared to the assessment of existing ones (including the need to estimate the secant-to-yield-point stiffness without knowing the reinforcement), and (c) to include in its scope bridges and other non-building structures.
The same concept and the same or very similar rules as in MC2010 have been applied to design new concrete buildings in (Panagiotakos and Fardis 1998, 1999b, 2001), or bridges in (Bardakis and Fardis 2011a), with linear analysis for the inelastic deformation demands and Capacity Design for the shears per Sect. 7.4.4.4. This demonstrated the feasibility and cost-effectiveness of the MC2010 approach for new construction. In such cases nonlinear dynamic analysis per Sect. 7.5.4.3 may take place in the end for evaluation and possible revision of the design. As emphasised by (Fardis 2009) and (Bardakis and Fardis 2011a), this design procedure for new structures will be most fruitful and efficient if, as a first step, it aims at uniform chord-rotation ductility ratios at the IU SLS (about 2) or at the OP SLS (about 1) at all sections where plastic hinges will form at the LS or NC ULS. If this goal is attained, inelastic deformations will be fairly uniform throughout the structure and linear seismic analysis will be acceptable across the board, thus avoiding evaluation of the design via nonlinear dynamic analysis.
References
ASCE (2007) Seismic rehabilitation of existing buildings. ASCE/SEI Standard no. 41-06. American Society of Civil Engineers, Reston
ATC (1997) NEHRP guidelines for the seismic rehabilitation of buildings. Applied Technology Council for the Building Seismic Safety Council and the Federal Emergency Management Agency, FEMA reports 273, 274, Washington DC
Bardakis VG, Fardis MN (2011a) A displacement-based seismic design procedure for concrete bridges having deck integral with the piers. Bull Earthq Eng 9(2):537–560
Bardakis VG, Fardis MN (2011b) Nonlinear dynamic v elastic analysis for seismic deformation demands in concrete bridges having deck integral with the piers. Bull Earthq Eng 9(2):519–536
Biskinis DE, Fardis MN (2004) Cyclic strength and deformation capacity of RC members, including members retrofitted for earthquake resistance. In: Proceedings of 5th international fib PhD symposium in civil engineering. Balkema, Delft, pp 1125–1133
Biskinis DE, Fardis MN (2010a) Deformations at flexural yielding of members with continuous or lap-spliced bars. Struct Concr 11(3):127–138
Biskinis DE, Fardis MN (2010b) Flexure-controlled ultimate deformations of members with continuous or lap-spliced bars. Struct Concr 11(2):93–108
Biskinis DE, Fardis MN (2013a) Stiffness and cyclic deformation capacity of circular RC columns with or without lap-splices and FRP-wrapping. Bull Earthq Eng 11:1447–1466
Biskinis DE, Fardis MN (2013b) Models for FRP-wrapped rectangular RC columns with continuous or lap-spliced bars under cyclic lateral loading. Eng Struct 57:199–212
Biskinis DE, Roupakias G, Fardis MN (2004) Degradation of shear strength of RC members with inelastic cyclic displacements. ACI Struct J 101(6):773–783
CEB (1970) CEB-FIP international recommendations for the design and construction of concrete structures: 1 principles and recommendations. Bulletin no. 72. Comite Euro-international du Beton, Lausanne
CEB (1978) International system for unified standard codes of practice for structures, vol I: common unified rules for different types of construction and material; II: CEB-FIP model code for concrete structures. Bulletins no. 124/125. Comite Euro-international du Beton, Paris
CEB (1985) CEB model code for seismic design of concrete structures. Bulletin no. 165. Comite Euro-international du Beton, Lausanne
CEB (1991) CEB-FIP model Code 1990 – Final draft. Bulletins no. 203/204/205. Comite Euro-international du Beton, Lausanne
CEN (1991) European prestandard ENV 1992-1: Eurocode 2: design of concrete structures – part 1: general rules and rules for buildings. Comite Europeen de Normalisation, Brussels
CEN (1994a) European prestandard ENV 1991-1:1994: Eurocode 1: basis of design and actions on structures – basis of design. Comite Europeen de Normalisation, Brussels
CEN (1994b) European prestandard ENV 1998-1-1:1994: Eurocode 8: design provisions for earthquake resistance of structures. Part 1-1: general rules – seismic actions and general requirements for structures. Comite Europeen de Normalisation, Brussels
CEN (1994c) European prestandard ENV 1998-1-2:1994: Eurocode 8: design provisions for earthquake resistance of structures. Part 1-2: general rules – general rules for buildings. Comite Europeen de Normalisation, Brussels
CEN (1994d) European prestandard ENV 1998-1-3:1994: Eurocode 8: design provisions for earthquake resistance of structures. Part 1-3: general rules – specific rules for various materials and elements. Comite Europeen de Normalisation, Brussels
CEN (1996) European prestandard ENV 1998-1-4: 1996: Eurocode 8: design provisions for earthquake resistance of structures. Part 1-4: strengthening and repair of buildings. Comite Europeen de Normalisation, Brussels
CEN (2002) European standard EN 1990: Eurocode: basis of structural design. Comite Europeen de Normalisation, Brussels
CEN (2004a) European standard EN 1998-1:2004: Eurocode 8: design of structures for earthquake resistance. Part 1: general rules, seismic actions and rules for buildings. Comite Europeen de Normalisation, Brussels
CEN (2004b) European standard EN 1992-1-1:2004: Eurocode 2: design of concrete structures – part 1: general rules and rules for buildings. Comite Europeen de Normalisation, Brussels
CEN (2005a) European standard EN 1998-3:2005: Eurocode 8 – design of structures for earthquake resistance – part 3: assessment and retrofitting of buildings. Comite Europeen de Normalisation, Brussels
CEN (2005b) European standard EN 1998-2:2005: Eurocode 8 – design of structures for earthquake resistance – part 2: bridges. Comite Europeen de Normalisation, Brussels
CEN (2009) European standard EN 1998-3:2005: Eurocode 8 – design of structures for earthquake resistance – part 3: assessment and retrofitting of buildings. . Comite Europeen de Normalisation, Brussels
Fajfar P (2000) A nonlinear analysis method for performance-based seismic design. Earthq Spectra 16(3):573–593
Fardis MN (1998) Seismic assessment and retrofit of RC structures. Invited state-of-the-art lecture. In: Proceedings 11th European conference on earthquake engineering, Paris
Fardis MN (2001) Displacement-based seismic assessment and retrofit of reinforced concrete buildings. In: Proceedings of 20th European regional earthquake engineering seminar, European Association of Earthquake Engineering, Sion
Fardis MN (2009) Seismic design, assessment and retrofitting of concrete buildings: based on EN-Eurocode 8. Springer, Dordrecht
Fardis MN (2013) Performance- and displacement-based seismic design and assessment of concrete structures in the model code 2010. Struct Concr 14(3):215–229
Fardis MN, Panagiotakos TB, Biskinis DE, Kosmopoulos A (2003) Seismic assessment of existing RC buildings. In: Wasti ST, Ozcebe G (eds) Seismic assessment and rehabilitation of existing buildings, vol 29, NATO science series, IV. Earth and environmental sciences. Kluwer Academic, Dordrecht
fib (2012) Model code 2010 – final draft. Bulletins 65/66, Federation Internationale du Beton, Lausanne
Grammatikou S, Biskinis DE, Fardis MN (2014) Strength, deformation capacity and failure mode of RC walls in cyclic loading. 4th fib Congress, Mumbai, paper no 408
Gupta AK, Singh MP (1977) Design of column sections subjected to three components of earthquake. Nucl Eng Des 41:129–133
Kosmopoulos A, Fardis MN (2007) Estimation of inelastic seismic deformations in asymmetric multistory RC buildings. Earthq Eng Struct Dyn 36(9):1209–1234
Moehle JP (1992) Displacement-based design of RC structures subjected to earthquakes. Earthq Spectra 8(3):403–428
Newman K, Newman JB (1971) Failure theories and design criteria for plain concrete. In: Te’eni (ed) Structure, solid mechanics and engineering design. J Wiley-Interscience, New York
Panagiotakos TB, Fardis MN (1998) Deformation-controlled seismic design of RC structures. In: Proceedings 11th European conference on earthquake engineering, Paris
Panagiotakos TB, Fardis MN (1999a) Estimation of inelastic deformation demands in multistory RC buildings. Earthq Eng Struct Dyn 28:501–528
Panagiotakos TB, Fardis MN (1999b) Deformation-controlled earthquake resistant design of RC buildings. J Earthq Eng 3(4):495–518
Panagiotakos TB, Fardis MN (2001) A displacement-based seismic design procedure of RC buildings and comparison with EC8. Earthq Eng Struct Dyn 30:1439–1462
Priestley MJN (1993) Myths and fallacies in earthquake engineering – conflicts between design and reality. In: Proceedings of T. Paulay symposium recent developments in lateral force transfer in buildings, La Jolla
Priestley MJN, Calvi GM, Kowalsky MJ (2007) Displacement-based seismic design of structures. IUSS Press, Pavia
Richart FE, Brandtzaeg A and Brown RL (1928) A study of the failure of concrete under combined compressive stresses. Bulletin 185, Univ. of Illinois Engineering Experimental Station, Champaign
Rowe RE (1970) Current European views on structural safety. ASCE J Struct Div 96(ST3):461–467
SEAOC (1995) Performance based seismic engineering of buildings: vision 2000. Structural Engineers Association of California, Sacramento
Smebby W, Der Kiureghian A (1985) Modal combination rules for multicomponent earthquake excitation. Earthq Eng Struct Dyn 13(1):1–12
Vidic T, Fajfar P, Fischinger M (1994) Consistent inelastic design spectra: strength and displacement. Earthq Eng Struct Dyn 23:502–521
Walraven J (2013) Model code 2010: mastering challenges and encountering new ones. Struct Concr 14(1)
Wilson EL, Der Kiureghian A, Bayo EP (1981) A replacement for the SRSS method in seismic analysis. Earthq Eng Struct Dyn 9:187–194
Acknowledgments
Special thanks and appreciation are due to the Author’s co-worker Dr DE Biskinis, as the expressions presented for the deformations at yielding and ultimate and the cyclic shear resistance are based on his Doctoral Thesis and subsequent joint work with the Author.
Author information
Authors and Affiliations
Corresponding author
Editor information
Editors and Affiliations
Rights and permissions
This chapter is published under an open access license. Please check the 'Copyright Information' section either on this page or in the PDF for details of this license and what re-use is permitted. If your intended use exceeds what is permitted by the license or if you are unable to locate the licence and re-use information, please contact the Rights and Permissions team.
Copyright information
© 2014 The Author(s)
About this chapter
Cite this chapter
Fardis, M.N. (2014). From Performance- and Displacement-Based Assessment of Existing Buildings per EN1998-3 to Design of New Concrete Structures in fib MC2010. In: Ansal, A. (eds) Perspectives on European Earthquake Engineering and Seismology. Geotechnical, Geological and Earthquake Engineering, vol 34. Springer, Cham. https://doi.org/10.1007/978-3-319-07118-3_7
Download citation
DOI: https://doi.org/10.1007/978-3-319-07118-3_7
Published:
Publisher Name: Springer, Cham
Print ISBN: 978-3-319-07117-6
Online ISBN: 978-3-319-07118-3
eBook Packages: Earth and Environmental ScienceEarth and Environmental Science (R0)