
Abstract
The ‘BigBrain’ is a high-resolution data set of the human brain that enables three-dimensional (3D) analyses with a 20 µm spatial resolution at nearly cellular level. We use this data set to explore pre-α (cell) islands of layer 2 in the entorhinal cortex (EC), which are early affected in Alzheimer’s disease and have therefore been the focus of research for many years. They appear mostly in a round and elongated shape as shown in microscopic studies. Some studies suggested that islands may be interconnected based on analyses of their shape and size in two-dimensional (2D) space. Here, we characterized morphological features (shape, size, and distribution) of pre-α islands in the ‘BigBrain’, based on 3D-reconstructions of gapless series of cell-body-stained sections. The EC was annotated manually, and a machine-learning tool was trained to identify and segment islands with subsequent visualization using high-performance computing (HPC). Islands were visualized as 3D surfaces and their geometry was analyzed. Their morphology was complex: they appeared to be composed of interconnected islands of different types found in 2D histological sections of EC, with various shapes in 3D. Differences in the rostral-to-caudal part of EC were identified by specific distribution and size of islands, with implications for connectivity and function of the EC. 3D compactness analysis found more round and complex islands than elongated ones. The present study represents a use case for studying large microscopic data sets. It provides reference data for studies, e.g. investigating neurodegenerative diseases, where specific alterations in layer 2 were previously reported.
You have full access to this open access chapter, Download conference paper PDF
Keywords
1 Introduction
The ‘BigBrain’ model represents a three-dimensional (3D)-reconstructed data set at histological sections with a spatial resolution of 20 µm isotropic [1]. It is based on a series of 7404 images of histological sections, where each was scanned originally with an in-plane resolution of 10 µm, down-sampled to 20 µm, resulting in a total data size of 1 TByte [1]. This data set and model represents a unique high-resolution anatomical reference for applications from neuroimaging, modeling and simulation, neurophysiology as well as for research on artificial neuronal networks (for an overview of recent research see https://bigbrainproject.org/hiball.html). At the same time, the ‘BigBrain’ is both a research target and a tool to set up workflows for analyzing large data sets, where methods from artificial intelligence (AI), e.g. machine learning, are part of advanced workflows running on the supercomputers to advance our understanding of the complexity of the brain. Along this line of reasoning, we here address the microstructural organization of the human entorhinal cortex (EC).
The EC is a brain area of the mesial temporal cortex and occupies the rostral part of the parahippocampal gyrus (PhG) (Fig. 1). A unique feature of this part of the so-called periallocortex is the Substratum dissecans, an almost cell-free sublayer [2,3,4,5,6]. It extends parallel to the cortical surface in the midst of the cortex, macroscopically often separating EC into an inner and an outer principal layer [3, 5]. The most prominent feature of EC is layer 2 (or Stratum stellare [4]), which is composed of neurons clustered into groups with different numbers of neurons and different shapes and sizes, the so-called pre-α islands [3, 5] (Fig. 1). The surrounding tissue (‘neuropil’) separates the pre-α islands from each other. Their morphology can presently only be studied in two-dimensional (2D) histological sections of postmortem brain with a spatial resolution that is much higher than that of magnetic resonance imaging (MRI).
Based on histological studies, the shape of pre-α islands was described as elongated in the rostral and medial part of EC, and round in the caudal extent [2]. This variability of pre-α islands in layer 2 combined with the specific cytoarchitectonic features of other layers along the extent of EC led to a partition of this brain area into several subareas [2, 7, 8]. For example, Brodmann (1909) [7] identified areas (BA)28a and BA28b, while Braak and Braak (1992) [8] defined a medial, lateral, and central subarea.
Layer 2 and its pre-α islands are involved in the so-called perforant pathway that supports the processing of spatial memory and context information [9]. Significant decrease of its pre-α cells [10] among other alterations are found in the early stages of Alzheimer’s disease (AD) and may underline early symptoms such as mild cognitive deficits and spatial disorientation. This makes them an interesting research target for the research of AD, but also other neurodegenerative and psychiatric diseases (e.g. Parkinson’s disease, schizophrenia) [8, 11].
Previous studies indicated a rather complex morphology of pre-α islands as these islands were connected by “bridges’’ in different types of sections [8, 12] and section planes [13]. For example, the latter study noted immunolabeled “bridges” in the interstices (spaces between two cell islands) that appeared to connect two islands. However, these morphological analyses were limited to only one section plane (e.g. by using either flat, tangential, or sagittal sections) and were therefore not able to follow the progression of pre-α islands in the other planes to fully characterize their shape and size.
Therefore, the aim of the present study was to combine established and state-of-the-art data sets and tools into a workflow for a comprehensive analysis of the morphology of layer 2 pre-α islands in their reconstructed 3D environment. Specifically, this study aims (i) to characterize the morphology of the pre-α islands of layer 2 and their distribution along the longitudinal axis of the EC, and (ii) to measure and analyze distributional features of pre-α islands (‘gradients’ based on intensity measurements) and their shape (‘compactness’) in the human EC.
Based on the high-resolution 3D ‘BigBrain’ model, the left and right EC were annotated, followed by the generation of 3D surface meshes in Atelier3D (A3D, National Research Council of Canada, Canada, [14]), a software that was optimized to visualize and annotate the very large data set of the reconstructed ‘BigBrain’ model. Subsequent machine-learning based analysis was used to distinguish between pre-α islands and background. Data analysis and visualization of the pre-α islands were performed on cropped annotated parts of the whole brain sections of the ‘BigBrain’ [1]. The visualization of the EC with its pre-α islands in the ‘BigBrain’ data set was performed using the supercomputer JURECA at Jülich Supercomputing Centre (JSC) [15]. Combined they enabled the visualization and in-depth analysis of the pre-α islands, their sizes, shapes, and underlying gray values in the reconstructed environment of the complete EC and the entire human brain.
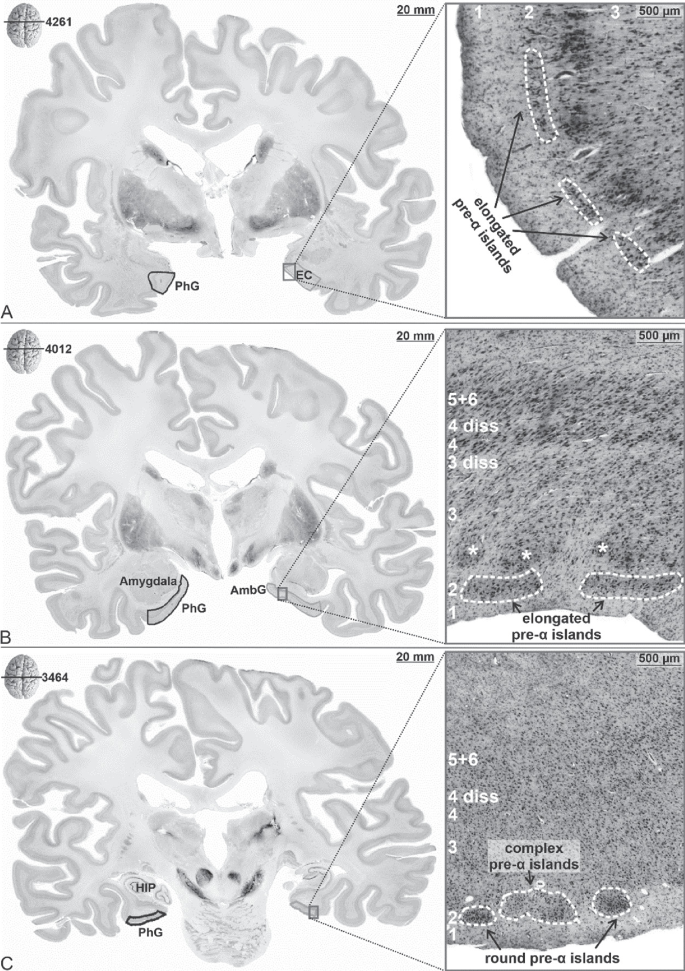
Coronal sections of the human ‘BigBrain’ model (20 µm isotropic resolution) of the EC (on the left) and its cytoarchitecture (1 µm in-plane resolution) in its rostral (A), intermediate (B), and caudal part (C) (on the right). Dark contours: EC in the left hemisphere, light contour: right EC. Note the different types of pre-α islands (elongated, round, and complex) in layer 2 (white dotted lines). Section numbers and position in the ‘BigBrain’ are shown in the upper left corner. Layers of the EC indicated by Arabic numerals. Abbreviations: AmbG, Ambient gyrus; PhG, Parahippocampal gyrus; HIP, Hippocampus. Layers of EC [4]: 1, Layer 1 (Stratum moleculare); 2, Layer 2 (Stratum stellare); 3, Layer 3 (Stratum pyramidale); 3 diss and 4 diss, Substrata dissecantia; 4, Layer 4 (Stratum magnocellulare); 5, Layer 5 (Stratum parvocellulare); 6, Layer 6 (Stratum multiforme). * in B: clusters of the superficial layer 3.
2 Material and Methods
2.1 Histological Processing and 3D-Reconstruction of ‘BigBrain’
In accordance with ethical requirements, a post-mortem human brain of a 65-year old male body donor with no medical history of neurological or mental illness was acquired during an autopsy performed under the body donor program of the University of Düsseldorf [1] (#4863). The brain was sectioned in the coronal plane (slice thickness: 20 µm) and stained for cell bodies using modified silver staining. 7404 sections were acquired and digitized with an in-plane resolution of 10 µm, then down-sampled to 20 µm and 3D-reconstructed, resulting in an isotropic resolution of 20 µm and a data set of about 1 TByte [1]. In addition, histological sections were digitized with high throughput bright-field microscopes (TissueScope LE120, Huron Digital Pathology), resulting in an in-plane resolution of 1 µm, which was used to verify the results at high-resolution. The image size for the latter was about 8–10 GByte per brain section image (8bit, bigtif format, uncompressed).
2.2 Border Definition and Annotation of the EC in A3D
The analysis of EC and adjacent regions was performed in high-resolution (1 µm) sections of the ‘BigBrain’ available in MicroDraw (The Institut Pasteur, Paris, France, https://github.com/r03ert0/microdraw) (Fig. 2). The cytoarchitectonic criteria for identifying the borders were based on previous cytoarchitectonic mappings of EC in ten post-mortem brains [16] according to criteria in literature [2, 17,18,19,20,21]. The EC was annotated in the images of the 3D-reconstructed ‘BigBrain’ (20 µm isotropic resolution) [1] using A3D [14] (Fig. 3). A3D was adapted in the framework of the international collaboration project ‘BigBrain’ to visualize and annotate the spatial data of the 3D reconstructed histological ‘BigBrain’ data set (https://bigbrainproject.org/hiball.html). As a result, 77 annotations in the left hemisphere (ID3, blue/dark) and 92 annotations in the right hemisphere (ID2, green/light) were obtained (Figs. 2 and 3). In general, every 25th section was annotated, but in cases where the 3D geometry, e.g. the thickness and total surface area of EC, changed considerably between the gaps of 25 sections, additional annotations were performed in every fifth section. A3D was then used to create gapless 3D structures from the original 2D annotations.
This resulted in individual 3D surface meshes of the EC of each hemisphere, computed in A3D (Fig. 2). The surfaces were checked for artifacts, iteratively adjusted, and corrected. The rough edges on the painted surfaces are delicately smoothed locally using normalized curvature operators in the normal direction [22, 23]. The smoothing method is applied on the 3D surfaces preserving their specific structures. This smoothing retains the area of the 3D triangular mesh as well as the volume inside the surface. It also avoids moving too far from the drawn points based on thresholds. Subsequently, the 3D Cartesian coordinates of EC surface contours were exported to be processed in MATLAB® (MathWorks, USA), with x-coordinates indicating the mediolateral (sagittal) axis, y-coordinates the dorsoventral (horizontal) axis, and the z-coordinates the rostrocaudal (coronal) axis (Fig. 3).
The coordinates of the surfaces resulted in dense binary masks of the EC and its pre-α islands. Furthermore, the coordinates were used to crop smaller parts of the whole brain images including EC (Fig. 2). In total, 1065 images for the left and 1063 images for the right hemisphere were cropped, resulting in a data set of about 1.2 GByte. Finally, a 3D median filter (r = 2px) was used to reduce the signal-to-noise ratio and emphasize the pre-α island boundaries.

Sequence and input/output data of the used programs. The rounded boxes indicate software tools, while square boxes indicate the main processing steps. Hexagons indicate plug-ins used in ImageJ (U.S. National Institutes of Health, USA) [24], while the half-square/angular boxes show the results of each process. The respective programs were used online in a browser, on a Windows operating system, on a Unix operating system, and in an HPC environment. Border identification in Microdraw (The Institut Pasteur, Paris, France, https://github.com/r03ert0/microdraw) was performed in sections of the ‘BigBrain’ with an in-plane resolution of 1 µm, while all other steps were performed in 3D based on the 3D-reconstructed ‘BigBrain’ sections with an isotropic resolution of 20 µm.

Overview of the reconstructed sagittal, original coronal, and reconstructed horizontal section planes, as well as of the ‘3D view – volume’ (bottom right) of the ‘BigBrain’ in A3D. EC of the left hemisphere dark, right hemisphere light. The EC is visualized as corresponding surfaces within the 3D ‘BigBrain’ model, with the surfaces magnified in the cutout for better visualization.
2.3 Segmentation of Pre-α Islands in Ilastik
Segmentation of pre-α islands of the left and the right hemisphere was performed separately using the machine-learning based ‘Pixel Classification’ workflow of ilastik (European Molecular Biology Laboratory, Heidelberg, Germany) [25] (Fig. 2). After loading the cropped EC image stacks from A3D (20 µm isotropic resolution) and selecting all available descriptive image filters as features, a ‘training’ based on the Random Forest classifier was performed using training labeling for the classes background (Fig. 4, light) and pre-α islands (Fig. 4, dark). In total, training was performed per hemisphere on sixteen coronal (every 50th to 100th section), eight sagittal (every 100th section), and six horizontal (every 50th section) cropped EC sections. The 37 features include descriptors of pixel intensity (Gaussian Smoothing), edge-ness (Laplacian of Gaussian, Gaussian Gradient Magnitude, and Difference of Gaussians), and texture (Structure Tensor Eigenvalues, Hessian of Gaussian Eigenvalues) including their respective scales (σ: 0.3 (only Gaussian Smoothing), 0.7, 1, 1.6, 3.5, 5, and 10). The Random Forest classifier uses an ensemble of numerous individual decision trees, and here 100 trees were used, with a class prediction made for each tree individually (the class with the most votes being the prediction of the model) [25]. After completion of the training, segmented image stacks for the left hemisphere (1065 images, 8 bit, 898 × 712 pixels, 641 MByte) and right hemisphere (1063 images, 8 bit, 898 × 640 pixels, 583 MByte) of EC were exported (Fig. 4).

Segmentation of pre-α islands in ilastik (here section number 700, left hemisphere). Training was performed with cropped EC images (left image), which were labeled (middle image) for the classes background (light) and pre-α islands (dark). The completion of the training resulted in segmented images (right image) showing the pre-α islands (dark) and background (light).
2.4 Analysis of Pre-α Islands in ImageJ
ImageJ was used to automatically quantify and describe the properties of the pre-α islands segmented with ilastik (Fig. 2). The detected pre-α islands were individually labeled and determined by their centroid coordinates. The analysis of the segmented pre-α islands in their 3D environment allowed to extract a set of parameters (e.g. 3D coordinates, volume, and compactness).
The compactness (range between 0 and 1) describes the ratio of pre-α islands volume and the smallest possible surrounding sphere including the individual pre-α islands. A value of 1 corresponds to a sphere and lower values to more complex structures.
Additionally, mean, mode, and standard deviation of the gray values were taken from the original ‘BigBrain’ images (8 bit, 20 µm resolution, unprocessed) at the corresponding positions of the segmented island. Cell islands that were smaller than five voxels (voxel size 20 µm isotropic) were removed based on the definition of islands as structures of three or more clustered neurons.
Finally, the mean gray values were inverted (x̄(gray value) = 256-value), which resulted in lower and higher mean values corresponding to lower and higher cell-packing densities, respectively. Gradients of these gray values were plotted along the three main axes of the brain. Pearson correlations were computed including squared correlation coefficients, and the correlations were analyzed for significance. To exclude a possible bias of the gray level gradients due to the histological staining or the global correction of the intensities of the ‘BigBrain’ data set, the gray levels of the entire entorhinal cortex without the pre-α-islands were additionally determined. The pre-α islands of the cropped EC images were 3D visualized using the ImageJ ‘3D viewer’ plug-in.
2.5 Visualization of the EC and the Included Pre-α Islands in the Context of the Entire ‘BigBrain’ Data Set
To visualize the EC and the included pre-α islands in the context of the entire ‘BigBrain’ data set, 2D segmentation images of both structures were stacked along the rostrocaudal axis to create 3D volumes (Fig. 2). These were subsequently converted to a custom data format which can be displayed in the interactive 3D atlas viewer of the Human Brain Project [26] hosted by the EBRAINS infrastructure (https://ebrains.eu/).
In addition, 3D triangular surface meshes (left hemisphere (ID3): 1886051 points and 3781098 triangles for islands, 2854912 points and 5709820 triangles for EC; right hemisphere (ID2): 1680293 points and 3369782 triangles for islands, 2743662 points and 5487320 triangles for EC) were extracted from the volumes using the marching cubes algorithm [27] to visualize the 3D appearance of the structures. Due to the large size of the data set of the EC in the whole BigBrain context (~37 GByte stack size, 6572 × 1064 × 5711 voxels), which did not allow for post-processing on classical desktop PCs, surface extraction was performed by subdividing the volumes into 3D chunks, which were then processed in parallel using the supercomputer system JURECA [15] at Jülich Supercomputing Centre (JSC).
3 Results
3.1 Overview of the Layers of the EC
The EC consists of six layers and almost cell free Substrata dissecantia (3 diss (external layer), 4 diss (internal layer) Figs. 1B, 5 and 6). Layer 2 harbored large stellate cells (modified pyramidal cells), forming pre-α islands of different size and shape, separated by neuropil.
In layer 3, pyramidal cells clustered into columns in the intermediate part of EC (Fig. 1B). The Substrata dissecantia continued in parallel to the pial surface: The rostral part of EC revealed only the external Substratum dissecans (3 diss) (Figs. 5 and 6), whereas the intermediate and caudal portions of EC showed both 3 diss and 4 diss (Fig. 1B–C). Layer 4 showed large and darkly stained neurons and was clearly visible along the rostrocaudal extent of EC. No clear border was visible between layer 5 and layer 6 as they often seemed to intermingle (Fig. 1B–C). The border between layer 6 and the white matter was distinct only in the intermediate to caudal parts of EC (Fig. 1B–C), but not rostrally.
Layer 2, Substrata dissecantia, and layer 4 of EC were specific to EC, but not to the neighboring structures. EC has borders with the amygdalopiriform transition area (APir), hippocampal-amygdaloid transition area (HATA), the parasubiculum (PaS), and BA35a (Figs. 5 and 6).
3.2 Cytoarchitecture of Layer 2 (Pre-α Islands) and Modifications Along the Rostrocaudal Extent
The rostral part of EC showed the smallest (often narrow) pre-α islands separated from each other by little gaps (Fig. 1A). Neurons within the islands were more densely packed than in the rest of the EC. In the intermediate part of EC, pre-α islands were characterized by the largest size and the largest gap from the neighboring islands (Fig. 1B). In the caudal part of EC, pre-α islands were the most variable in their density and size (Fig. 1C). The three parts of EC differed from each other by the type of the predominantly found islands: small and round islands were found in the rostral part (which also showed a few narrow, elongated islands, Fig. 1A), elongated in the intermediate part, and round in the caudal part.

3D surface model of EC of the left hemisphere as computed in A3D (upper part of each frame) and corresponding annotation in coronal cytoarchitectonic section (lower image in each frame) from the rostral (top left) to the caudal (bottom right) extent of EC. The crosshairs in the cytoarchitectonic section show the exact position of the annotated EC within the 3D-reconstructed EC. The sagittal, horizontal, and coronal lines of the crosshairs correspond to the mediolateral, dorsoventral, and rostrocaudal plane, and the Cartesian x, y, and z coordinates, respectively. The EC has different neighboring areas along the rostrocaudal extent. Section numbers in the bottom right corner. Abbreviation: AmbG, ambient gyrus; APir, amygdalopiriform transition area; BA35a, Brodmann area 35a; EC, entorhinal cortex; HATA, hippocampal-amygdaloid transition area; PaS, parasubiculum [16]. *, incised and downward protruding cortex

3.3 Surface and Morphological Features of Pre-α Islands in EC
Annotations for each hemisphere were stacked, smoothed while keeping the volume constant and visualized as 3D surfaces in A3D (Figs. 2, 5 and 6). On both sites, the EC shows the broadest extent in its intermediate part, while it becomes more compact in the most rostral and most caudal parts (Figs. 5 and 6). The peek in the intermediate part of EC belongs to the AmbG that is ventrally limited from the PhcG of EC by the intrarhinal sulcus [28]. The intrarhinal sulcus is clearly visible in the right hemisphere, where it can also be identified in the coronal sections (see asterisk in Fig. 6), while in the left hemisphere it was shallow (Fig. 5). The cortex of the left hemisphere was slightly damaged during the sectioning process of the paraffine embedded brain (see asterisk in Fig. 5). Therefore, an elevation of the surface could be observed in the 3D model (Fig. 5). This did not, however, affect the quality of the annotations and surface extractions of EC, as well as subsequent segmentation and analysis of pre-α islands (Fig. 7).
The 3D models of pre-α islands revealed a variety of different shapes. Three main groups were identified according to their measured compactness: round, elongated, and complex islands (Figs. 7 and 9). The comparison of the various shapes of the complex islands in 3D and the shapes seen in 2D histological sections indicated that the complex islands were composed of interconnected round and elongated ones that compose layer 2 of EC.
The pre-α island surfaces showed further structural differentiation (based on distribution, size, and shape of the islands) between the rostral, intermediate, and caudal parts of EC (Fig. 7). The rostral part showed the smallest and most densely packed pre-α islands of predominantly elongated and round shape. The intermediate part of EC was less densely packed than in its rostral part and revealed the largest islands with the widest gaps between them. In addition to elongated and round islands, the intermediate part showed the largest number of complex islands. The caudal part of EC included round and complex islands, which were larger and less densely packed than in the rostral part of EC, but more densely packed and smaller than in its intermediate part.

Visualization of pre-α island surfaces in the EC: left and right hemispheres. The asterisks in the left hemisphere indicate regions with cutting artifacts: *, small cuts in the cortex; **, artifact of the digitally repaired 3D reconstruction of ‘BigBrain’; ***, incised and downward protruding cortex. Abbreviation: AmbG, ambient gyrus
3.4 Number and Distribution of Pre-α Islands
In total, 2045 pre-α islands in the left and 1841 pre-α islands in the right hemisphere were found. In the following, a gradient of pre-α islands corresponds to the mean gray values for each pre-α islands as a correlate of their cell-packing density (Fig. 8).
The medial versus lateral gradient of pre-α islands indicated that the cell-packing density was higher in the lateral than in the medial EC, for both the left (slope = 0.0058; R2 = 0.0158) and right hemispheres (slope = −0.018; R2 = 0.12).
Regarding the dorsal to ventral gradient of pre-α islands, a slight increase in the cell-packing density was observed in the left hemisphere (slope = 0.0198; R2 = 0.0741) and a minimal decrease in the right hemisphere (slope = −0.006; R2 = 0.0075).
Finally, the gradient from caudal to rostral showed a slight decrease in cell-packing density in both the left (slope = −0.0018; R2 = 0.0015) and right (slope = −0.0049; R2 = 0.0176) hemispheres. All correlations were significant (p < 0.05), except the correlation along the dorsal-ventral axis of the left hemisphere, which did not reach significance (p = 0.0840).

Gradients of pre-α islands in EC, represented as mean gray values per pre-α islands, as a correlate of the cell-packing density within each island. Each ball (dark gray, left hemisphere; light gray, right hemisphere) represents a 3D centroid, thus a pre-α island. Medial versus lateral gradient: Note the difference between the hemispheres. Since the surfaces for each hemisphere were extracted separately and the values are sorted by their x-coordinates, the mean gray values in the left hemisphere are indicated from lateral to medial (outside to inside), while in the right hemisphere they are indicated from medial to lateral (inside to outside). Dorsal to ventral gradient: Note a longer line related to the left hemisphere, which is a reflection of an incised and downwards protruding cortex in the intermediate and caudal parts of the left EC (see asterisk in Figs. 5 and 7). Caudal to rostral gradient: Note that the z-coordinate goes from the most caudal (posterior) to the most rostral (anterior) coordinate.
The analysis of compactness showed that the morphology of pre-α islands varied between elongated, complex, and round, whereby the transitions between them were rather smooth (Fig. 9). Moreover, the histograms were left-skewed, indicating that there were more round and complex than elongated islands in EC of both hemispheres. Finally, the distribution of the different types of islands was highly comparable in both hemispheres.
The data are publicly available as part of the multilevel human brain atlas in the EBRAINS infrastructure and can be explored interactively in the EBRAINS 3D atlas viewer (https://atlases.ebrains.eu/viewer).

Histogram indicating the frequency of compactness (from 0.12 to 1 in steps of 0.04) of pre-α islands in the left hemisphere (in total 2045 pre-α islands; upper histogram) and in the right hemisphere (in total 1841 pre-α islands; lower histogram) of the ‘BigBrain’ EC. For the left hemisphere, three examples are given for the different types of pre-α islands: one elongated (range of compactness (0.32, 0.36]), one complex (range of compactness (0.60, 0.64]) and one round (range of compactness (0.92, 0.96]) island.
4 Discussion
Based on the high-resolution data set of the 3D-reconstructed ‘BigBrain’ [1], we created a workflow that allowed a comprehensive analysis of the individual morphology and distribution of pre-α islands in layer 2 of the EC, by using existing and new software tools. The visualization and annotation software A3D was used to annotate the EC in both hemispheres, followed by the preparation of cropped EC images in MATLAB®. The machine-learning based ‘Pixel Classification’ tool of ilastik [25] was trained to identify and segment pre-α islands. ImageJ [24] was used to visualize the 3D surface of the segmented pre-α islands and to analyze individual pre-α islands in their spatial extent, including intensity and geometric measurements. Finally, whole brain section masks of the EC and the included pre-α islands were used to visualize the results in its native 3D environment employing marching cubes algorithm at the supercomputer system JURECA [15] at Jülich Supercomputing Centre (JSC). The required programs and the input and output files generated in each case are shown as a flowchart in Fig. 2.
The applications shown here using the ‘BigBrain’ data set enable a better understanding of the morphology of pre-α islands and a description of their underlying cytoarchitecture. Although pre-α islands exist only in the EC, there are other brain areas that show structures of distinct morphology. For example, the cell clusters of the amygdalopiriform transition area, for which our workflow, i.e. the annotation in A3D, labeling of structures in ilastik, and their 3D visualization in ImageJ, could be applied or adapted.
By focusing on the morphological characteristics of pre-α islands in the ‘BigBrain’ model, numerous islands of a specific shape were analyzed. Compactness analysis, performed for the first time at high-resolution in 3D space, revealed round and complex islands as the predominant island types. In addition, 3D characterization of pre-α islands using the ‘BigBrain’ model allowed the identification of differences based on the distribution, size, and shape of islands in the rostral, intermediate, and caudal part of EC. Here, the largest number of complex islands was observed in the intermediate part of EC. Previous approaches indicated the complexity of the pre-α islands by reporting “bridges” [8, 12, 13]. However, the analysis of complex islands based on 2D images is complicated and error-prone because they do not allow following islands between sectional planes. Thus, classical histological 2D analysis can only provide a limited description of the 3D shape and size of pre-α islands. As a result, the number of complex islands observed in 2D sections is lower than the number obtained from 3D analyses.
Regarding interhemispheric differences in the layer 2 characteristics, the present study found more pre-α islands in the left than in the right hemisphere by comparing the numbers of 3D centroids (i.e. pre-α islands) that were exported from ImageJ. Although this result is based on only one human brain, it is supported by a previous study that found a higher number of pre-α neurons in the left than in the right EC, in 18 out of 22 human brains analyzed [21].
To our knowledge, density gradients based on intensity measurements, in particular, gray values corresponding to the cell packing densities, of all pre-α islands embedded in layer 2 of EC have not been discussed or raised in previous studies. Nevertheless, previous cytoarchitectonic and immunohistochemical studies are in support of the present results on the rostral to caudal increase of cell packing density. Heinsen et al., 1994 [21], observed such a gradient on the basis of sections Nissl-stained with gallocyanin, whereas Beall and Lewis (1992) [29] described increases towards the caudal extent of EC based on light transmittance of phosphorylated neurofilament protein immunoreactivities. Interestingly, anatomical and electrophysiological studies regarding the hippocampus provided evidence for a gradient along its dorsoventral axis in rodents, while gene expression studies indicated distinct functional domains with often clearly demarcated borders [30]. These observations led to the conclusion that the well-known view that spatial navigation and memory, and thus cognitive functions, are mediated in the dorsal (or posterior) parts of the hippocampus, whereas emotional responses are mediated in its ventral (or anterior) part, should be reconsidered. It is now proposed that hippocampal functional gradients may be superimposed on distinct functional domains at both the anatomical and mRNA levels [30]. Regarding the functional topography of the EC, Navarro Schröder et al., 2015 [31], performed a high-field functional MRI study (at 7 T) in which two groups of independent participants were presented with either images of scenes (for spatial stimuli) or images of objects (for non-spatial stimuli). They showed evidence of functional division along the anteroposterior axis, as the anterior EC showed higher responses to non-spatial stimuli and the posterior EC showed higher responses to spatial stimuli. It would be interesting to investigate whether there is a functional gradient along the rostrocaudal (anteroposterior) axis of EC that correlates with the density gradients we found in the present study. Finally, whether these then correlate with the proposed gradients along the hippocampal long axis.
Previous cytoarchitectonic studies subdivided the EC based on the differences found in all layers (into two subareas in Brodmann (1909) [7] to eight subareas in Insausti et al., 1995, 2017 [2, 17]). However, the present study describes the heterogeneity of pre-α islands at the level confined to one layer, layer 2. In the intermediate and caudal parts of EC, we identified conspicuous islands of different shapes (our complex islands) in addition to the island types described by Insausti et al., 1995 [2]. These islands were not clearly separated from each other and appeared to be composed of interconnected islands of other types, resulting in a complex morphology. Braak and Braak (1992) [8] identified three major subareas (medial, lateral, and central), based on specific features of entorhinal layers in different parts of EC. The authors considered bipartition of pre-α and pre-β layer (layer 2 and 3 of Zilles (1987) [4]) as a criterion for the medial subarea which covered the ambient gyrus. Moreover, a characteristic tripartition of the pri-α layer (layer 4 of Zilles (1987) [4]) marked their central subarea, which covered a part of the parahippocampal gyrus [8]. In contrast, based on the distribution of pre-α islands, the present study suggests that the ambient gyrus partly comprises the rostral and intermediate parts of EC.
However, since only one ‘BigBrain’ was analyzed as a use case in the present study, but 3D-reconstructions of two other ‘BigBrains’ are currently under development, we intend to apply our workflow to these ‘BigBrain’ models. This will facilitate visualization of pre-α island surfaces and further descriptive analyses, but could also enable quantitative analysis of possible EC subareas. Further application of the method presented here to other high-resolution brain models will also allow continued investigation of the interindividual variability of pre-α islands at the highest resolution level.
Taken together, the present study demonstrated a new workflow for data analysis and visualization of EC and its embedded pre-α islands using machine-learning based and image data analysis tools. With these tools, we demonstrated new characteristics of the human EC and pre-α islands embedded therein, in particular the existence of complex islands and the rostral to caudal cell-packing density gradient. As pre-α cells of EC are involved in the functionally important perforant pathway, it becomes clear why it is so important to understand the natural structure of EC in order to detect possible changes during aging and in neuro-/psychiatric diseases. The results of this study will be made available to the neuroscientific community via the research infrastructure EBRAINS and will be linked to the multilevel human brain atlas of EBRAINS. The representation of the surfaces of the EC and the islands contained therein is of particular interest to a broad readership. The first-time visualization of these microscopic structures in the context of the entire brain represents an important bridge between basic research and possible medical applications, as it is common in medicine to view the brain in its natural three-dimensional environment. Our current results could provide a reference model for future studies of neurodegenerative and psychiatric diseases such as Alzheimer’s, Parkinson’s, and schizophrenia.
References
Amunts, K., et al.: BigBrain: an ultrahigh-resolution 3D human brain model. Science 340(6139), 1472–1475 (2013)
Insausti, R., Tunon, T., Sobreviela, T., Insausti, A.M., Gonzalo, L.M.: The human entorhinal cortex: a cytoarchitectonic analysis. J. Comp. Neurol. 355(2), 171–198 (1995)
Braak, H.: Zur Pigmentarchitektonik der Großhirnrinde des Menschen. Z. Zellforsch. Mikrosk. Anat. 127(3), 407–438 (1972)
Zilles K.: Graue und weiße Substanz des Hirnmantels. Anatomie des Menschen In Georg Thieme Verlag, Stuttgart, pp. 382–471 (1987)
Rose, M.: Der Allocortex bei Tier und Mensch I. Teil J. Psychol. Neurol. 34, 1–111 (1927)
Lorente de Nó, R.: Studies on the structure of the cerebral cortex. II. Continuation of the study of the ammonic system. J. für Psychologie und Neurologie (1934)
Brodmann, K.: Vergleichende Lokalisationslehre der Grosshirnrinde in ihren Prinzipien dargestellt auf Grund des Zellenbaues. Barth (1909)
Braak, H., Braak, E.: The human entorhinal cortex: normal morphology and lamina-specific pathology in various diseases. Neurosci. Res. 15(1–2), 6–31 (1992)
Duvernoy, H.M.: The Human Hippocampus: Functional Anatomy, Vascularization and Serial Sections with MRI. Springer, Heidelberg (2005). https://doi.org/10.1007/b138576
Gómez-Isla, T., Price, J.L., McKeel, D.W., Jr., Morris, J.C., Growdon, J.H., Hyman, B.T.: Profound loss of layer II entorhinal cortex neurons occurs in very mild Alzheimer’s disease. J. Neurosci. 16(14), 4491–4500 (1996)
Braak, H., Braak, E.: Neuropathological stageing of Alzheimer-related changes. Acta Neuropathol. 82(4), 239–259 (1991)
Braak, H.: Architectonics of the Human Telecephalic Cortex. Springer, Heidelberg (1980)
Hevner, R.F., Wong-Riley, M.T.: Entorhinal cortex of the human, monkey, and rat: metabolic map as revealed by cytochrome oxidase. J. Comp. Neurol. 326(3), 451–469 (1992)
Borgeat, L., Godin, G., Massicotte, P., Poirier, G., Blais, F., Beraldin, J.A.: Visualizing and analyzing the Mona Lisa. IEEE Comput. Graph. Appl. 27(6), 60–68 (2007)
Krause, D., Thörnig, P.: Jureca: Modular supercomputer at jülich supercomputing centre. J. Large-Scale Res. Facil. JLSRF 4, 132 (2018)
Amunts, K., et al.: Cytoarchitectonic mapping of the human amygdala, hippocampal region and entorhinal cortex: intersubject variability and probability maps. Anat. Embryol. 210(5), 343–352 (2005)
Insausti, R., Muñoz-López, M., Insausti, A.M., Artacho-Pérula, E.: The human periallocortex: layer pattern in presubiculum, parasubiculum and entorhinal cortex. A review. Front. Neuroanat. 11, 84 (2017)
Ding, S.L., Van Hoesen, G.W.: Borders, extent, and topography of human perirhinal cortex as revealed using multiple modern neuroanatomical and pathological markers. Hum. Brain Mapp. 31(9), 1359–1379 (2010)
Braak, H., Braak, E.: On areas of transition between entorhinal allocortex and temporal isocortex in the human brain. Normal morphology and lamina-specific pathology in Alzheimer’s disease. Acta Neuropathol. 68(4), 325–332 (1985)
Krimer, L.S., Hyde, T.M., Herman, M.M., Saunders, R.C.: The entorhinal cortex: an examination of cyto-and myeloarchitectonic organization in humans. Cereb. Cortex 7(8), 722–731 (1997)
Heinsen, H., et al.: Quantitative investigations on the human entorhinal area: left-right asymmetry and age-related changes. Anat. Embryol. 190(2), 181–194 (1994)
Desbrun, M., Meyer, M., Schröder, P., Barr, A.H.: Implicit fairing of irregular meshes using diffusion and curvature flow. In: Proceedings of the 26th Annual Conference on Computer Graphics and Interactive Techniques, pp. 317–324 (1999)
Kroon, D.J.: Smooth triangulated mesh. MATLAB Central File Exchange (2019). https://www.mathworks.com/matlabcentral/fileexchange/26710-smooth-triangulated-mesh
Schneider, C.A., Rasband, W.S., Eliceiri, K.W.: NIH Image to ImageJ: 25 years of image analysis. Nat. Methods 9(7), 671–675 (2012)
Berg, S., et al.: ilastik: interactive machine learning for (bio)image analysis. Nat. Methods 16(12), 1226–1232 (2019)
Amunts K., et al.: The human brain project—synergy between neuroscience, computing, informatics, and brain-inspired technologies. PLoS Biol 17(7), e3000344 (2019)
Lewiner, T., Lopes, H., Vieira, A.W., Tavares, G.: Efficient implementation of marching cubes’ cases with topological guarantees. J. Graph. Tools 8(2), 1–15 (2003)
Insausti, R., Córcoles-Parada, M., Ubero, M.M., Rodado, A., Insausti, A.M., Muñoz-López, M.: Cytoarchitectonic areas of the gyrus ambiens in the human brain. Front. Neuroanat. 13, 21 (2019)
Beall, M.J., Lewis, D.A.: Heterogeneity of layer II neurons in human entorhinal cortex. J. Comp. Neurol. 321(2), 241–266 (1992)
Strange, B.A., Witter, M.P., Lein, E.S., Moser, E.I.: Functional organization of the hippocampal longitudinal axis. Nat. Rev. Neurosci. 15(10), 655–669 (2014)
Schröder, T.N., Haak, K.V., Jimenez, N.I.Z., Beckmann, C.F., Doeller, C.F.: Functional topography of the human entorhinal cortex. Elife 4, e06738 (2015)
Acknowledgments
This project has received funding from the European Union’s Horizon 2020 Framework Programme for Research and Innovation under the Specific Grant Agreement No. 945539 (Human Brain Project SGA3). This work was also funded by Helmholtz Association’s Initiative and Networking Fund through the Helmholtz International BigBrain Analytics and Learning Laboratory (HIBALL) under the Helmholtz International Lab grant agreement InterLabs-0015. Computing time was granted through JARA on the supercomputer JURECA at Jülich Supercomputing Centre (JSC).
Author information
Authors and Affiliations
Corresponding author
Editor information
Editors and Affiliations
Rights and permissions
Open Access This chapter is licensed under the terms of the Creative Commons Attribution 4.0 International License (http://creativecommons.org/licenses/by/4.0/), which permits use, sharing, adaptation, distribution and reproduction in any medium or format, as long as you give appropriate credit to the original author(s) and the source, provide a link to the Creative Commons license and indicate if changes were made.
The images or other third party material in this chapter are included in the chapter's Creative Commons license, unless indicated otherwise in a credit line to the material. If material is not included in the chapter's Creative Commons license and your intended use is not permitted by statutory regulation or exceeds the permitted use, you will need to obtain permission directly from the copyright holder.
Copyright information
© 2021 The Author(s)
About this paper

Cite this paper
Behuet, S. et al. (2021). A High-Resolution Model of the Human Entorhinal Cortex in the ‘BigBrain’ – Use Case for Machine Learning and 3D Analyses. In: Amunts, K., Grandinetti, L., Lippert, T., Petkov, N. (eds) Brain-Inspired Computing. BrainComp 2019. Lecture Notes in Computer Science(), vol 12339. Springer, Cham. https://doi.org/10.1007/978-3-030-82427-3_1
Download citation
DOI: https://doi.org/10.1007/978-3-030-82427-3_1
Published:
Publisher Name: Springer, Cham
Print ISBN: 978-3-030-82426-6
Online ISBN: 978-3-030-82427-3
eBook Packages: Computer ScienceComputer Science (R0)