
Abstract
Within TRIZ literature, only a small part is focused on the management of the requirements. In the majority of cases, they are treated at a mere technological level rather than marketing, by taking into account the requirements that have the greatest market potential.
According to the market potential technique, in the early stage phases of design, the product to be innovated is divided into a list of different properties that will be assessed individually in terms of importance and satisfaction. In order to support the evaluation made by product experts (R&D Team and Marketing Team), a search for knowledge must be carried out. This involves, for example, the research in each requirement for information contained in brochures, commercial catalogs, patents literature and scientific articles with the aim of extracting trends, statistics, emerging technologies and unresolved problems. This procedure requires time and a large economic investment, especially if integrated with market research, often costly and time consuming. To overcome these limitations, the novelty proposed in this article consists in a method to automate the estimation of the importance of each requirement, or at least those for which information is available in the various document sources.
An exemplary case dealing with an aerogel panel for civil application is proposed, stressing the geographical area in such a way as to define the investment and how it integrates into the potential market.
You have full access to this open access chapter, Download conference paper PDF
Keywords
1 Introduction
This paper is addressing the main needs of the industrial sector regarding the definition of innovations tasks in the very early stage of the innovation process.
The present situation in planning and executing of innovation projects within industrial enterprises contains considerable drawbacks. These inconveniences can be summarized as the lack of tools for systematic task definition for short and long term innovation or low reliability of market success prediction for new product concepts in the early stages of innovation process [1].
Although the best endeavor to reduce risk of failures, the majority of all industrial innovation initiative offers only incremental improvements compared to the products on the market. The attempts to incorporate customers into new product development require time-expensive interviews and surveys or extensive field research and rarely presents significant competitive advantages [1].
Using patent information makes the customer needs transfer feasible and manageable. The use of patents in order to estimate the market potential of a technique can be considered an efficient method to compare, monitor and analyze research activity in a specific sector of technology. Patent statistics are used as indicators of activity related to inventions. An analysis of patented technologies can provide information on technological trends. Like any methodology, the use of patents as indicators also has its limits: there is not always a correspondence between innovation and patented inventions, just as not all patented inventions have a technical value [2].
This procedure involves the following topics: analysis of market and technological trends. In order to predict costumer benefits, scholars employed the application of technological or market trends, TRIZ patterns of system evolution and trends of needs evolution.
Nevertheless, today the trend analysis delivers too general or to obvious results and can be considered as supplementary method only. The new TRIZ based approaches are too general or solution-oriented. For example, one method evaluates the relationships between market trends and TRIZ evolution patterns [3]. Based on the TRIZ laws of system evolution the universal trends of needs evolution can be formulated and applied for identification of hidden needs and for forecasting of new needs of customers [4].
Analysis of patent information: besides the mentioned approaches, this paper proposes the use of patent information for the identification of customer benefits. An important source of information to identify unsolved problems and to derive customer benefits is constituted by patent databases, which in fact is not available in any other source. According to the modern tools for patent text-mining and syntactic parsing tools, the information can be obtained more quickly and precisely. Moreover, with the patent analysis one can easily access and retrieve information for general inventive tasks and thus for benefits for the products from different industrial sectors with similar customer working processes.
Patent information enhanced through computer-aided classification and retrieval contributes significantly to the acceleration of innovation processes. The automatic retrieval of problems [5] or technical contradictions [6] helps experts to reduce the time needed for finding solutions. Analyzing and categorizing patents according to the TRIZ evolution patterns assists to identify the evolutionary potential and possible improvements of products. Patent analysis is hence applicable for forecasting emerging technologies, even if no historical data is available [7], and also for developing acquisition strategies [8].
Evaluation of market potential for customer benefits: according to [1], a new advanced computation algorithm includes a regression model which is suitable for calculation of the market potential as a function of importance and satisfaction for all values of the input variables.
According to the market potential technique, in the early stage phases of design, the product to be innovated is divide into a list of different properties that will be assessed individually in terms of importance and satisfaction. In order to support the evaluation made by product experts (R&D Team and Marketing Team), a search for knowledge must be carried out. This involves, for example, the research in each requirement for information contained in brochures, commercial catalogs, patents literature and scientific articles with the aim of extracting trends, statistics, emerging technologies and unresolved problems. The novelty proposed in this work consists in proposing a technique that integrates the technical approach just explained with an estimate of the investments in economic terms in order to establish how it integrates into the market potential.
Despite the many steps taken to improve the market potential, it remains today a tool that requires time and a large economic investment, especially if integrated with market research, often costly and time consuming. To overcome these limitations, at least partially, the article proposes a method to automate the estimation of the importance of each requirement, or at least those for which information is available in the various document sources.
The article presents an overview of market potential techniques in Sect. 2. In Sect. 3, it illustrates the methodological proposal to retrieve the state of the art and the way of proceeding conducted in this study. After, in Sect. 4, an example of the methodology through a case study is provided. In closing, Sect. 5, the conclusion.
2 Market Potential Techniques
Among the various approaches used to evaluate the market potential, a technique consists in the evaluation of a series of customer needs and requirements. These approaches are able to define customer needs or requirements, with a structured procedure to translate them into technical parameters and plans to produce products that essentially meet those needs. Benchmarking is one of the first form of structured product development. Products are compared with industry bests from other companies and improvements are planned to cover possible gaps or to overcome competitor’s performances. In particular, satisfaction is a measure of how products and services supplied by a company meet or surpass customer expectation. In a scale from 0% to 100%, 0% is the absence of the feature or great dissatisfaction, 100% is maximum satisfaction. The aforementioned definitions are given to experts before the interviews for the evaluation (Fig. 1).

Example of market potential graphical analysis
As shown in the example reported in the figure above, in which it is shown a market potential graph, the product that own the greater market potential is the product that presents the combination of greater importance levels and lower satisfaction levels among the various requirements treated.
3 Proposal: Semantic Analysis and Documents Preparation
The punctual search for information through combinations of keywords represents an established fact [8], however in the last few years the business intelligence tools have made important steps forward, allowing us to hypothesize their use for delicate operations like these.
In the last years, in fact, thinking of basing a decision on a chart was quite risky. Business intelligence could help suggesting where to go for targeted research and punctual research.
The advent of semantics has transformed the potential of research, allowing us to obtain levels of precision in research that were unthinkable until now. The basic idea is to exploit this technology to produce graphics with high granularity and high precision, which can be used as quantitative comparison tools [9].
The process cannot be fully automated and still requires different expertise.
Step 1. First of all, an attempt is made to create the pool with maximum recall, extracting by content analysis tools the basic concepts in a fast and efficient way. This first screening helps to enter the subject, to find connections that are not obvious even for experts in the sector and helps not to lose potential requirements to be evaluated in the market potential that may not have come up in a preliminary planning (Fig. 2).

Representation of the filters present on the software framework used to conduct the analysis
As it can be seen from the figure, by selecting a parameter it is possible to find all the correlations between the features, thus deducing dependency links and non-obvious relationships.
All information from this pool can be visualized in dashboard with automatic graphs.
Step 2. The second step is to precisely define the pool that serves to evaluate each requirement. The pool will not necessarily be the same for each requirement. The semantic analysis is calibrated to identify only the features that are related to this pool.
The more complete the pattern network, the more reliable the final evaluation will be. Each requirement can be composed from a list of patterns that can be taken from, for instance: type of product, type of material, objective to be achieved, problem, parameter to be measured, parameter to be improved, product-proof, objects of a specific function, functions that the product receives, etc.
Compared to a search by keywords, the logic of constructing the result is reversed. In the first case we start with a very inaccurate result and manually clean up to obtain the desired precision, while with semantics we start from a precise search and add gradually many requests that could contain that information.
Special algorithms allow then to take almost similar concepts present in the different groups almost automatically.
In some cases, a manual refinement is still necessary, or a combination of the two techniques, but the fact of being able to work with semantics offers the undisputed advantage of almost always working with pertinent documents, allowing a much more effective degree of information acquisition and also much faster. Browsing for good documents also offers the possibility of creating a sector thesaurus with far fewer steps than searching for keywords.
Step 3. The third step consists in the creation of an infographic to be delivered to the evaluator during the audit carried out. This analysis can be totally qualitative or, if who performs the analysis is sufficiently skilled in the field, it is possible to set quantitative criteria to suggest to the evaluator a first numerical result.
Step 4. As for the final step, the audit is replicated for all the requirements involved in the analysis. Then the average of all is calculated and the market potential chart is realized.
4 Case Study on Aerogel Panel for Civil Application
As a means to test the method proposed in this work, the authors have considered the extraction in full text (i.e. title, abstract, description, claims and priority dates) regarding the whole patent set concerning the technology Aerogel. The technology itself is well enough developed as a result of work over the past decade by an international community of researchers. Several extensive substantial markets appear to exist for aerogels as thermal and sound insulators, if production costs can keep prices in line with competing established materials.
Step 1. The authors querying the worldwide patent database in order to interrogate scientific literature. The goal is to extract the largest set of documents with the aim to study the problem in a complete and exhaustive way. According to author’s strategies, all sematic networks among words has been extracted along with the properties, functions, type, elements, market and technology applications in order to completely rebuild the technology being investigated.
The query is “AEROGEL OR AERO?GEL OR ((FROZEN OR SOLID OR BLUE) 1D SMOKE) OR (SOLID 1D CLOUD)/TI/AB/IW/TX” according to Orbit patent database syntax and producing a pool of 47593 results.
A more specific pool add “(PANEL? OR BOARD+) TI/AB/IW/TX” in full text according to Orbit Database syntax in order to limit the field of application to building panels (331 patents).
Requirements Selection Phase with Experts in the Field.
In this case study, we consider Aerogel application related to panels for construction. Insulation with the highest performance and durability is chosen with aerogel insulating materials. Their use ensures maximum protection against winter cold, summer heat and humidity. The product range includes rigid and flexible mattresses, panels, coupled, suitable for the most diverse applications. Different coating characteristics, size and thickness make these innovative insulators the most advanced solution for the insulation of roofs, walls, facades, floors and thermal bridges. They are designed to meet the multiple requirements of building insulation applications for new buildings and restoration. The unique properties that characterize them make them indispensable in realizations that require maximum thermal performance with minimum thickness. The very low thermal conductivity, flexibility, compressive strength, hydrophobicity, breathability and ease of use make it the best thermal insulation currently available on the market, effectively representing the last frontier in thermal insulation (Fig. 3).

List of the requirements of this study
Step 2. Any requirement is analyzed in detail by defining a specific pool of reference documents. In order to create the best pool of documents, a semantic based strategy is introduced. For instance, if we look for information related to the “fire proof” requisite, we can use many different patterns dealing with:
-
parameters to be improved (i.e. improve heat resistance),
-
the class of proof/resistant (i.e. blaze, ignition, overheating, burning, flame, fire-proof/resistant)
Another set of pertinent documents can be provided selecting all couples dealing with fire concept from a list of verb + object automatically extracted by the semantic parser (as reported in Table 1).
From that list for example we can analyze, for instance, patents containing the couple “Reduce temperature, insulate heat, Impregnate fabric, Coat surface, Coat substrate, Coat layer, Coat slurry, Coat fabric, Coat coating, Block radiation, Block heat radiation, reflect light, reflect radiation, Protect layer, Resist temperature, Resist heat” (Table 2).
The sum of all these combinations constitutes the pool of all the relevant patents of the dataset for any specific requirement.
Step 3. From the above mentioned patent dataset, we proceed now to understand and estimate the value of the importance (in terms of R&D investments).
The requirements that will be evaluated are:
-
Patent density/numerosity: the number of patents applications during the years.
-
Relevance: number of relevant patents
-
Investment trend: This graph illustrates the evolution of applications over time, indicating the dynamics of inventiveness of the portfolio studied.
-
Number of patent families and global distribution: size of the applicants’ portfolios in the patent pool analyzed. This data is a good indicator of the level of inventiveness of the active players (Fig. 4).
Fig. 4. 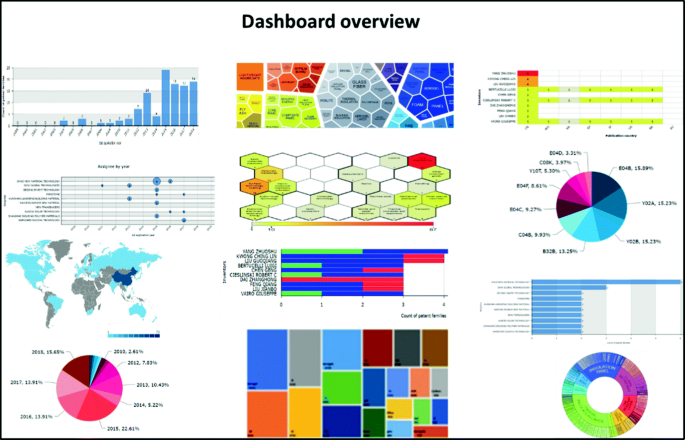
Example of Infographic representation for the requirement monitoring
-
Competitors analysis: differentiation between dead and living patents
-
Legal status: differentiation between dead and living patents

Step 4. In some cases it is easy to understand the value to be given, in others it is necessary to compare with the graphs found for other requirements. The final evaluation is always subjective, but the 360° vision in the form of concise graphs and quantitative assessment helps to make more objective decisions. Once importance is fixed, marketing area and sales managers are interviewed for evaluating also satisfaction score.
The evaluation of importance and satisfaction is then replicated for all the requirements involved in the analysis. There are as many evaluations as there are participants. In the end, it gives an average and creates the final ranking and the market potential chart is realized.
5 Conclusion
This study proposes a method for the study of the market potential based on an automatic estimation of the importance of each requirement, or at least those for which information is available in the various document sources. The basic idea is to use this technology to produce graphics granularity and high precision thanks to the implementation of semantics, which can be used as quantitative comparison tools. Compared to a search by keywords, the logic of constructing the result is reversed, in the first case we start from a very inaccurate result and manually clean up to obtain the desired precision, while with semantics we start from a precise search and we add so many researches that could contain that information. Special algorithms allow then to take almost automatic analogous concepts present in the different groups. In some cases, it is still necessary a manual finishing, or a combination of the two techniques, but the fact that we can work with semantics offers the undisputed advantage of working almost always with pertinent documents, allowing a degree more effective and also much faster information acquisition. Browsing for good documents also offers the possibility of creating a sector thesaurus with far fewer steps than searching for keywords. In the end, the methodology provides infographics in order to have a clear picture in the most concise way.
References
Livotov, P.: Using patent information for identification of new product features with high market potential. Procedia Eng. 131, 1157–1164 (2015)
Kostoff, R.N., Stump, J.A., Johnson, D., Murday, J.S., Lau, C.G., Tolles, W.M.: The structure and infrastructure of the global nanotechnology literature. J. Nanoparticle Res. 8(3–4), 301–321 (2006)
Litvin, S.: Business to Technology – new stage of TRIZ development. In: Proceedings of the TRIZ Future Conference 2005, Graz, 16–18 November 2005, pp. 205–206. Leykam Buchverlag (2005). ISBN 3-7011-0057-8
Petrov, V.: Laws of development of needs. In: Proceedings of the TRIZ Future Conference 2005, Graz, 16–18 November 2005, pp. 195–204. Leykam Buchverlag (2005). ISBN 3-7011-0057-8
Souili, A., Cavallucci, D., Rousselot, F., Zanni, C.: Starting from patent to find inputs to the Problem Graph model of IDM-TRIZ. In: Proceedings of the 11th TRIZ Future Conference – Systematically Innovating for Sustainable Competitiveness, Dublin, 2–4 November 2011, pp. 177–190, 481p. (2011). ISBN 978-0-9551218-2-1
Cascini, G., Russo, D.: Computer-aided analysis of patents and search for TRIZ contradictions. Int. J. Prod. Dev. 4(1/2), 52–67 (2007)
Daim, T.U., Rueda, G., Martin, H., Gerdsri, P.: Forecasting emerging technologies: use of bibliometrics and patent analysis. Technol. Forecast. Soc. Chang. 73(8), 981–1012 (2006)
Moehrle, M., Geritz, A.: Developing acquisition strategies based on patent maps. In: Proceedings of the 13th International Conference on Management of Technology. R&D Management, Washington, pp. 1–9 (2004)
Russo, D., Duci, S.: Supporting decision making and requirements evaluation with knowledge search and problem solving. Procedia CIRP 39, 132–137 (2016)
Author information
Authors and Affiliations
Corresponding author
Editor information
Editors and Affiliations
Rights and permissions
Copyright information
© 2019 IFIP International Federation for Information Processing
About this paper

Cite this paper
Russo, D., Spreafico, C., Spreafico, M. (2019). Patent Based Method to Evaluate the Market Potential of a Product. In: Benmoussa, R., De Guio, R., Dubois, S., Koziołek, S. (eds) New Opportunities for Innovation Breakthroughs for Developing Countries and Emerging Economies. TFC 2019. IFIP Advances in Information and Communication Technology, vol 572. Springer, Cham. https://doi.org/10.1007/978-3-030-32497-1_3
Download citation
DOI: https://doi.org/10.1007/978-3-030-32497-1_3
Published:
Publisher Name: Springer, Cham
Print ISBN: 978-3-030-32496-4
Online ISBN: 978-3-030-32497-1
eBook Packages: Computer ScienceComputer Science (R0)