
Abstract
While ubiquitous data analytics is a promising approach, analyzing spreadsheets data on tablets is a tedious task due to the limited display size and touch vocabulary. In this paper, we present the design and evaluation of novel interaction techniques relying on the combination of a tablet, holding the data, and a smartphone, used as a mediator between the user and the tablet. To this end, we propose to use stacking gestures, i.e. laying one edge of a smartphone on the tablet screen. Stacking is a cheap, easy to implement and effective way of employing always-available smartphones to improve data analysis on tablets, by augmenting the input vocabulary and extending the display surface. We first explore stacking gestures to delimitate the possible interaction vocabulary and present the manufacturing of a conductive smartphone case. Then, we propose novel stacking-based techniques to perform spreadsheet data analysis, i.e. pivot table creation and manipulation. We evaluate our stacking techniques against touch interaction as provided by current mobile spreadsheet apps. Our studies reveal that some of our interaction techniques perform 30% faster than touch for creating pivot tables.
You have full access to this open access chapter, Download conference paper PDF
Keywords
1 Introduction
Ubiquitous data analytics [9] consists in embedding the analytical process into the environment to make sense of data anywhere and anytime. This type of analytical process is of growing importance as mobile devices and particularly tablets become a professional computing platform [2]. To facilitate data analysis, users usually transform raw data into tables or graphical visualizations such as charts or scatter plots. One of the best-known solution to rapidly generate these data visualizations is pivot table [20, 25], a type of table that combines data by applying a so-called “summary function” such as sorting, averaging or summing. Numerous mobile apps (e.g. Excel [10], QlikView [30], QlikSense [29], Tableau mobile [35]) and web-based systems (Voyager [41]) provide this tool. However, interaction with pivot tables on tablets is still difficult: the small display size (inducing multiple pans and views switching) and, most of all, the limitations of touch interaction (i.e. gestures mostly bound to navigation in the data space) fail at providing a convenient solution to create and adjust pivot tables for data analysis on tablets. Our work thus seeks to broaden the interaction possibilities for data analytics on tablets, by extending the currently available interaction capabilities.
To address this problem, previous approaches explored the use of multi-touch [1, 17, 39] and pen based [21, 27] interaction to extend input degrees of freedom (DoF). However, these approaches do not extend the limited display size of mobile devices. Besides, users have to learn a new multitouch vocabulary, and only active pens can be differentiated from finger touch. Instead, we propose to use an always-available device, the smartphone [32], as a tangible interactor with the tablet, and to employ stacking gestures, i.e. bringing one edge of the smartphone in contact with the tablet screen containing the spreadsheet application. The smartphone constitutes a mediator (as defined in [5]) between the user and the tablet by providing a set of additional tools. The interest is threefold: (1) our stacking gestures do not impede the use of regular touch interaction; (2) touch vocabulary, devoted to navigate data, is augmented with stacking gestures, dedicated to manipulate data; and (3) the initial display area is extended with a second screen, which allows to separate multiple visualizations, such as data spreadsheets, graphs or pivot tables.
In this work, we investigate a concrete use case that illustrates the need of real users (local elected officials) in terms of ubiquitous data analytics. It highlights the need for a novel solution to rapidly generate pivot tables on tablets and lead to the definition of a usage scenario. Then, we explore the comfort and technical feasibility of stacking gestures. Based on these studies, we design and evaluate stacking-based techniques for the two steps of data analysis on spreadsheets (see Fig. 1): first, the selection of a data cell range (required prior to any data manipulation) and second the pivot table creation (a task representative of the data analytics domain [20, 21]). We evaluate these techniques in two different user studies and compare them to the regular touch interactions.

Usage scenario: during a meeting, Jessica uses her smartphone and our stacking-based techniques to rapidly (1) select the data on the tablet, and (2) create a pivot table to generate a chart.
Our contributions are (1) the analysis of the physical and technological feasibility of stacking-based interaction techniques (ITs); (2) the design and evaluation of stacking-based ITs for data selection in spreadsheets on tablets; (3) the design and evaluation of stacking-based ITs to create pivot tables that summarize the previous data.
2 Use Case: Ubiquitous Analytics for Local Authorities
As part of a collaboration with a company developing software solutions for the public administration and local authorities, we conducted a set of semi-guided interviews to analyze the needs of their end-users in terms of interaction techniques for mobile contexts. We focused on one of their most important users, i.e. local elected officials (such as mayors or heads of district authorities). These users rely on a wide variety of mobile devices and they regularly need to access community data (budgets, demography) outside of their desktop environment (e.g. council meetings).
2.1 Interview Protocol and Results
The semi-guided interview focused on the working environment and the main tasks performed by the elected officials. To preserve the form of a free discussion, the questions served only to drive or refocus the discussion. These interviews were conducted with eight elected officials (all men). Their respective communities are composed of 563 to 466.297 habitants and 14 to 69 elected members. The interviewees were familiar with desktop computers as well as conventional mobile devices (7.5 on a scale of 1 to 10). All of them use office suites (spreadsheets and presentation programs). The interview lasted on average 66 min per participant.
Among all the tasks carried out by elected officials, many require the exploration and manipulation of graphical representations of data through charts (budget management, demographic analysis, etc.). For this purpose, elected officials use software such as Microsoft Excel or QlikView [10, 30] in a fixed environment. Although their job requires ubiquitous data analysis, several elected officials reported the lack of suitable and easy to use tools to perform this task on mobile devices: “We use a pre-made dashboard in council meetings. If the pre-made charts are not sufficient, the meeting is adjourned so we can make new ones on a [desktop] computer”. As this requirement was the most frequent outcome of the interviews, we developed with the participants a usage scenario in which elected officials need to perform data analysis on a mobile device.
2.2 Usage Scenario
Before a council meeting, Jessica, an elected official, performs a data analysis on the current year’s city budget, sorted by districts (Fig. 1). Equipped with her professional tablet only, the presentation of her analysis during the council meeting raises questions from other officials concerning the increase of costs for this year. To answer these questions, she needs to perform a new analysis by separating the types of costs for each district, for instance the employees’ salary, the outsourcing cost and the materials cost.
She uses a pivot table [10] to quickly produce a cross-analysis summary, from which a graphical representation is rapidly generated. To this end, she performs a two-step process: (1) select the spreadsheet dataset corresponding to the city budget; (2) create the pivot table by affecting the “district” variable to the table rows, the “types of costs” variable to the table columns, and defining the summary function (e.g. in this case the “average” function, to calculate the average cost of material for each district). While this process is easy and rapid on desktop interfaces, selecting the data on the spreadsheet and configuring the pivot table requires multiple touch manipulations that are quite tedious on tablets (see State of the art section for a detailed description).
This scenario serves as a basis for our work and illustrates the need for a set of interaction techniques to facilitate the use of pivot tables on tablets. Beyond the context of elected officials, such interaction techniques would also be relevant in many other contexts such as building inspection reports, budget meetings, employee’s management, resource management during crisis, etc. Our approach is to employ an always-available device, the smartphone, as an interactor to facilitate interaction with spreadsheets on tablets. We designed and experimentally compared different stacking-based techniques for each of the two steps of pivot table creation: data selection (study 1) and pivot table creation (study 2).
3 State of the Art
In this section, we first summarize the limitations of regular touch interaction with spreadsheets on tablets. Then we review existing approaches for overcoming these limitations by extending input/output interaction capabilities.
3.1 Spreadsheets on Tablets: Current Touch Approaches
Interacting with spreadsheets on tablets usually relies on the direct mapping of a touch gesture (swipe, pinch/spread, tap, double tap) to a specific task (pan, zoom in/out, selection of a single cell, edition) [9, 12]. Any other task requires a combination of these fundamental touch gestures. For example, to select a range of cells (see Fig. 2) (1) the user taps to select a cell, (2) taps on the selected cell anchor, and (3) drags the finger to extend the selected range. Using touch gestures for such a frequent and common task is quite tedious due to the length of the process and the small size of cell anchors. And yet, it is usually followed by even more complex tasks (i.e. filter, generate and configure a chart, calculate sums, etc.): to activate those tasks, the user relies on shortcuts on the title bar, or a menu bar on the top-right corner with dropdown menus, making the overall interaction even longer.

Cells selection: tap on a cell (1), select the anchor (2) and drag to extend the selection (3)
As mobile screen size is limited, displaying icons or menus for the numerous commands results in occlusions; not displaying them results in long browsing through the multiple menus and commands available before reaching the appropriate functionality. To cope with these issues, the following section discusses interaction techniques that have been proposed to extend the classical mobile device input and output interaction capabilities.
3.2 Extending Interaction Capabilities on Tablets
Multimodal Interaction for Tablets.
Multi-touch gestures based on chords [1, 37, 39], consecutive taps [16, 17] or bimanual interaction [11] have been explored to extend the touch vocabulary. Using speech in combination with a tactile device for querying a data set [36] also extends input possibilities. Mid-air interaction techniques located around the device [2, 15] have been considered to organize menus or to manipulate the app data (e.g. manipulate a 3D object). In these approaches, tablet output capabilities are not extended and may even be reduced to provide a dedicated feedback for supporting the use and memorization of these modalities.
Combining pen+touch for spreadsheets manipulation on tablets has also been explored to enhance the access to multiple features (edit a cell, copy-paste data, navigate in a sheet and format/color a cell) [27] and for creating meaningful charts faster and easier through the manipulation of pivot tables [21]. Nonetheless, these two approaches require a dedicated pen device (to differentiate it from of a finger touch), and parallel viewing of raw data and graphical rendering is still limited.
Tangible UIs such as MagGetz [19] propose to manipulate several interactors which can be bound to specific actions like controlling a slider or pushing an app button. Tangible interaction usually requires dedicated objects that have to be carried on, and may be less convenient in a mobile context.
Multi-display Interaction Around Tablets.
Compared to the previous approaches, multi-display interaction has the advantage of extending at the same time input and output. Combining tablets allows for example to distribute visualization views on multiple devices, while extending input capabilities through the use of the various touchscreens and the spatial awareness of each other [23, 43]. A less cumbersome alternative consists in exploring how to take advantage of the smartphone position and movement around a tablet. It has been used for example to explore a graphical representation displayed on the tablet as in Thaddeus [42] or to trigger actions (pie-menu selection, drawing tool activation) as in BATMAN [28]. However, these approaches rely on external sensing systems to track the smartphone position around the tablet, which constrains the use of such techniques outside lab (i.e. equipped) environments.
Authors have also explored the use of a smartwatch to extend the touchscreen vocabulary [8]. However its benefits are counterbalanced by the size of the watch screen, restricting its role to being a complementary device [18], used mostly for providing feedback or command shortcuts.
Multi-display Stacking.
Multi-display stacking, i.e. when one display (called support) detects the presence of another device (called interactor), offers the advantage of not requiring any external sensor. For example, in THAW [24], the computer screen displays a specific pattern which can be detected by the smartphone screen. This pattern allows the smartphone to track its position with regards to the computer screen. An embedded IMU is used to detect its orientation. As a result, the smartphone can be used as a magic lens or directly as a tangible object on the application. In Phonetouch [33, 34], a smartphone corner stack can be detected by a tactile table using a combination of sensors (smartphone accelerometers and touch interaction on the table). In this case, the smartphone is used to transfer data between the smartphone and the tablet, to display private feedback, or as a tangible interaction tool. In ACTUI [26] the smartphone is equipped with a copper shell (with a specific pattern on its edge). The tablet screen can then detect and track the smartphone position and orientation. In this case, the smartphone is used to explore the third dimension of a 2D model displayed on the tablet screen. Our approach is based on a similar technical tracking solution.
These works provide concrete technological solutions to facilitate the detection of stacking gestures. They also propose specific usage scenarios taking advantage of the stacking properties in terms of (1) additional screen and (2) extended interaction vocabulary. In this paper we explore in a more systematic manner the design space of stacking gestures. We also propose and evaluate a new set of stacking techniques for data analysis on tablets.
4 Stacking Gestures: Comfort and Technical Feasibility
As a first step in our work on how to use stacking to facilitate data analysis on tablets, we conducted an exploratory study of stacking gestures. We first identified the dimensions of stacking gestures, and then conducted a preliminary study that aims to discard uncomfortable gestures. Based on this analysis we developed a running prototype.
4.1 Stacking Gestures Dimensions
In our context, stacking consists in bringing a smartphone in contact with a tablet screen, which detects it. Three major aspects characterize stacking gestures:
-
Stacked surface: corresponds to the edge or corner of the smartphone detected by the tablet. Although the front and rear faces of the smartphone could also be stacked, they would occlude an important part of the tablet screen.
-
Holding hand: describes which hand holds the smartphone. Given our usage scenario (cf. Sect. 2.2), the user holds the smartphone with the dominant hand, as a tangible and tactile interactor, while the tablet lays on a table. Touch gestures on the tablet and smartphone screens can be performed with the non-dominant hand. We leave the study of stacking gestures on a handheld tablet while standing up for future work.
-
Types of gestures: defines the possible user input gestures. With the smartphone, the user can stack (i.e. lay a smartphone edge/corner on the tablet screen) and unstack (i.e. lift up the smartphone). Once stacked, four physical manipulations are possible (see Fig. 3): translation of the smartphone on the tablet screen (A); flat rotation of the smartphone on the tablet screen (B); tilt of the smartphone around the stacked edge, which stays in contact with the tablet screen (C); and corner rotation of the smartphone (D). Finally, touch gestures (tap, drag or pinch/spread) may be used on both devices. As a result, once stacked, the user can perform a set of touch, physical or compound (i.e. physical then touch) gestures.
Fig. 3. 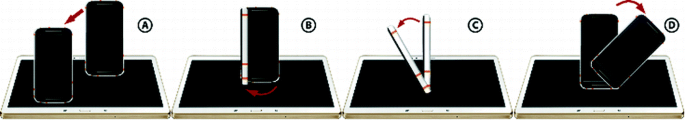
Stacking physical gestures: (A) translation, (B) flat rotation, (C) tilt, and (D) corner rotation

4.2 Preliminary Study on Stacking Gestures Comfort
Stacking requires the user to hold a smartphone and move it on the tablet screen. As this may seem unnatural at first, we decided to assess the comfort of stacking gestures through a preliminary study and discard the most uncomfortable ones. We used a 10.5″ Samsung Galaxy tab S tablet and a 5″ Galaxy S4 smartphone (both devices were switched off). Six participants (age = 26.4, SD = 1.67, 2 females) performed a set of stacks in different orientations (e.g. portrait or landscape mode, screen facing the user or partially rotated) followed by a touch, physical or compound (physical then touch) gesture. The participants rated the comfort of each gesture using a 5-points Likert scale. Touch gestures on the smartphone were performed in two different ways: with the hand holding the smartphone or with the other hand (bi-manually). We did not study touch gestures on the tablet, as they are independent from the stacking gesture.
Regarding all touch gestures (unimanual and bimanual), tap and drag gestures were largely considered comfortable (95.83% and 87.5% respectively rated 3 or above). Pinch/spread were overall deemed uncomfortable (rated 1 or 2), especially when performed with one hand (in 47.9% of the trials). Concerning physical gestures, results reveal that the Translation gesture was deemed comfortable (rated 3 or above) in 87.8% of the trials. All the other physical gestures revealed some level of discomfort. Indeed, rotation was found uncomfortable (rated 1 or 2 in 37.5% of the trials) in some orientations. Tilting around a corner was deemed uncomfortable in 29.2% of the trials. The compound gestures were considered uncomfortable (rated 1 or 2) in 38.9% on the trials, especially when a pinch/spread was required (rated 1 or 2 in 69.8% of these trials).
Based on these results we decided to use only Translation gestures and Tap/Drag touch input (unimanual and bimanual), as these were deemed comfortable. Results also revealed that the smartphone should be in portrait mode: this means that only the bottom edge of the smartphone is stacked.
4.3 Stacking Prototype Implementation
To implement these translation gestures, we needed a prototype capable of detecting the smartphone bottom edge position, orientation and translation on the tablet screen. To create this prototype, we used a similar approach to CapStones and CapTUI [3, 7]. We 3D-printed a smartphone case and covered its back with copper foil (0.1 mm thickness), extended through three copper strips on every edge of the device (Fig. 4 - Left). The tablet detects these three strips (5–6 mm width) as three simultaneous touch events and generates a stack event. We choose to use three strips to detect the orientation of the smartphone on the tablet screen because there is no common touch gesture requiring three simultaneous aligned touch points: hence, our stacking implementation does not impede regular touch interaction. By controlling the relative distance between these strips, we can create a unique pattern for each smartphone edge thus allowing the tablet to recognize which edge of the smartphone is stacked. We also engineered a metallic version of the case with the same patterns on each side (Fig. 4 - Right).

Two versions of the conductive case: a 3D printed version with copper strips (left) and a market-ready metallic version with strips already integrated on the edges (right). These were designed and engineered in collaboration with the technical college Renée Bonnet in Toulouse.
To detect this pattern, we implemented an algorithm in Java on the Android platform. We use the specific distance and alignment of the three detected copper strips to identify the associated edge. Our algorithm detects the smartphone stack as soon as the copper strips are detected on the tablet screen. Our algorithm also handles situations where the smartphone is partially out of the tablet screen: in these cases, we estimate the outside points’ position using the known distance between them.
5 Study 1: Cell Range Selection
Cell range selection is a fundamental task for data analysis as it is required for creating a pivot table, and prior to most of the other spreadsheet commands. A cell range selection defines the range of cells to which a command or function applies.
5.1 Design of Stacking-Based Interaction Techniques for Cells Selection
Selecting a cell range requires two actions, to select the beginning and end of the cell range. Based on a user centered process, we designed three stacking-based techniques to select a cell range, illustrating the combination of two design considerations: number of hands involved (one or two hands), and number of stacking gestures (one or two gestures):
-
“Intersection” combines two successive stacking gestures with the dominant hand. To select a range of cells using the Intersection technique (Fig. 5 – Left), the user simply selects a range of rows and then a range of columns: the intersection between the set of selected rows and columns defines the range of selected cells. These two steps are independent and can be performed in any order. To select columns or rows, the user first stacks the smartphone respectively with a vertical orientation (90° ± 25°) or horizontal orientation (0° ± 25°, Fig. 5 – Left). In both cases, translating the smartphone extends the selected range of rows/columns. To modify a column/row selection, the user can stack again on the first or last selected column/row and translate the smartphone to adjust the selection edge.
Fig. 5. 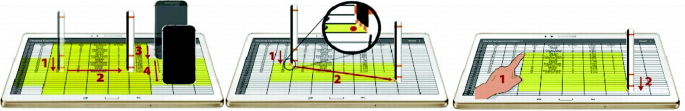
Intersection (left), Stack-and-Drag (center) and Finger Stack (right) selection techniques. (Color figure online)
-
“Stack-and-Drag” uses only one stacking gesture and only the dominant hand. It is based on a stylus metaphor: when stacking the smartphone, the center of the smartphone edge acts as a pointer on the tablet. This pointer is represented by a red dot displayed on the tablet screen 1 cm in front of the smartphone (in the middle of the edge) to prevent occlusion issues (Fig. 5 – Center). To select the cell range, the user stacks the smartphone on the tablet screen. Translating the smartphone extends the current cell range selection (Fig. 5 – Center). To adjust the selection, the user can stack again the smartphone on the top-left or bottom-right cell and translate the smartphone.
-
“Finger Stack” combines a finger-touch with the non-dominant hand and a stacking gesture with the dominant hand. Finger Stack consists in defining the top-left corner of the cell range with a finger touch and the bottom-right corner with the smartphone stack (Fig. 5 – Right). The bottom-right corner is selected using the center of the smartphone edge with the help of the red dot feedback, as in the Stack-and-Drag technique. The selection of the two corner cells can be adjusted with a finger drag and/or smartphone translation gesture. To modify the selection, a touch or stack respectively on the top-left corner or bottom-right corner, allows dragging the selected corner.

A fourth technique based on using two hands and two stack gestures would generate more than two actions, which is not necessary here. For the three proposed techniques, if the desired cell range exceeds the screen limits, the smartphone can be dragged close to the screen edges to trigger a rate-based scroll. The center of the contact edge is used to trigger the scroll mechanism.
Each of the three techniques offers different advantages for cell range selection. Intersection is based on two simple gestures that do not require a precise pointing on a single cell, which is usually small. Stack-and-Drag is similar to a mouse-based selection on desktop spreadsheets but avoids the need to accurately select the tiny anchor on the corner of a selected cell. Finger Stack offers the advantage of a direct selection (a simple touch and stack) without any smartphone translation. We decided to confront these advantages in a controlled study and to compare them with touch interaction.
We found no mobile spreadsheet app providing the required API and software tools to integrate custom interaction techniques and stacking gestures recognition. Therefore, we developed a new spreadsheet app that conforms exactly to the Google Spreadsheet app [12] in terms of interface layout, touch interaction, and cell size (284 × 53 px). We also integrated our three interaction techniques and stacking gestures recognition. The techniques are demonstrated in the adjunct video.
In this study, we compare the performance of the three stacking-based techniques against a baseline, the touch interaction, for a cell range selection task.
5.2 Experimental Protocol
Task.
The participants were asked to select different cell ranges as quickly as possible with each of the four proposed interaction techniques. To limit experimental biases, we deactivated pan/zoom actions as they could have affected the cell range selection strategy with all the techniques. The scroll action was available during a selection.
To represent the diversity of cell ranges, we considered seven categories: complete rows, complete columns, 1 × M (one column, M rows), N × 1 (N columns, one row) and 3 forms of N × M (visual square, horizontal and vertical rectangle). The values for N were 1, 2, 4 or 9 columns, and 1, 7, 13, or 33 rows for M. These values were chosen with regards to the difference between the cells’ height and width. The origin of the cell range was always the cell D6. We evaluated two conditions for each range: one where the range was totally within the screen (i.e. no scroll required) and one where the range exceeded the screen limits (i.e. scroll required).
Each trial corresponded to one range selection and was carried out as follows. A first panel, displayed on the tablet screen, showed the information of the range to select in multiple formats (textual, cell headers and schematic image Fig. 6 – Left). When ready, the user touched a button on the tablet to start the trial and display the spreadsheet. The headers associated with the targeted cell range were red colored. After cell selection, for the selected cells within the targeted range, the headers turned green. Otherwise, they turned yellow (Fig. 6 – Middle), thus highlighting a mistake. Once the target range was correctly selected, an automatic validation of the trial was triggered after 500 ms.

Main screen of the app (left), incorrect selection (middle) and correct selection (right). (Color figure online)
Design.
Our study followed a 4 * 7 * 2 within-subjects design with Interaction technique (Tactile, Intersection, Stack-and-Drag and Finger Stack), Cell range (the seven types described previously) and Scroll (with or without) as factors. The study was divided into four blocks, each block corresponding to one interaction technique (IT). The order of blocks was counterbalanced across participants by means of a 4 × 4 Latin square.
For each block, participants had to perform 14 training trials (half of them with scroll), then 42 range selections (14 conditions × 3 repetitions). The order of trials within a block was randomized. Participants could take a break between each trial and block. We collected a total of 4 IT × 42 trials (7 ranges × 2 scroll conditions × 3 repetitions) × 12 participants = 2016 selections.
Apparatus, Participants and Collected Data.
We used a Samsung Galaxy Tab S (Android 5.1, octa-core 1.9 GHz and 1.3 GHz) with a 10.5″ display (2560 × 1600 px), and a Samsung Galaxy S4 (Android 5.1, quad-core 1.9 GHz) with a 5″ display (1920 × 1080 px). The smartphone was equipped with our conductive case and the tablet was equipped with a plastic screen protection. Our spreadsheet app was installed on the tablet. The user was sitting, holding the smartphone with his/her dominant hand, and the tablet laid on the table in front of him/her.
We recruited 12 participants (5 females), aged 27.7 years on average (SD = 4.7). Six of them had been involved in the preliminary study. They were all right-handed and familiar with mobile devices (7.5 on a 0–9 scale) and desktop spreadsheets (7.0). Only one subject was familiar with spreadsheets on tablets (7.0, compared with 2.1 for the others). The experiment lasted one hour on average.
We measured the time to perform each trial, from the button press to the automatic validation. At the end of each block, we asked the participants to fill a SUS questionnaire [4] and we collected informal feedbacks. Participants were also asked to rate (like/dislike) the interaction techniques on a 7-points Likert scale.
5.3 Results
We chose to rely on estimation techniques with 95% confidence intervals and ratio analysis as recommended by the APA [38]. Ratio is an intra-subject measurement that expresses the effect size (pair-wise comparison) and is computed between each of the geometric means. All CIs are 95% BCa bootstrap confidence interval. For the reader more used to interpret the p-values, a parallel might be drawn with results obtained through the estimation technique and CIs reports (see Fig. 3 in [22]). Scripts used to compute the geometric mean and CIs were used in [40] and are available online [14].
Selection Time.
The results on selection time show a clear difference between the four interaction techniques. Indeed, Finger Stack and Intersection required clearly less time (resp. 6.35 s, CI [5.79, 6.93] and 6.54 s, CI [6.02, 7.3]) than Tactile (7.64 s CI [6.87, 8.94]) and Stack-and-Drag (8.27 s, CI [7.3, 9.46]) (Fig. 7 - left). The intra subject analysis based on the time ratio (Fig. 7 - right) confirms this finding and establishes that trials with Tactile took 19.9% more time than with Finger Stack (ratio = 1.199 and no intersection of the 95% CI with the value 1.0) and 16.1% more time than with Intersection (ratio = 1.161, no intersection with 1.0).

Mean selection time in s (left) and ratio (right) regarding Tactile (95% CI).
This result holds when considering the different cells range categories individually. When analyzing the impact of the Scroll factor (cells range categories involving N = 9 and/or M = 33), results show that when scrolling is required, trials take on average 64% CI [58.8, 69.5] more time for every technique, with no difference among techniques. Thus, our scrolling mechanism did not negatively impact completion time.
Usability and User Preference.
The analysis of the SUS questionnaires clearly establishes a better usability score for Tactile and Intersection techniques, (resp. 85.8, CI [78.3, 91.3] and 82.1, CI [73.5, 87.3]) than for Finger Stack (68.3, CI [58.1, 76.9]) and Stack-and-Drag (52.7, CI [36.7, 63.1]). The general rating of the techniques confirms these results with 11 participants out of 12 who liked (5 and above on a 7-points Likert Scale) Tactile, 10 who liked Intersection, 8 Finger Stack and 5 Stack-and-Drag.
Informal comments reported by the participants are in line with these analyses. Indeed, the Tactile interaction has been described as: “Intuitive, coherent with classical touch gestures” (8/12). However, users found that it is “difficult to aim at the right cell” (10/12). The Intersection technique was qualified as “Simple to use because the dimensions are clearly separated” (9/12). The Finger Stack technique was described as “Practical because the selection is almost immediate” (12/12). The Stack-and-Drag technique is considered “Difficult to manipulate because it is hard to aim the correct cell with the red dot [smartphone pointer]” (9/12).
Conclusion.
The results show that the Tactile interaction takes on average 19.9% more time than Finger Stack and 16.1% more time than Intersection to correctly select a range of data. These results remain valid when performing a scroll. In terms of usability, the stacking-based technique Intersection obtains a SUS score similar to the one obtained for the baseline technique Tactile, using touch interaction only, a score which is higher than for the other techniques. In addition, participants reported very enthusiastic comments about the Intersection technique.
Given these results, we only consider the Intersection and Tactile (as baseline) techniques on the subsequent part of our work on stacking-based techniques for pivot table creation and manipulation.
6 Study 2: Pivot Table Creation
After validating the initial and necessary step of selecting a cell range, we focus on the remaining actions needed to create and manipulate a pivot table to support ubiquitous data analysis. In Excel on a Microsoft Surface tablet, after selecting the desired data (step 1) and pressing on the right menu/sub-menu to insert the pivot table, the app activates a wizard. The wizard is displayed on the right side of the screen, on a secondary tab or on the tab containing the data. The wizard presents the headers of the selected rows and four shelves, representing the four components of a pivot table (Row, Column, Value and Filter [25] – see Fig. 8-C). Each column header can then be dragged and dropped (step 2) on one of the four wizard’s shelves. A touch on the elements in the Value shelf allows changing the summary function using a pop-up window. To filter the elements, a touch on the pivot table opens a specific pop-up. To improve the interaction with pivot table on tablets we designed a set of stacking-based interaction techniques.

Selecting cells (step 1) and affecting them to one Pivot-Table wizard shelf (step 2) using Dual-Screen Touch (A-Top), Stack-and-Touch (A-Bottom), Stack-and-Translate technique (B). The pivot-table wizard as displayed in Excel on the MS-Surface (C).
6.1 Design of Stacking-Based Interaction Techniques for Pivot-Tables
We adopted a user-centered process to design three different stacking-based techniques for controlling a pivot-table creation and edition. These three designs differ in terms of manipulation type:
-
“Dual-Screen Touch”, is based solely on the use of touch interaction on the tablet and on the smartphone. With this technique, a first touch on a column header displayed on the tablet selects the column. Then, the user can insert this data into the wizard by touching a wizard’s shelves on the smartphone (Fig. 8 – A-Top). The data can then be dragged and dropped between the multiple shelves of the wizard. A touch on the elements allows filtering and changing the summary function. A long press on an element removes it from the shelf.
-
“Stack-and-Touch” combines touch interaction on the smartphone screen with stacking on the tablet. This technique is based on stacking the smartphone on the desired column to select it (as in the Intersection technique). After selecting the column, the interaction is the same as with the Dual-Screen Touch technique, i.e. touch on a wizard’s shelves on the smartphone (Fig. 8 – A-Bottom).
-
“Stack-and-Translate” is based on stacking only. When stacking the smartphone on the desired column, the wizard is temporarily replicated on the tablet screen (in addition to the smartphone screen) directly under the stacking position (Fig. 8 – B). To insert a data column into the wizard, the user translates the smartphone in the direction of the desired wizard shelf. Then, the wizard on the tablet screen disappears to prevent occlusions.
The smartphone always displays the pivot table wizard, while the tablet displays the data cells. The initial cell range selection (step 1) is performed using the Intersection technique with the smartphone in the dominant hand (best technique in study 1).
We modified our spreadsheet app running on the tactile tablet to integrate a pivot table wizard displayed on the tablet screen (for the baseline technique): our app strictly conforms to the Excel application on a MS-Surface (tactile interaction, structure and size). In addition, we further extended our app so that the lower part of the same pivot table wizard could be displayed on the smartphone screen (for the stacking-based techniques) and we integrated our three interaction techniques. The techniques are demonstrated in the adjunct video.
To assess the performance of our interaction techniques to create a pivot table, we compared them to the regular touch interaction.
6.2 Experimental Protocol
Task.
The experimental task involved two consecutive steps: selecting a range of cells and then creating one pivot table. Given that results of the first experiment were similar for the different cells range categories, for each trial, participants first had to select a single form of cells range made of 50 rows × 12 columns. The same feedback than in the first study was provided during this step. An automatic validation occurred once the appropriate cells range was selected.
After the selection, participants had to open the pivot table wizard using a menu bar button, on the top-left corner of the tablet for the Tactile technique, and on the smartphone for the stacking-based techniques. Then, they had to fill the shelves of the pivot table wizard according to the given instructions. Each trial consisted in filling one (Value), two (Value and Row), three (Value, Row and Column) or four (Value, Row, Column and Filter) shelves of the wizard with one element. In some trials participants also had to modify the summary function (Sum, Number, Mean).
Participants were asked to complete the task as fast and accurately as possible. The task instructions were displayed on the tablet screen before each trial and on a secondary computer screen during the trial. The instructions consisted of a pivot table wizard already filled with the required elements and configured with a specific summary function. A touch button allowed the user to start the trial. Once the wizard was correctly filled, an automatic validation was triggered after 500 ms.
We used the same dataset as in [21], consisting in movie attributes (e.g. genre, MPAA rating), budget, total gross and review ratings. We trimmed the dataset to 200 rows and 12 columns as in [21].
Design.
Our study followed a 4 * 4 * 2 within-subjects design with Interaction technique (Tactile, Dual-Screen Touch, Stack-and-Touch, Stack-and-Translate), Number of wizard’s Shelves to modify (one, two, three or four) and Summary Function (yes or no) as factors. The study was divided into 4 blocks, each block corresponding to one technique. The order of blocks was counterbalanced across participants by means of a 4 × 4 Latin square.
For each block, participants could perform training trials until they felt ready. Then they performed 24 pivot table creations (8 conditions performed 3 times). The order of trials was randomized. Participants could take a break between each trial and each block. In total, we collected 4 ITs × 8 configurations × 3 repetitions × 12 participants = 1152 trials.
Apparatus, Participants and Collected Data.
We used the same tablet and smartphone than in the previous study. We upgraded both devices to Android 7.1 to run our pivot table code (which required Java 8). We also used a computer screen (16”, 1366 × 768 pixels) to permanently display the instructions during a trial.
We recruited 12 participants (7 females), aged 31.7 years on average (SD = 6.8). Participants were all students of the local university’s computer science department. Two of them took part in study 1, limited to the selection phase (step 1). They were all right-handed and familiar with mobile devices (7.8 on a 0–9 scale), desktop spreadsheets (6.5) and pivot tables (6.3). The experiment lasted 78 min on average.
For each trial, we measured the total completion time, as well as selection and wizard filling times. We logged selection errors (i.e. selecting an incorrect cell range) and assignation errors (i.e. assigning an item to the wrong pivot table shelf or assigning the wrong summary function). At the end of each block, we asked the participants to fill a SUS questionnaire and we collected informal feedbacks. They were also asked to rate their general appreciation of the interaction technique on a 7-points Likert scale.
6.3 Results
The overall interaction is divided into two steps: selection and assignation. Therefore, we report the quantitative measures (time, error) for each step separately.
Selection Time (Step 1).
The results confirm the first experiment measures: on average, selecting the cell range requires more time with the Tactile technique (10.6 s CI [10.2, 10.9]) than with our stacking techniques (9.2 s CI [8.6, 9.7] (Fig. 9 - Left). The intra subject analysis based on the time ratio confirms this finding and establishes that it took on average 14.8% more time (ratio = 1.148 no intersection with 1.0, Fig. 9 - Right) with Tactile than with our stacking-based technique.

Mean selection time in s (left) and ratio (right) regarding Tactile (95% CI).
Assignation Time (Step 2 and 3).
Results strongly establish that assignation (i.e. filling the pivot table wizard shelves with the corresponding elements, Fig. 10) with Stack-and-Translate requires less time (7.3 s, CI [6.9, 7.9]) than with the three other techniques. Results also establish that Dual-Screen Touch (8.3 s, CI [7.8, 8.9]) and Stack-and-Touch (8.7 s, CI [8.3, 9.1]) are similar in terms of assignation time, while Tactile (9.5 s, CI [9.0, 10.0]) requires clearly more time than the three other. These results remain valid for each number of shelves tested (i.e. the techniques relative performance is equivalent for each number of shelves condition). The intra subject analysis based on the time ratio confirms this finding and establishes that it took on average 30.1% more time (ratio = 1.301 no intersection with 1.0) with Tactile than with Stack-and-Translate.

Mean assignation time in s (left) and ratio (right) regarding Tactile (95% CI).
When modifying the summary function of the Value shelf (for instance Sum instead of Mean), assignation time required with the Tactile technique increases by 42.6% CI [32.7, 54.4] whereas it only increases by 14.2% CI [8.6, 21.3] on average for our 3 techniques (individual details in Fig. 11a). We can explain these results by the fact that it is harder to reach the configuration buttons on the tablet when using Tactile than those displayed on the smartphone when using stacking-based techniques.

(A) Percentage of the assignation time increase (95% CI) when modifying the summary function is requested (versus not). (B) Percentage of the trials in which at least one assignation error occurred (95% CI).
Errors.
Given the experimental protocol, there was no possible selection error. Regarding assignment errors, i.e. a column affected to a wrong shelf of the wizard (Fig. 11b), it seems that less errors occurred with Stack-and-Translate (8.3% of trials contained at least one error CI [5.6, 11.5]) and Stack-and-Touch (9.4% of trials CI [6.6, 12.5]) than with Tactile (14.9% of trials CI [11.1, 18.1]) and Dual-Screen Touch (13.5% of trials CI [10.4, 19.1]). With the Tactile technique, in order to affect a column to one shelf of the wizard, the user selects an item with a finger touch in the list of column headers displayed on the upper part of the wizard, as in the Excel application. With the other techniques, the user selects the column through a stacking gesture. We believe that with touch based interaction, the accuracy required to select the item on the list of columns is responsible for the increase of error during the assignment phase.
Usability and Users Preference.
The SUS questionnaires establish a better usability score for Stack-and-Translate (90.4, CI [76.9, 95.4]) and Dual-Screen Touch (80.8, CI [73.3, 87.9]), than Tactile (70.2, CI [63.3, 75.0]) and Stack-and-Touch (73.1, CI [68.5, 76.0]). The general rating of the techniques, collected using a 7-points Likert scale, confirms these results with 11 participants out of 12 who liked (5 and above) Stack-and-Translate, 10 who liked Dual-Screen touch, 9 Stack-and-Touch and 7 Tactile.
Informal participants comments are in line with these analyses. Stack-and-Translate was described as “very simple and very fast” (9/12). The Dual-Screen Touch technique was qualified as “simple and easy to learn” (11/12) although “clicking on the column header is not convenient; I’d like to click on any of the column cells” (9/12). The Stack-and-Touch technique was described as “simpler because the menu on the smartphone is clearer than on the tablet” (7/12). The Tactile technique was considered “really disturbing: […] I can drag it but I often fail to place correctly” (8/12).
Conclusion.
The results from this study first confirm that, even when combined with another task, a cell range selection requires on average 15% more time with the Tactile technique than with the stacking-based techniques, as established in the first experiment. They also establish that filling a pivot table wizard (step 2) with the Stack-and-Translate technique requires less time than the other techniques (7.3 s against 8.3 s for Dual-Screen Touch, 8.7 s for Stack-and-Touch and 9.5 s for Tactile): using the regular Tactile technique to create a pivot-table requires up to 30% more time than using the Stack-and-Translate technique.
In addition, Stack-and-Translate and Dual-Screen Touch obtain better SUS scores than the other techniques, including the Tactile one, and subjective ratings of the techniques largely confirm the positive opinion of the participants towards the Stack-and-Translate technique. When the task (selection + assignation) becomes more complex because the summary function need to be modified after the assignation (i.e. opening the menu “function” and selecting a different summary function – such as Sum), stacking-based techniques performed even better than the Tactile technique: it thus seems that the added display space on the smartphone allows an easy access to more features. These results thus demonstrate the advantages of stacking-based techniques over traditional touch interaction for creating pivot tables.
7 Discussion and Future Work
Benefits of Stacking-Based Interaction for Data Analysis.
Our two studies reveal that the use of stacking-based interaction to manipulate data on mobile devices is more efficient than the current touch interaction provided on spreadsheet apps on tablets. In a first step we demonstrated that cell selection requires 15% more time with the Tactile interaction than with a stacking-based technique; in a second step we established that cell selection and assignation to the pivot table wizard requires on average up to 22% more time with the Tactile technique than with one of the stacking-based techniques. Finally, among stacking-based techniques, the one based only on stacking input (Stack-and-Translate – 7.3 s) requires less time than those using touch only (Dual-Screen Touch – 8.3 s) or a combination of touch and stacking (Stack-and-Touch – 8.7 s).
The physical manipulation of the smartphone allows direct manipulation of the data without interfering with the regular touch gestures, and shortens the interaction path. Furthermore, the use of the smartphone screen to display the pivot table wizard was found convenient and useful (see users’ informal comments). Overall, stacking-based interaction seems well suited to facilitate ubiquitous data analysis on tablets.
Speed Trade-Off for Picking the Smartphone.
Using our stacking-based approach for data analysis initially requires picking up the smartphone and setting it on the tablet, which could raise a speed trade-off for picking the smartphone. However during a lengthy data analysis (municipal councils last on average 2 h), once the smartphone has been positioned, it will only continue to be used, and thus accrue further benefits compared to regular touch interaction. This justifies the trade-off for using the smartphone as the main interactor on the dominant hand: in such conditions our techniques are up to 19.9% and 30.1% faster than touch respectively for cell range selection and pivot table wizard configuration.
Future Work.
In the future, we plan to incorporate in our application further features of pivot table such as the ordering or filtering of elements on the wizard and switching between the pivot table visualizations (chart vs. table representations). These two visualizations could be available on the smartphone screen using a left/right swipe gesture. Once these features will be integrated to our application, we plan to compare our solution to an advanced tactile technique (e.g. based on three-fingers touch). Then we will run a longitudinal study with our targeted users, i.e. elected officers, in a concrete context.
Furthermore, we hope to exploit the whole potential of stacking gestures. While in our initial exploration we unveiled a large stacking vocabulary, made of different types of gestures (physical or touch), we only used a subset of them in our spreadsheet interactions. Enlarging even more the interaction vocabulary with mobile device through stacking should unveil current limitations in other usages. Stacking-based interaction could be valuable for setting up spreadsheet graphs, could be used in overview-detail contexts [31] or to transfer data between devices in a multi-device environment [6, 13].
Regarding long-term usage of stacking-based techniques, since both the tablet and the smartphone are most often laying on the table, we do not expect much fatigue. We did not get any comments on fatigue during our tests that lasted an hour. However, future studies should evaluate this concern.
8 Conclusion
In this paper, we presented different stacking-based techniques to facilitate ubiquitous data analysis on tablets. We explored the available stacking gestures to discard the most uncomfortable ones. Based on these results, we designed a conductive case that allows the detection of the smartphone on the tablet screen. We then proposed stacking-based techniques with the final goal to support data analysis using pivot tables in a two-step approach: first, performing a cell range selection and then creating a pivot table from the previous cell range. We showed that stacking-based techniques are faster than regular touch interaction for cell range selection. Furthermore, we also showed that using the smartphone as a tangible interactor with a complementary touchscreen extends the interaction capabilities of a mobile device in terms in input (stacking-based interaction) and output (complementary screen): in particular, it speeds-up the pivot table creation and manipulation, and is more usable than regular touch interaction.
References
Banovic, N., Li, F.C.Y., Dearman, D., Yatani, K., Truong, K.N.: Design of unimanual multi-finger pie menu interaction. In: Proceedings of the ACM International Conference on Interactive Tabletops and Surfaces (ITS 2011), pp. 120–129. ACM, New York (2011). https://doi.org/10.1145/2076354.2076378
Baudisch, P., Holz, C.: My new PC is a mobile phone. XRDS: Cross-roads 16(4), 36–41 (2010)
Blagojevic, R., Plimmer, B.: CapTUI: geometric drawing with tangibles on a capacitive multi-touch display. In: Kotzé, P., Marsden, G., Lindgaard, G., Wesson, J., Winckler, M. (eds.) INTERACT 2013. LNCS, vol. 8117, pp. 511–528. Springer, Heidelberg (2013). https://doi.org/10.1007/978-3-642-40483-2_37
Brooke, J.: SUS - A quick and dirty usability scale. Usability Eval. Ind. 189(194), 4–7 (1996)
Brudy, F., Houben, S., Marquardt, N., Rogers, Y.: CurationSpace: cross-device content curation using instrumental interaction. In: Proceedings of the ACM Conference on Interactive Surfaces and Spaces, pp. 159–168. ACM (2016). https://doi.org/10.1145/2992154.2992175
Chen, N., Guimbretière, F., Sellen, A.: Graduate student use of a multi-slate reading system. In: Proceedings of the SIGCHI Conference on Human Factors in Computing Systems (CHI 2013), pp. 1799–1808. ACM, New York (2013). https://doi.org/10.1145/2470654.2466237
Chan, L., Müller, S., Roudaut, A., Baudisch, P.: CapStones and ZebraWidgets: sensing stacks of building blocks, dials and sliders on capacitive touch screens. In: Proceedings of the SIGCHI Conference on Human Factors in Computing Systems (CHI 2012), pp. 2189–2192. ACM, New York (2012). https://doi.org/10.1145/2207676.2208371
Chen, X.A., Grossman, T., Wigdor, D.J., Fitzmaurice, G.: Duet: exploring joint interactions on a smart phone and a smart watch. In: Proceedings of the SIGCHI Conference on Human Factors in Computing Systems (CHI 2014), pp. 159–168. ACM, New York (2014). https://doi.org/10.1145/2556288.2556955
Elmqvist, N., Irani, P.: Ubiquitous analytics: interacting with big data anywhere, anytime. Computer 46(4), 86–89 (2013)
Excel on Android: https://play.google.com/store/apps/details?id=com.microsoft.office.excel&hl=fr. Accessed 20 Sept 2018
Goguey, A., Casiez, G., Pietrzak, T., Vogel, D., Roussel, N.: Adoiraccourcix: multi-touch command selection using finger identification. In: Proceedings of the 26th Conference on l’Interaction Homme-Machine (IHM 2014), pp. 28–37. ACM, New York (2014). https://doi.org/10.1145/2670444.2670446
Google Spreadsheet on Android. https://play.google.com/store/apps/details?id=com.google.android.apps.docs.editors.sheets&hl=fr. Accessed 18 Sept 2017
Hamilton, P., Wigdor, D.J., Conductor: enabling and understanding cross-device interaction. In: Proceedings of the SIGCHI Conference on Human Factors in Computing Systems (CHI 2014), pp. 2773–2782. ACM, New York (2014). https://doi.org/10.1145/2556288.2557170
INRIA - AVIZ Group: R Macros for data analysis. www.aviz.fr/reliefshearing
Hasan, K., Ahlström, D., Irani, P.: Ad-binning: leveraging around device space for storing, browsing and retrieving mobile device content. In: Proceedings of the SIGCHI Conference on Human Factors in Computing Systems (CHI 2013), pp. 899–908. ACM, New York (2013). https://doi.org/10.1145/2470654.2466115
Heo, S., Gu, J., Lee, G.: Expanding touch input vocabulary by using consecutive distant taps. In: Proceedings of the SIGCHI Conference on Human Factors in Computing Systems (CHI 2014), pp. 2597–2606. ACM, New York (2014). https://doi.org/10.1145/2556288.2557234
Heo, S., Jung, J., Lee, G.: MelodicTap: fingering hotkey for touch tablets. In: Proceedings of the 28th Australian Conference on Computer-Human Interaction (OzCHI 2016), pp. 396–400. ACM, New York (2016). https://doi.org/10.1145/3010915.3010993
Horak, T., Badam, S.K., Elmqvist, N., Dachselt, R.: When David meets Goliath: combining smartwatches with a large vertical display for visual data exploration. In: Proceedings of the 2018 CHI Conference on Human Factors in Computing Systems, p. 19. ACM, April 2018
Hwang, S., Ahn, M., Wohn, K.: MagGetz: customizable passive tangible controllers on and around conventional mobile devices. In: Proceedings of the 26th Annual ACM Symposium on User Interface Software and Technology (UIST 2013), pp. 411–416. ACM, New York (2013). https://doi.org/10.1145/2501988.2501991
Jelen, B., Alexander, M.: Pivot Table Data Crunching: Microsoft Excel 2010, 1st edn. Que Publishing Company, London (2010)
Jo, J., L’Yi, S., Lee, B., Seo, J.: TouchPivot: blending WIMP & post-WIMP interfaces for data exploration on tablet devices. In: Proceedings of the 2017 CHI Conference on Human Factors in Computing Systems (CHI 2017), pp. 2660–2671. ACM, New York (2017). https://doi.org/10.1145/3025453.3025752
Krzywinski, M., Altman, N.: points of significance: error bars. Nat. Methods 10(10), 921–922 (2013)
Langner, R., Horak, T., Dachselt, R.: VisTiles: coordinating and combining co-located mobile devices for visual data exploration. IEEE Trans. Vis. Comput. Graph. 24(1), 626–636 (2018)
Leigh, S., Schoessler, P., Heibeck, F., Maes, P., Ishii, H.: THAW: tangible interaction with see-through augmentation for smartphones on computer screens. In: Proceedings of the Ninth International Conference on Tangible, Embedded, and Embodied Interaction (TEI 2015), pp. 89–96. ACM, New York (2015). https://doi.org/10.1145/2677199.2680584
Microsoft Office Support: Create a PivotTable to Analyze Worksheet Data. https://support.office.com/en-gb/article/create-a-pivottable-to-analyze-worksheet-data-a9a84538-bfe9-40a9-a8e9-f99134456576Accessed 22 Sept 2019
Li, M., Kobbelt, L.: ACTUI: using commodity mobile devices to build active tangible user interfaces. In: Proceedings of the 17th International Conference on Human-Computer Interaction with Mobile Devices and Services Adjunct (MobileHCI 2015), pp. 592–597. ACM, New York (2015). https://doi.org/10.1145/2786567.2792895
Pfeuffer, K., Hinckley, K., Pahud, M., Buxton, B.: Thumb + pen interaction on tablets. In: Proceedings of the 2017 CHI Conference on Human Factors in Computing Systems (CHI 2017), pp. 3254–3266. ACM, New York (2017). https://doi.org/10.1145/3025453.3025567
Piazza, T., Fjeld, M., Ramos, G., Yantac, A.E., Zhao, S.: Holy smartphones and tablets, Batman!: mobile interaction’s dynamic duo. In: Proceedings of the 11th Asia Pacific Conference on Computer Human Interaction (APCHI 2013), pp. 63–72. ACM, New York (2013). https://doi.org/10.1145/2525194.2525205
QlikSense. https://www.qlik.com/fr-fr/products/qlik-sense. Accessed 20 Sept 2018
QlikView. https://www.qlik.com/fr-fr/products/qlikview. Accessed 20 Sept 2018
Saidi, H., Serrano, M., Dubois, E.: Investigating the effects of splitting detailed views in Overview + Detail interfaces. In: Proceedings of the 18th International Conference on Human-Computer Interaction with Mobile Devices and Services (MobileHCI 2016), pp. 180–184. ACM, New York (2016). https://doi.org/10.1145/2935334.2935341
Santosa, S., Wigdor, D.: A field study of multi-device workflows in distributed workspaces. In: Proceedings of the 2013 ACM International Joint Conference on Pervasive and Ubiquitous Computing, Zurich, Switzerland, 08–12 September 2013. https://doi.org/10.1145/2493432.2493476
Schmidt, D., Chehimi, F., Rukzio, E., Gellersen, H.: PhoneTouch: a technique for direct phone interaction on surfaces. In: Proceedings of the 23rd Annual ACM Symposium on User Interface Software and Technology (UIST 2010), pp. 13–16. ACM, New York (2010). https://doi.org/10.1145/1866029.1866034
Schmidt, D., Seifert, J., Rukzio, E., Gellersen, H.: A cross-device interaction style for mobiles and surfaces. In: Proceedings of the Designing Interactive Systems Conference (DIS 2012), pp. 318–327. ACM, New York (2012). https://doi.org/10.1145/2317956.2318005
Tableau Software. https://www.tableau.com/fr-fr. Accessed 20 Sept 2018
Srinivasan, A., Lee, B., Stasko, J.: Facilitating spreadsheet manipulation on mobile devices leveraging speech. In: MobileVis 2018 Workshop at CHI 2018, Montreal, QC, Canada, 21 April 2018 (2018). https://mobilevis.github.io/
Uddin, Md.S., Gutwin, C.: Rapid command selection on multi-touch tablets with single-handed handmark menus. In: Proceedings of the 2016 ACM on Interactive Surfaces and Spaces (ISS 2016), pp. 205–214. ACM, New York (2016). https://doi.org/10.1145/2992154.2992172
VandenBos, G.R. (ed.): Publication Manual of the American Psychological Association, 6th edn. American Psychological Association, Washington, DC (2009). http://www.apastyle.org/manual/
Wagner, J., Lecolinet, E., Selker, T.: Multi-finger chords for hand-held tablets: recognizable and memorable. In: Proceedings of the SIGCHI Conference on Human Factors in Computing Systems (CHI 2014), pp. 2883–2892. ACM, New York (2014). https://doi.org/10.1145/2556288.2556958
Willett, W., Jenny, B., Isenberg, T., et al.: Lightweight relief shearing for enhanced terrain perception on interactive maps. In: Proceedings of the 33rd ACM Conference on Human Factors in Computing Systems (CHI 2015) (2015). https://doi.org/10.1145/2702123.2702172
Wongsuphasawat, K., Moritz, D., Anand, A., Mackinlay, J., Howe, B., Heer, J.: Voyager: exploratory analysis via faceted browsing of visualization recommendations. IEEE Trans. Visual. Comput. Graph. (TVCG) 22(12), 649–658 (2016)
Woźniak, P., Lischke, L., Schmidt, B., Zhao, S., Fjeld, M.: Thaddeus: a dual device interaction space for exploring information visualisation. In: Proceedings of the 8th Nordic Conference on Human-Computer Interaction: Fun, Fast, Foundational (NordiCHI 2014), pp. 41–50. ACM, New York (2014). https://doi.org/10.1145/2639189.2639237
Wozniak, P., Goyal, N., Kucharski, P., Lischke, L., Mayer, S., Fjeld, M.: RAMPARTS: supporting sensemaking with spatially-aware mobile interactions. In: Proceedings of the 2016 CHI Conference on Human Factors in Computing Systems (CHI 2016), pp. 2447–2460. ACM, New York (2016). https://doi.org/10.1145/2858036.2858491
Author information
Authors and Affiliations
Corresponding author
Editor information
Editors and Affiliations
Rights and permissions
Copyright information
© 2019 IFIP International Federation for Information Processing
About this paper

Cite this paper
Perelman, G., Serrano, M., Bortolaso, C., Picard, C., Derras, M., Dubois, E. (2019). Combining Tablets with Smartphones for Data Analytics. In: Lamas, D., Loizides, F., Nacke, L., Petrie, H., Winckler, M., Zaphiris, P. (eds) Human-Computer Interaction – INTERACT 2019. INTERACT 2019. Lecture Notes in Computer Science(), vol 11749. Springer, Cham. https://doi.org/10.1007/978-3-030-29390-1_24
Download citation
DOI: https://doi.org/10.1007/978-3-030-29390-1_24
Published:
Publisher Name: Springer, Cham
Print ISBN: 978-3-030-29389-5
Online ISBN: 978-3-030-29390-1
eBook Packages: Computer ScienceComputer Science (R0)