
Abstract
This chapter deals with an implementation of advanced vision technologies for contactless parts of product inspection and automatic object identification using RFID during the assembly process in experimental assembly line to improve quality control over the assembly of the different product parts. Both, vision technologies and UHF RFID system are used for digitization of quality control, and automatic identification for the future world of the Internet of Things (IoT). Moreover, all quality control data are stored in Cloud Platform for the purpose of data analysis and visualization. Subsequently, digital twin of quality control system is generated from its 3D model and transformed into virtual reality device for remote monitoring of quality control.
You have full access to this open access chapter, Download chapter PDF
1 Introduction
The main scope of this chapter is to present experimental results from the implementation of selected vision technologies and a UHF RFID system for automatic identification and inspection of product parts before and after the assembly operations. Digitization of quality control processes requires a new approach to how data is captured, stored, analyzed, and used. The presented approach is based on maximizing data collection from the mentioned technologies integrated into the assembly process. For the purpose of data storage and analysis it is proposed that Big Data technologies are based on Cloud Platforms. The goal of quality control is to prevent components’ faults and to identify any defects after the components have been assembled.
The object of quality control is the rapid prototyping feeder mechanism with stepper motor, plastic, and mounting parts, including 10 individual parts positioned on the assembly fixture. The experimental inspection and identification system consists of a conveyor belt with PLC control system and servomotor to be able to fluently change conveyor speed depending on production process status. The problem-solution starts with a selection of suitable contactless technologies for fast data mining and digitization in line with the Industry 4.0 concept. These technologies are described in Sect. 11.4.2. The vision inspection system consists of 3 separate modules. The first one is aimed at checking shapes of components, the second one serves to measure components’ dimensions, and the last one is used for component surface “macro” inspection. The RFID system consists of two power adjustable circular/vertical antennas and different UHF tags (labels and transponders). Cloud Platforms are used for data analysis and visualization (data mining). Some of them are open source and are suitable for Fog computing (Thinger.IO). The others are commercial-based platforms for Cloud computing (IBM Watson IoT, Microsoft Azure IoT, Siemens MindSphere). We chose Cloud Platform Siemens Mindsphere, because of compatibility with the control system used.
In order to create a digital twin of the experimental inspection and identification system for remote quality control optimization, all of the devices on the experimental system including parts of products were converted into a 3D model by using Technomatix software. A digital twin of the experimental inspection and identification system with simulation functions by using virtual reality software is described in Sect. 11.4.4.
The paper is organized as follows. After this introductory section, section two offers a brief theoretical background on technologies used for contactless inspection and identification. Then, problem formulation methodology will be explained in detail. Subsequently, a problem solution will be described in Sect. 11.4. In the following section, existing problems are disguised, and possible solutions are proposed. Finally, some conclusion notes and future research directions are outlined.
2 Background and Literature Review
Technologies for quality control inspection can be divided into two basic groups: contact and contactless. Thanks to contactless technologies there is no need to stop object(s) during a quality control operation. Advanced contact technologies are mostly represented by coordinate measuring systems (CMS), which work in semiautomatic mode. But measuring the time achieved by these technologies is too long for checking production batches, and one of the main requirements of the Industry 4.0 concept is to minimize times between the appearance and the handling of errors (Groggert et al. 2017). Another disadvantage of this method is hard implementation into an automated conveyor line, because measuring table is a part of a CMS machine.
Suitable technologies for contactless quality control inspection are vision systems, and Radio-frequency identification (RFID) systems, and not just because these technologies work well together. RFID technologies can also be employed to track items such as pallets or products within a supply chain, and are additionally capable of ensuring full component process history for end users (Velandia et al. 2016). Both of these technologies can be used for certain tasks such as dimension measuring, errors detection, dynamic status identification of the product, and presence detection of the correct part for assembly process. These technologies can provide digital data acquisition from every part of production. The captured data can help to update and extend digital twins created from 3D models of devices or products. These digital data can be accumulated in Programmable Logic Controllers (PLC) or Supervisory Control and Data Acquisition (SCADA) system, but they can’t be stored in a long-term horizon, because industrial control and monitoring systems are quite limited in storage space. The possible solution is using Cloud Platform combined with the PLC system used as an IoT device. The subsequent data can be acquired from other sources such as RFID, etc. Data analyzes or knowledge extraction (data mining) is the main task of a cloud system. Cloud Platforms can provide user-friendly data representation by timelines, day/weeks or months automated reports, and alarm systems for critical production status usually as a message by email or SMS.
Industry 4.0 (commonly referred to as the fourth industrial revolution) is the current trend of automation, control, monitoring, and data exchange in manufacturing technologies. It includes cyber-physical systems (CPS), the Internet of things (IoT), cloud computing, cognitive computing, and other related disciplines (Xu and Duan 2019). There are many research papers concerned with to CPS in the Industry 4.0 concept (Xu and Duan 2019), Big Data processing (Li et al. 2019), and combination of CPS with IoT (Sanin et al. 2019). Industry 4.0 specifies many methods and technologies usable in product customization, because customer needs are directed toward unique products. The next requirement is a low-cost product with maximized customization. Theory and practical implementation are solved in the area of mass customization. Mass customization is a process of delivering wide-market goods and services which are modified to satisfy a specific customer’s needs in the manufacturing and industry services. It combines the flexibility and personalization of custom-made products with the low unit costs. The problem of mass customization is in connection to the Industry 4.0 concept, and variety based complexity issues were discussed by works Schmidt et al. (2015), Modrak (2017), Rauch et al. (2016); research results in complexity metrics problems for mass customization were published for example by works Mourtzis et al. (2017, 2018), Modrak and Soltysova (2018).
Many technologies rapidly developed, especially those which can significantly increase the effectivity of massive customization production:
-
rapid prototyping technologies for part printing,
-
virtual reality devices for training workers in virtual factory environments,
-
collaborative robots for fast cooperation with workers,
-
augmented reality devices for training and optimization of assembly process.
Rapid prototype part printing technologies now offer very high product customization with minimal of cost of production preparation (CNC program preparation, semi-product specification, cutting, and handling). Currently, there are no limitations in using this technology only for the plastic parts, because rapid prototyping devices can create parts also from other materials (aluminum, bronze parts, steel, or titan) using laser technologies. Material costs are significantly decreasing with technology expansion. The future proposal is printing a fully assembled product, not only parts for the next assembly process. The usability of rapid prototyping technologies in the concept of Industry 4.0 is described for example in Krowicki et al. (2019), Żabiński et al. (2017).
Customized production cannot use standard automation, because preparation work costs are higher than the profit. This problem is significant in the assembly process, which must usually be manual. A completely manual assembly process is very ineffective, but there is space for implementation of partial automation based on collaborative robots and assisted assembly by virtual devices for training workers and augmented devices for quality control and inoperative assistance.
Collaborative robots can work in the same workspace as human workers and prepare basic manipulations or perform simple monotonous assembly tasks. The main advantage is minimal transport delay of assembly parts between manual and automated operations which is necessary by using standard industrial robots. The next preference is an integrated vision system for additional inspection of manual operation. Collaborative robots usually provide an interface for digital data collection (force sensors data, vision data, and end effector positions data) and communication with external Cloud Platforms. Some research results of the mixed assembly process between humans and collaborative robots are described in works by Malik and Bilberg (2017), Akkaladevi et al. (2018), Realyvásquez-Vargas et al. (2019).
Virtual reality devices are currently available on the market (for example Oculus Rift or HTC Vive) combined with power PC provide enough performance to virtualize complete production process which can be used for employee training. It is possible to explain material flows in movement or to simulate critical situation without real production stop. Some research in the usability of virtual devices for factory simulation is described in Żywicki et al. (2018), Dong and Wang (2018), Gong et al. (2019). Augmented reality devices are usually named “smart glasses” and can significantly increase the effectivity of training new workers during their first assembly task (assisted assembly). Smart glasses can also be used after basic training for quality control of the assembly process. An AR-based worker support system for human-robot collaboration is described in H. Liu and Wang (2017).
A dynamic virtual representation of a physical object or system is a very important part of the Industry 4.0 concept. This digital replica of physical assets is called a digital twin, which continuously learns and updates itself from multiple sources. Case studies on digital twins are described in articles about digital twin ergonomic optimization (Caputo et al. 2019), digital twin commentary (Tomko and Winter 2019), learning experiences by digital twins (David et al. 2018), automatic generation of simulation-based digital twins (Martinez et al. 2018), digital twins for legacy systems (Khan et al. 2018), possibilities of digital twins technology (Shubenkova et al. 2018), and rapid qualification of product by digital twins (Mukherjee and DebRoy 2019).
Industrial vision systems are computer-based systems where software performs tasks for acquiring, processing, analyzing, and understanding digital images usually aimed at industrial quality assurance, defect detection, part recognition, etc. Research articles concerning industrial vision systems describe, for example, an automatic surface detection (Zhou et al. 2019), pre-inspection of steel frames (Martinez et al. 2019), embedded vision systems (Zidek et al. 2016), and stereo vision sensing (OrRiordan et al. 2018). Additional related research aspects of RFID system were presented in works focused on the security of tags (Han et al. 2019), detection of missing tags (Lee et al. 2019), and new searching protocol (Liu et al. 2019).
The availability of high-performance computers, high-capacity storage devices, and high-speed networks as well as the widespread adoption of hardware virtualization and service-oriented architecture has led in recent years to growth in cloud computing solutions (Raihana 2012). Related research areas on cloud systems and data mining are described in the papers concerning Clouds and Big Data connection (Lu and Xu 2019), cloud robotics data (Aissam et al. 2019), clouds in industrial automation (Mahmoud 2019), and chaos theory combination with clouds systems (Hu et al. 2019).
3 Problem Formulation and Methodology
This study proposes a practical approach to full digitization of data from the control quality process. The main motivation for this objective is based on the fact that commonly in practical applications gathered data from the product quality control process are not stored and subsequently used for continual quality improvement.
The following three major issues concerning experimental identification and inspection of parts of the product will be addressed in this study:
-
The first problem is transformation of data from vision systems to the storage system based on Cloud Platform and RFID technology.
-
The next task the bidirectional connection of digital twins (based on a 3D model) to an experimental quality control device.
-
The last task is data analyses and data knowledge extraction (data mining) for usable user-friendly report (timetables or alarms).
The simplified scheme of data transition from the vision systems and RFID technology to the control system is shown in Fig. 11.1.

The scheme of quality control digitization
As shown in Fig. 11.1, the quality control process consists of two contactless technologies RFID and vision systems. The methodology concept of inspection by vision system and identification through RFID technology is universally designed for any assembly part or end item which can be placed on the fixture or pallet in the conveyor system. A scheme of components used in an automated quality control system with digital twin and Cloud Platform communication is shown in Fig. 11.2.

The block diagram data of digitization with Cloud Platform and digital twin
The quality control process is divided into two phases:
-
1.
The first phase includes part inspection by vision system (dimensions, surface errors, parts localization verification).
-
2.
The second phase is aimed at assembly identification and personalization by using RFID system. The small assembly parts (nuts, screws, washers) can be inspected only by the vision systems.
The digital twin of the system has been developed through the simulation software Tecnomatix Plant simulator. A digital twin of the product is stored in the Cloud Platform due to big data volume for data processing. The following two bidirectional data synchronizations between real system and events in simulation software are expected:
-
simulation software can be modified in the real process,
-
modifications made in real plant are transformed into simulation model.
For this purpose, the digital twin was connected to OPC Server for data exchange with control system. A description of the digital twin for simulation of experimental inspection and identification system by using virtual reality software is provided in Sect. 11.4.
4 Problem Solution
In order to achieve full digitization of the quality control process we propose creating digital twin for inspection and identification system and personalized a digital twins for every assembled product and its parts. Preconditions for creation of digital twins are 3D models of real devices and products (parts, and end item). Under the term “end item” can be understand final output of assembly process comprising of a number of parts or subassemblies put together to perform a specific function. Two main approaches will be used to extend the 3D models with additional data mining and/or processing:
-
based on obtaining data from product parts and end items during inspection using the vision system,
-
based on data recording to the product during identification using RFID tags.
4.1 Quality Control Objects
For experimental purposes a simple subassembly product—extruder filament guide of rapid prototyping printer was selected and it consists of variable parts (see Fig. 11.3), i.e.:

Pictures of subassembly products (top left), 3D digital twin of the product (top right), 3D digital model in exploded view (bottom left), the list of the subassembly product components (bottom right)
-
two plastic parts made from a different material PLA or ABS, and each of them can differ by color,
-
a one stepper motor which can have a different step/force and variable spring for filament pressure modification.
3D model object consists of:
-
list of the product components (product structure),
-
3D graphical models of each part, and the assembled product (end item),
-
3D model of the fixture,
-
RFID tags and fasteners.
The picture and 3D models of the real assembled products are shown in Fig. 11.3.
The empty fixture, fixture with the parts, and fixture with the end item along with their 3D models are shown in Fig. 11.4.

The pictures of the fixture and quality control objects (left), along with their 3D model (right)
4.2 Data Acquisition During Quality Control Process
As mentioned earlier, one of the requirements of Industry 4.0 is full digitization of data and its storage for subsequent analyses. Any data acquired through using vision system or RFID technology has to be stored in suitable type of database. Proposed methods for data mining and processing are described in the next two sections.
4.2.1 Data Extraction from Vision Systems
The acquired data about the objects of the quality control on the conveyor line before and after the assembly process was collected by using three vision systems for four tasks of the quality control:
-
1.
Surface inspection of the stepper motor (see Fig. 11.5) by using Omron (vision system 1).
Fig. 11.5 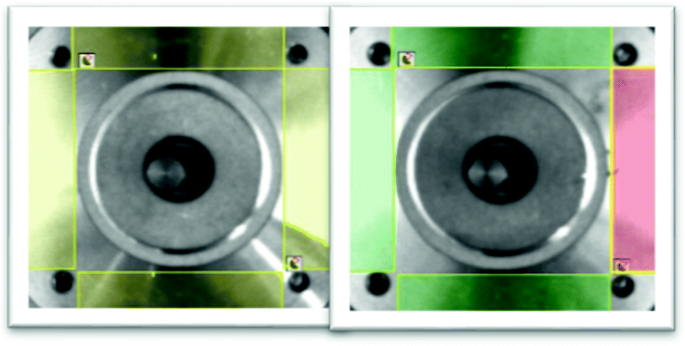
Vision system Omron (left), calibration of the recognition area (middle), detection of surface errors (right)
-
2.
Dimension control (see Fig. 11.6) by using Cognex (vision system 2).
Fig. 11.6 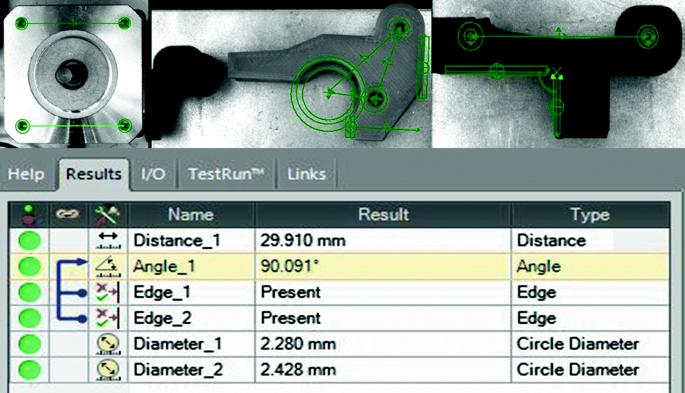
Dimension control of assembly elements (top), measured data interpretation from the Cognex vision system 2 (bottom)
-
3.
Parts presence control in the fixture (see Fig. 11.7) by using Sick Inspector I10 (vision system 3).
Fig. 11.7 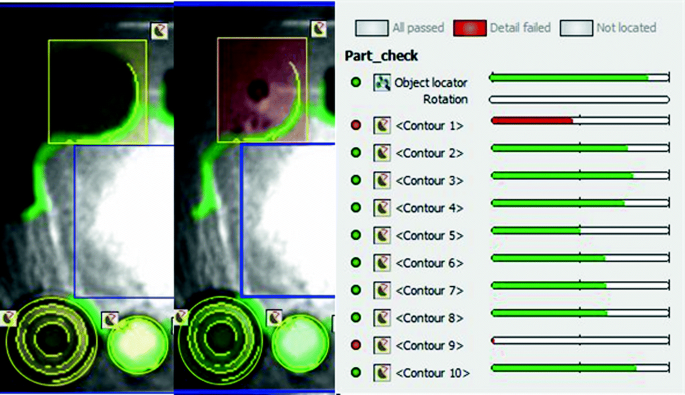
Calibration of the recognition area (left), parts presence control in the fixture along with graphical indication of missing part (right)
-
4.
Verification of the end item completeness (see Fig. 11.8) by using Sick Inspector I10 (vision system 3).
Fig. 11.8 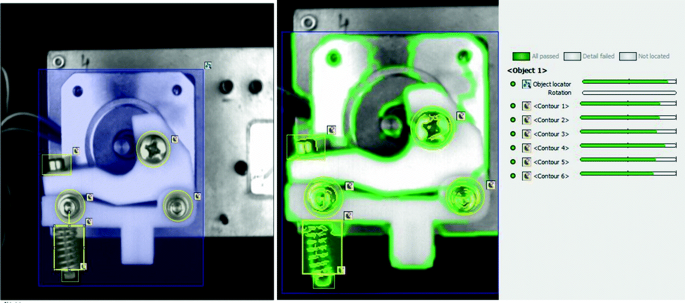
Verification of the end item completeness by Sick Inspector I10


An example of macro surface inspection of errors through applying vision system 1 is shown in Fig. 11.5.
As can be seen in Fig. 11.5, four sectors with simple true/false value represented by binary numbers have been defined for surface inspection. In Fig. 11.5 (right), there is detected surface error in one sector depicted by red box. The principle of error detection is based on a pixel color change with a defined range limit.
The next vision task is dimension control of every part of the end item. It is intended to measure mainly screw holes and its distances. The dimension inspection of the three assembly parts by using Cognex vision system is shown in Fig. 11.6.
Distances between thread holes of the stepper motor has to be checked on two layers, because this dimension is used for assembly other plastic parts made by rapid prototyping technology. Therefore, two values are measured. The first plastic part has to be checked for three features. There is the need to check two holes, one radius, and three dimensions (together six values are checked).
The second plastic part has to be checked for dimension of features for extruder filament guide. Therefore, four values have to be checked: two holes, one angle, and one dimension.
So, twelve dimensions are required to be checked by three snapshots during conveyor movement. It is impossible to stop the fixture because the conveyor doesn’t have fixed stops and a motor converter stops the belt using time ramps. The same position of the snapshot is secured by an optical sensor with a combination of path measured by incremental sensors in three places.
The next operation is check of parts presence control in the fixture before an assembly operation (see Fig. 11.7). The verification is based on the edges detections by using a reference image. There is a need to check the eleven product parts.
After the assembly is completed, it is necessary to verify assembled end item status. Control of assembly completeness is provided by vision system 3 (see Fig. 11.8).
To prove the end item completeness, a reference image (see Fig. 11.8 in left) was used to define regions with mounted parts. The reference image was developed for screws, nuts, and spring parts. Totally six values were checked in order to prove the end item completeness (see Fig. 11.8 in right). As it can be seen from Fig. 11.8, no nonconformity was found.
In order to encode the all available data from the vision systems to one packet, they can be divided into the four groups following the four tasks of the quality control described previously:
-
Data about the surface distortion of the stepper motor (four true/false values represented by 4-bit binary number).
-
Data from the dimension control (twelve float values of dimensions).
-
Data about parts position presence in the fixture (eleven true/false values represented by 11-bit binary number).
-
Data from the control of the end item completeness (six true/false values represented by 6-bit binary number).
The form of data encoding from vision systems to one packet is in Table 11.1.
Then, the data from vision systems can be encoded to one binary number as follows:
4 + 12*11 + 14 + 11 + 6 = 167 bits
This data can be saved to the end item through RFID tag and can serve as full component process history for end users.
4.2.2 Data Extraction from RFID System
In order to employ UHF RFID technology to identify assembled parts in the experimental inspection and identification system, one reader with two antennas will be used. The first antenna checks the presence of the part by RFID tags. The second antenna checks the assembly completeness and serves for data write to integrated RFID tag labels. RFID implementation with two antennas creates identification gate (input/output) and it writes the personalized data to main assembly RFID UHF tag. The used RFID system with two antennas, and RFID tag implementation for some assembly of parts and the fixture are shown in Fig. 11.9.

RFID gate (left), RFID tag implementation into the assembling parts and the fixture (right)
RFID tag transponder assigned in Fig. 11.9 as 0 is used for the fixture. Tags 1–3 are RFID labels placed on the three parts.
For the purpose of position detection of the fixture and the parts before it is captured by SV1, the laser sensor is used. Subsequently, the fixture position prior to it coming to RFID gate is detected by the optical sensor. The RFID gate serves for checking a presence of selected parts of the end item at the fixture. Block schemes of the fixture detections by optical sensor and laser sensor along with RFID detection are shown in Fig. 11.10.

The fixture and parts position detection by laser sensor and incremental encoder for the parts position identification [x, y, z] (left), the fixture position detection by RFID and optical sensor (right)
The distance values x, y, z are acquired by the incremental sensor providing the exact position for snapshot timing by the vision system. The picture of RFID antennas used is shown in Fig. 11.11.

RFID antenna for the fixture with the end item (left) and RFID antenna for fixture with the parts (right)
The RFID storage consists of four banks:
-
bank00 reserved memory (Kill/access passwords),
-
bank01 EPC (CRC, PC) writable,
-
bank10 TID Tag identification (read-only),
-
bank11 user memory.
UHF RFID ETSI standard for Europe with frequency 868 MHz has been used for the given purpose. All used tags are RFID-EPC Gen2 standard with 64 KB (524 288 bits) user memory.
The fixture is identified by an RFID tag in a plastic cover, and other three parts are identified by RFID labels. The fixture RFID tags are rewritable according to actual product. The class 2—rewritable passive tags were chosen for this purpose. The data for the end items can be written only once. The class 1 for the end item with write once read many passive RFID tags were chosen. EPC number contains 96 bits for unique product identification. For our end item can be selected GTIN trade object or CPI component for part identifier as the data structure with 32-bit access password memory lock. All tags after data recording must be locked with a 32-bit password to avoid a customer to rewrite the data. The proposed data frame storing all information acquired from the quality control process is shown in Fig. 11.12.

Modified RFID tag data structure with EPC Gen2 (96 bit)
Data from the control process are transferred to JSON format for simple writing in one step to RFID tag as follows:
- “ps”:
-
“****” (password)
- “sn”:
-
“0178ff0005575b0f” (EPC)
- “tid”:
-
“e20034120178ff0005575b0f” (fixed data)
- “usr”:
-
“00..00” (167 bit user data)
SCADA system can read the number of the presented tags along with its EPC number, and write encoded binary/float data to RFID tags.
Graphical panel to read and write data from the vision system to RFID tags is shown in Fig. 11.13.

An example of RFID tag read value
4.3 Data Storing and Analyzing Using Cloud Platform
The next task after data digitization is data storage and representation. The current trend of data storage in industrial applications are Cloud Platforms, since basic data visualization and knowledge extraction can be achieved by timelines. Advanced interactivity in remote monitoring of real manufacturing process can be achieved through its digital twin and virtual reality devices. Cloud Platforms are innovative systems comparing to standard SQL databases or SCADA data storages and they provide extended tools for data knowledge extraction from stored Big Data. Some cloud systems provide only graphical representation with simple alarm system (email, SMS), other ones serve as tools for data transformation and analyses.
In general, the acquired data from quality control operations can provide information including possible degradation of precision in real manufacturing processes. This degradation can predict maintenance time for the production machine(s) and reduce the production of faulty parts. Obtained data from vision systems can be stored in MindSphere Cloud Platform and create extension data in the digital twin model for all produced parts.
With the aim to demonstrate how obtained data from visions systems (see Sect. 11.4.2.1) can be transferred and used for monitoring and quality control, the following example will be shown.
Commonly, quality control activities are supported by recording and analyzing measured dimensions through Shewhart charts. This statistical process control tool was applied for analytical purpose in the following way. Upper control limits and Lower control limits will be used as warning limits for early detection. Acquired data from the vision system 2 are transferred through OPC Server (see an example in Fig. 11.14 top) into MindSphere Cloud Platform, where this data in form of timelines are compared to the warning limit values. Based on that automated reports can be generated, and alarm messages sent by email or SMS. An example of Cognex OPC Server for data transfer to MindSphere Cloud Platform is shown in Fig. 11.14.

OPC Server data from vision system (top left), MindSphere value list (top right), measurements timeline with alarm message example (bottom)
If some dimension of the product parts would be out of the setup range, this online information is used to substitute a wrong part by a new one.
4.4 Digital Twin with Simulation and Virtual Reality
As was outlined in introductory section of this chapter a digital twin of physical assets can be effectively used for various purposes including for remote quality control. In this intention all the devices of the experimental inspection and identification system including parts of product were converted into 3D models by using Technomatix software.
The 3D model of presented quality control and identification system (see Fig. 11.15) consists of:

3D digital twin (left) and experimental inspection and identification system (right)
-
conveyor device,
-
Vision systems and RF identification devices,
-
PLC control system.
The 3D models were created in Autodesk Inventor.
The simulation of the systems for quality control purposes and is usually executed offline, prior to beginning the production run. In our approach, we connect simulation through digital twin of the system to the PLC of the physical asset and to synchronize any optimization activities in very short time. The principle of bidirectional data synchronization between real device process and simulation is shown in Figs. 11.16 and 11.17.

The scheme of bidirectional data synchronization between quality control system and digital twin

An example of 2D and 3D simulation in Tecnomatix plant simulator with OPC communication
Python OPC UA server is responsible for data transfer from digital twin simulation to PLC system, and moreover it creates data communication bridge between Cloud Platform and the real system.
The simulation of the inspection/identification process is executed through Plant Simulator software and allows to modify crucial parameters in order to reach improvements in quality of products and productivity of manufacturing. The main advantage of the digital twin is very fast optimization, because we don’t need neither to change program in the PLC control system nor by the SCADA system. But, it allows to change optimized parameters straight from simulation software to manufacturing. Remote monitoring and quality control activities are possible thanks to smart server integrated in HMI/SCADA touch panel KTP400 Basic. One can access and control inspection/identification process by Android smartphone or from PC. An example of remote monitoring is shown in Fig. 11.18.

Remote monitoring of inspection device by mobile phone (left) and by PC (right)
The simulation of the quality control operations can be transferred into virtual reality devices, e.g., HTC Vive Pro or Oculus Rift. The staff responsible for the quality control can monitor the device with synchronized data from real production in a 3D virtual digital twin. An example of transfer Technomatix simulation into virtual reality by HTC Vive Pro is shown in Fig. 11.19.

HTC Vive Pro (left), 3D model in plant simulator (middle), digital twin inspection in VR (right)
5 Discussion
The main problem of currently used Clouds Platforms is lack of support for linking 3D personalized models (digital twins) represented by Binary Large Objects (BLOB) with the clouds. Available commercial clouds offer only basic variables such as integer, float, bool, data time, and string. The clouds are primarily focused on data collection, basic graphical representation to timelines, and data knowledge extraction for basic alarm systems with periodical reports (days, week, months, and years). Data are structured in simple frames and defined only by numbers and strings. It is not possible to define advanced structures with hybrid data, for example images, and binary data combined with numerical/string variables. In the current status of clouds technology it is very hard to store a personalized digital twin of product in one storage system (cloud).
The one possible solution is to create a separate database for a personalized digital twin 3D model with a hyperlink to measure data stored in the cloud. This solution can only link data one way from 3D model to cloud, not back. But the main advantage of this approach is increased security for critical data about products and technology, because 3D model is stored in local database.
The next solution can be modification of an open-source cloud system to store BLOB, image data, and measured values in one place. The main advantage can be low operating costs because a whole solution can operate on a local server.
It can be also mentioned that all used identification and inspection devices have their limitations (IoT, Vision systems, RFID tags). A UHF RFID system cannot be used for very small parts, because the tag size is limited by antenna length. LF or HF RFID tags are the solutions for tagging smaller parts but they are not primarily developed for industrial parts (mainly for food industry). An industrial vision system is a closed source system to algorithm modification. The main problems arise in surface errors recognizing very geometrically complicated parts. One of the possible ways to solve this problem can be exploitation of convolutional neural networks with deep learning techniques. This approach is currently tested on experimental devices, but there is a perspective of its fast transfer to commercial devices.
6 Conclusions
In this study a computer vision system along with RFID system applications for contactless quality control activities before and after the assembly process has been presented. It has been demonstrated through the experimental inspection and identification system by using a subassembly module for a rapid prototyping printer. Presented experiments aimed to verify the proposed approach to capture and transport data from production process to the extended digital 3D twin model. The bridge for transfer data in both directions was performed by OPC technology, mainly OPC UA Server (OPC DCOM). OPC Server was written in the Python programming language customized for data collection from many sources. The digital twin of inspection and identification system was designed for online connection to synchronize data from a quality control process. Extended data from the digital twin was also synchronized online with Cloud Platform. The main purpose of using the RFID gate was to personalize all products with acquired dimension data stored in the main assembly RFID tag label. RFID system has been used to localize parts on the conveyor line by RSSI signal from tags.
The ambition of this study was to provide ideas for maximizing utilization of gathered data from the product quality control process, because many companies don’t store and use this data, e.g., for an analysis purpose. It was proved that the data used so far are only for product classification into two groups, i.e., a good product or noncompliant product, can be utilized much more through the digitization platforms used in our study.
Further experimental works will focus on long-term data collection, reliability verification with implementation to some existing quality check systems in a real production environment.
References
Aissam, Manal, Mohammed Benbrahim, and Mohammed Nabil Kabbaj. 2019. Cloud Robotic: Opening a New Road to the Industry 4.0. In New Developments and Advances in Robot Control. Singapore: Springer. https://doi.org/10.1007/978-981-13-2212-9_1.
Akkaladevi, S.L., M. Plasch, S. Maddukur, C. Eitzinge, A. Pichlee, and R. Rinner. 2018. Toward an Interactive Reinforcement Based Learning Framework for Human Robot Collaborative Assembly Processes. Frontiers in Robotics and AI 5. https://doi.org/10.3389/frobt.2018.00126.
Caputo, Francesco, Alessandro Greco, Marcello Fera, and Roberto Macchiaroli. 2019. Digital Twins to Enhance the Integration of Ergonomics in the Workplace Design. International Journal of Industrial Ergonomics 71: 20–31. https://doi.org/10.1016/j.ergon.2019.02.001.
David, Joe, Andrei Lobov, and Minna Lanz. 2018. Learning Experiences Involving Digital Twins. In IECON 2018—44th Annual Conference of the IEEE Industrial Electronics Society, 3681–3686. https://doi.org/10.1109/IECON.2018.8591460.
Da Xu, Li, and Lian Duan. 2019. Big Data for Cyber Physical Systems in Industry 4.0: A Survey. Enterprise Information Systems 13 (2): 148–169. https://doi.org/10.1080/17517575.2018.1442934.
Dong, Liang, and Zhifeng Wang. 2018. Plant Layout and Simulation Roaming System Based on Virtual Reality Technology. In MATEC Web of Conferences, ed. G. Beydoun, 214. https://doi.org/10.1051/matecconf/201821404001.
Gong, L., J. Berglund, Å. Fast-Berglund, B. Johansson, Z. Wang, and T. Börjesson. 2019. Development of Virtual Reality Support to Factory Layout Planning. International Journal on Interactive Design and Manufacturing (IJIDeM). https://doi.org/10.1007/s12008-019-00538-x.
Groggert, S., M. Wenking, R.H. Schmitt, and T. Friedli. 2017. Status quo and Future Potential of Manufacturing Data Analytics—An Empirical Study. In 2017 IEEE International Conference on Industrial Engineering and Engineering Management (IEEM), 779–783. https://doi.org/10.1109/IEEM.2017.8289997.
Han, W., W. Liu, K. Zhang, Z. Li, and Z. Liu. 2019. A Protocol for Detecting Missing Target Tags in RFID Systems. Journal of Network and Computer Applications 132: 40–48. https://doi.org/10.1016/j.jnca.2019.01.027.
Hu, Y., F. Zhu, L. Zhang, Y. Lui, and Z. Wang. 2019. Scheduling of Manufacturers Based on Chaos Optimization Algorithm in Cloud Manufacturing. Robotics and Computer-Integrated Manufacturing 58: 13–20. https://doi.org/10.1016/j.rcim.2019.01.010.
Khan, Adnan, Martin Dahl, Petter Falkman, and Martin Fabian. 2018. Digital Twin for Legacy Systems: Simulation Model Testing and Validation. In 2018 IEEE 14th International Conference on Automation Science and Engineering (CASE), 421–426. https://doi.org/10.1109/COASE.2018.8560338.
Krowicki, Paweł, Grzegorz Iskierka, Bartosz Poskart, Maciej Habiniak, and Tomasz Będza. 2019. Scanπ—Integration and Adaptation of Scanning and Rapid Prototyping Device Prepared for Industry 4.0. In Intelligent Systems in Production Engineering and Maintenance, 574–586. https://doi.org/10.1007/978-3-319-97490-3_55.
Lee, C.-C., S.-D. Chen, C.-T. Li, C.-L. Cheng, and Y.-M. Lai. 2019. Security Enhancement on an RFID Ownership Transfer Protocol Based on Cloud. Future Generation Computer Systems 93: 266–277. https://doi.org/10.1016/j.future.2018.10.040.
Li, Gang, Jianlong Tan, and Sohail S. Chaudhry. 2019. Industry 4.0 and Big Data Innovations. Enterprise Information Systems 13 (2): 145–147. https://doi.org/10.1080/17517575.2018.1554190.
Liu, Chuan-Gang, I-Hsien Liu, Chang-De Lin, and Jung-Shian Li. 2019. A Novel Tag Searching Protocol with Time Efficiency and Searching Accuracy in RFID Systems. Computer Networks 150: 201–216. https://doi.org/10.1016/j.comnet.2019.01.011.
Liu, Hongyi, and Lihui Wang. 2017. An AR-Based Worker Support System for Human-Robot Collaboration. Procedia Manufacturing 11: 22–30. https://doi.org/10.1016/j.promfg.2017.07.124.
Lu, Yuqian, and Xu Xun. 2019. Cloud-Based Manufacturing Equipment and Big Data Analytics to Enable On-Demand Manufacturing Services. Robotics and Computer-Integrated Manufacturing 57: 92–102. https://doi.org/10.1016/j.rcim.2018.11.006.
Mahmoud, Magdi S. 2019. Architecture for Cloud-Based Industrial Automation. Robotics and Computer-Integrated Manufacturing: 51–62. https://doi.org/10.1007/978-981-13-1165-9_6.
Malik, Ali Ahmad, and Arne Bilberg. 2017. Framework to Implement Collaborative Robots in Manual Assembly: A Lean Automation Approach. In 28th DAAAM International Symposium on Intelligent Manufacturing and Automation, 1151–1160. https://doi.org/10.2507/28th.daaam.proceedings.160.
Martinez, Gerardo Santillan, Seppo Sierla, Tommi Karhela, and Valeriy Vyatkin. 2018. Automatic Generation of a Simulation-Based Digital Twin of an Industrial Process Plant. In IECON 2018—44th Annual Conference of the IEEE Industrial Electronics Society, 3084–3089. https://doi.org/10.1109/IECON.2018.8591464.
Martinez, Pablo, Rafiq Ahmad, and Mohamed Al-Hussein. 2019. A Vision-Based System for Pre-Inspection of Steel Frame Manufacturing. Automation in Construction 97: 151–163. https://doi.org/10.1016/j.autcon.2018.10.021.
Modrak, V. (ed.). 2017. Mass Customized Manufacturing: Theoretical Concepts and Practical Approaches. CRC Press. https://doi.org/10.1201/9781315398983.
Modrak, Vladimir, and Zuzana Soltysova. 2018. Development of Operational Complexity Measure for Selection of Optimal Layout Design Alternative. International Journal of Production Research 56 (24): 7280–7295. https://doi.org/10.1080/00207543.2018.1456696.
Mourtzis, Dimitris, Sophia Fotia, and Nikoletta Boli. 2017. Metrics Definition for the Product-Service System Complexity Within Mass Customization and Industry 4.0 Environment. In 2017 International Conference on Engineering, Technology and Innovation (ICE/ITMC), 1166–1172. https://doi.org/10.1109/ICE.2017.8280013.
Mourtzis, Dimitris, Sophia Fotia, Nikoletta Boli, and Pietro Pittaro. 2018. Product-Service System (PSS) Complexity Metrics Within Mass Customization and Industry 4.0 Environment. The International Journal of Advanced Manufacturing Technology 97 (1–4): 91–103. https://doi.org/10.1007/s00170-018-1903-3.
Mukherjee, Tridibesh, and Tarasankar DebRoy. 2019. A Digital Twin for Rapid Qualification of 3D Printed Metallic Components. Applied Materials Today 14: 59–65. https://doi.org/10.1016/j.apmt.2018.11.003.
OrRiordan, Andrew, Thomas Newe, Gerard Dooly, and Daniel Toal. 2018. Stereo Vision Sensing: Review of Existing Systems. In 2018 12th International Conference on Sensing Technology (ICST), 178–184. https://doi.org/10.1109/ICSensT.2018.8603605.
Raihana, G.F.H. 2012. Cloud ERP—A Solution Model. International Journal of Computer Science and Information Technology & Security 2 (1): 76–79.
Rauch, E., P. Dallasega, and D.T. Matt. 2016. Sustainable Production in Emerging Markets Through Distributed Manufacturing Systems (DMS). Journal of Cleaner Production 135: 127–138. https://doi.org/10.1016/j.jclepro.2016.06.106.
Realyvásquez-Vargas, A., K. Cecilia Arredondo-Soto, J. Luis García-Alcaraz, B. Yail Márquez-Lobato, and J. Cruz-García. 2019. Introduction and Configuration of a Collaborative Robot in an Assembly Task as a Means to Decrease Occupational Risks and Increase Efficiency in a Manufacturing Company. Robotics and Computer-Integrated Manufacturing 57: 315–328. https://doi.org/10.1016/j.rcim.2018.12.015.
Sanin, C., Z. Haoxi, I. Shafiq, M.M. Waris, C. Silva de Oliveira, and E. Szczerbicki. 2019. Experience Based Knowledge Representation for Internet of Things and Cyber Physical Systems with Case Studies. Future Generation Computer Systems 92: 604–616. https://doi.org/10.1016/j.future.2018.01.062.
Schmidt, R., M. Möhring, R.C. Härting, C. Reichstein, P. Neumaier, and P. Jozinović. 2015. Industry 4.0-Potentials for Creating Smart Products: Empirical Research Results. In International Conference on Business Information Systems, 16–27. Cham: Springer. https://doi.org/10.1007/978-3-319-19027-3_2.
Shubenkova, K., A. Valiev, V. Shepelev, S. Tsiulin, and K.H. Reinau. 2018. Possibility of Digital Twins Technology for Improving Efficiency of the Branded Service System. In 2018 Global Smart Industry Conference (GloSIC), 1–7. https://doi.org/10.1109/GloSIC.2018.8570075.
Tomko, Martin, and Stephan Winter. 2019. Beyond Digital Twins—A Commentary. Environment and Planning B: Urban Analytics and City Science 46 (2): 395–399. https://doi.org/10.1177/2399808318816992.
Velandia, D.M.S., N. Kaur, W.G. Whittow, P.P. Conway, and A.A. West. 2016. Towards Industrial Internet of Things: Crankshaft Monitoring, Traceability and Tracking Using RFID. Robotics and Computer-Integrated Manufacturing 41: 66–77. https://doi.org/10.1016/j.rcim.2016.02.004.
Żabiński, Tomasz, Tomasz Mączka, and Jacek Kluska. 2017. Industrial Platform for Rapid Prototyping of Intelligent Diagnostic Systems. In Polish Control Conference, 712–721. Cham: Springer. https://doi.org/10.1007/978-3-319-60699-6_69.
Zhou, Q., R. Chen, B. Huang, C. Liu, J. Yu, and X. Yu. 2019. An Automatic Surface Defect Inspection System for Automobiles Using Machine Vision Methods. Sensors 19 (3): 644. https://doi.org/10.3390/s19030644.
Zidek, Kamil, Vladimir Maxim, Jan Pitel, and Alexander Hosovsky. 2016. Embedded Vision Equipment of Industrial Robot for Inline Detection of Product Errors by Clustering-Classification Algorithms. International Journal of Advanced Robotic Systems 13 (5). https://doi.org/10.1177/1729881416664901.
Żywicki, Krzysztof, Przemysław Zawadzki, and Filip Górski. 2018. Virtual Reality Production Training System in the Scope of Intelligent Factory. In International Conference on Intelligent Systems in Production Engineering and Maintenance, 450–458. Cham: Springer. https://doi.org/10.1007/978-3-319-64465-3_43.
Author information
Authors and Affiliations
Corresponding author
Editor information
Editors and Affiliations
Rights and permissions
Open Access This chapter is licensed under the terms of the Creative Commons Attribution 4.0 International License (http://creativecommons.org/licenses/by/4.0/), which permits use, sharing, adaptation, distribution and reproduction in any medium or format, as long as you give appropriate credit to the original author(s) and the source, provide a link to the Creative Commons license and indicate if changes were made.
The images or other third party material in this chapter are included in the chapter's Creative Commons license, unless indicated otherwise in a credit line to the material. If material is not included in the chapter's Creative Commons license and your intended use is not permitted by statutory regulation or exceeds the permitted use, you will need to obtain permission directly from the copyright holder.
Copyright information
© 2020 The Author(s)
About this chapter

Cite this chapter
Židek, K., Modrák, V., Pitel, J., Šoltysová, Z. (2020). The Digitization of Quality Control Operations with Cloud Platform Computing Technologies. In: Matt, D., Modrák, V., Zsifkovits, H. (eds) Industry 4.0 for SMEs. Palgrave Macmillan, Cham. https://doi.org/10.1007/978-3-030-25425-4_11
Download citation
DOI: https://doi.org/10.1007/978-3-030-25425-4_11
Published:
Publisher Name: Palgrave Macmillan, Cham
Print ISBN: 978-3-030-25424-7
Online ISBN: 978-3-030-25425-4
eBook Packages: Business and ManagementBusiness and Management (R0)